Double bottom created in Dmart 1) On support dmart have formed double bottom pattern
2) falling wedge pattern makes more confirmation that buyers are taking control now
3) In negative market stock didn't breakdown
4) In short term stock may reach 4300 levels with strict sl R:R is good
Wpattern

Kross cmp 176.22 by Daily Chart view since listedKross cmp 176.22 by Daily Chart view since listed
- Support Zone 156 to 166 Price Band
- Resistance Zone 180 to 192 Price Band
- Volume attempting sync with avg traded qty
- Bullish Double Bottom "W" with Support Zone base
- Falling Resistance Trendline Breakout has well sustained
- Resistance Zone neckline acting as good hurdle for Breakout
- Majority of the Technical Indicators seen trending fairly positive

#Gold | From Double Top Breakdown to Potential W Reversal#XAUUSD | 4H Chart
Formed an M pattern (Double Top) , broke down, and completed its target ✅
Now taking support at the demand zone, showing early signs of a W-pattern formation (potential bullish reversal).
Support: 3944.43 / 3915.52 / 3892.95-3897.13
Immediate Resistance: 4030.34-4033.87
Key Resistance Levels:
4056.70-4065.52 / 4133.00-4154.79 / 4185.91-4205.12 (previous M-pattern breakdown zone)
Expectation:
If #XAUUSD surpasses 4034 on 4 HCB , price may retest the M-pattern breakdown zone (4185-4205) .
#Gold #XAUUSD #Wpattern #Mpattern #ChartPattern #PriceAction #Commodities
📌 Disclaimer: This analysis is shared for educational purposes only. It is not a buy/sell recommendation. Please do your own research before making any trading decisions.

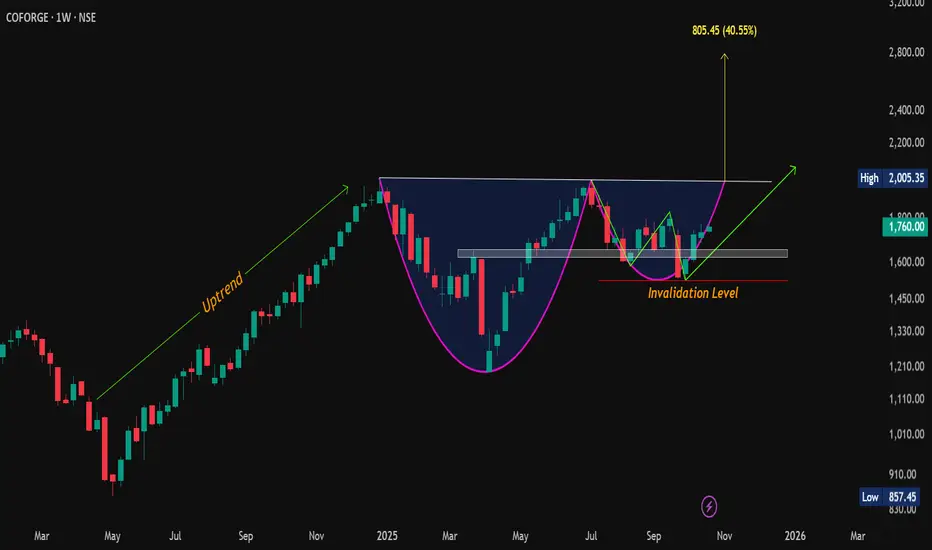
Pattern Inside a Pattern! Cup & Handle Meets the W on #Coforge💰 CMP: 1760
🎯 Cup & Handle Target: 2790 (~58% from cmp)
⚡️ W-Pattern Target: 2060
🧱 Supports: 1658-1622 / 1584
🚧 Resistances: 1795-1830 / 1950-2005
❌ Invalidation: Weekly Close Below 1525
📈 Bullish setup loading… watch for breakout above neckline!
#Coforge | #CupAndHandle | #WPattern | #ChartPatterns | #SwingTrading | #PriceAction | #BreakoutSetup
📌 Disclaimer: This analysis is shared for educational purposes only. It is not a buy/sell recommendation. Please do your own research before making any trading decisions.
Double bottom W pattern in LIC housing financeDouble bottom W pattern in LIC housing finance
may test its resistance zone
good for upside movement

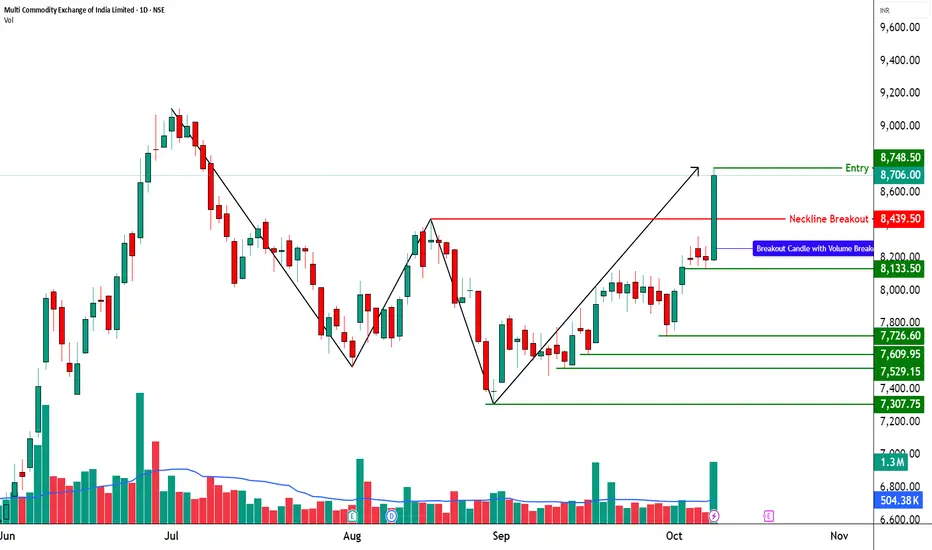
MCX - Bullish W-Pattern (Double Bottom Breakout)________________________________________
🚀 Multi Commodity Exchange of India Ltd (NSE: MCX) | Bullish W-Pattern (Double Bottom Breakout)
📊 Current Market Snapshot
CMP: ₹8,706.00
Sector: Financial Services / Commodity Exchange
Pattern Observed: 🟢 W-Pattern (Double Bottom Breakout)
Candlestick Signal: Strong Bullish Marubozu + Volume Breakout
Strength Rating: ⭐⭐⭐⭐☆ (High-Conviction Bullish Reversal)
________________________________________
🧭 Technical Indicators
The technical indicators on this chart are flashing strong bullish signals. Momentum is clearly positive, supported by a Bullish Marubozu candle, which reflects strong buying pressure and conviction. The chart also indicates a possible breakout formation, confirmed by a strong bullish candle backed by extremely high volume — a classic sign of institutional participation.
Multiple bullish confirmations like swing trade alignment, intraday signal, RSI breakout, and bullish engulfing pattern further add weight to the uptrend. The Bollinger Band breakout and Bullish VWAP suggest sustained price expansion, while the BB Squeeze-Off hints at volatility returning in favor of the bulls. Altogether, these indicators reinforce a buy-on-dip structure with potential for continuation toward higher resistance zones.
MCX is currently trading in the Progressive Zone, indicating a phase of steady upward momentum where buyers are actively accumulating positions. This zone reflects controlled bullish strength and sustained participation, suggesting that the stock is gearing up for a potential breakout continuation.
The KST (Know Sure Thing) indicator for MCX is in bullish territory, confirming the upward momentum seen in price action. With a strong positive crossover and supportive strength reading, the KST reinforces the ongoing uptrend — indicating that momentum remains firmly in favor of the bulls and the stock could continue its northward journey.
MCX is trading between its Swing High at ₹8,439.5 and Swing Low at ₹7,304. The Top Range near ₹9,115 acts as a major resistance zone, while the Bottom Range around ₹7,304 provides strong support, defining a clear bullish structure with room for further upside if momentum sustains.
________________________________________
📊 Trade Setup (Strong Momentum Entry)
Entry: ₹8,748.50
________________________________________
💡 Learning Note
This setup is a textbook example of a W-pattern (Double Bottom) breakout, where price reverses from a downtrend after forming two clear lows at similar levels. The neckline breakout with heavy volume confirms a shift in market sentiment from bearish to bullish. Such patterns highlight how volume expansion and strong breakout candles validate reversal strength and help traders identify early entry points in new uptrends.
________________________________________
⚠️ Disclosure & Disclaimer – Please Read Carefully
The information shared here is meant purely for learning and awareness. It is not a buy or sell recommendation and should not be taken as investment advice. I am not a SEBI-registered investment adviser, and all views expressed are based on personal study, chart patterns, and publicly available market data.
Position Status: No active position in MCX at the time of analysis.
Data Source: Past Chart reference(Historical levels)
Trading—whether in stocks or options—carries risk. Markets can move unexpectedly, and losses can sometimes exceed the money you have invested. Past performance or setups do not guarantee future results.
If you are a beginner, treat this as a learning guide and practice with paper trades before risking real money. If you are experienced, always assess your own risk, position sizing, and strategy suitability before entering trades.
Consult a SEBI-registered financial adviser before making any real trading decision. By engaging with this content, you acknowledge full responsibility for your trades and investments.
________________________________________
💬 Found this useful?
🔼 Give this post a Boost to help more traders discover clean, structured learning.
✍️ Drop your thoughts, questions, or setups in the comments — let’s grow together!
🔁 Share with fellow traders and beginners to spread awareness.
👉 “If you liked this breakdown, follow for more clean, structured setups with discipline at the core.”
🚀 Stay Calm. Stay Clean. Trade With Patience.
Trade Smart | Learn Zones | Be Self-Reliant 📊
________________________________________
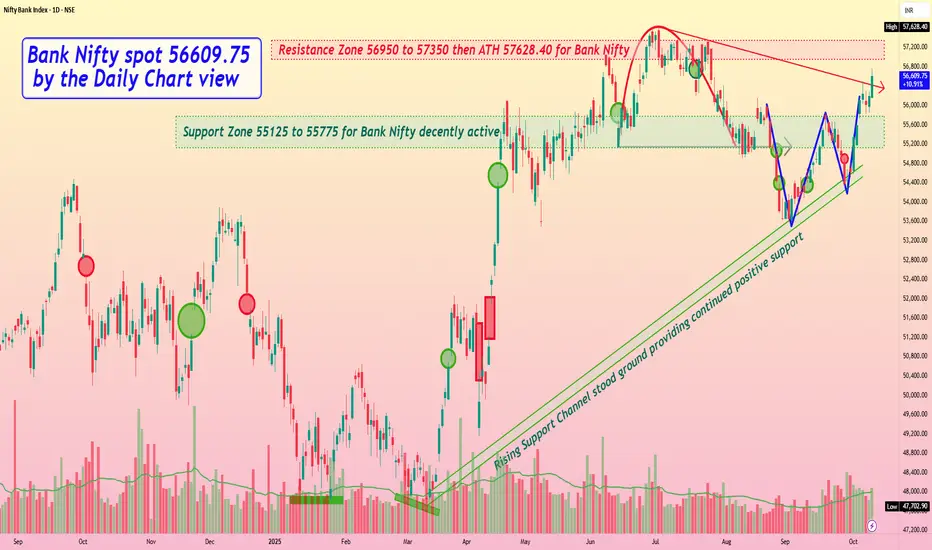
Bank Nifty spot 56609.75 by the Daily Chart view - Weekly updateBank Nifty spot 56609.75 by the Daily Chart view - Weekly update
- Support Zone 55125 to 55775 for Bank Nifty decently active
- Resistance Zone 56950 to 57350 then ATH 57628.40 for Bank Nifty
- Falling Resistance Trendline Breakout seems in the making for uptrend
- Rising Support Channel stood ground and provided steady positive support
- Bullish Rising W pattern done and well sustained by current trending momentum
- Support Zone tested and tested over the past full week, indicating probable positive trend
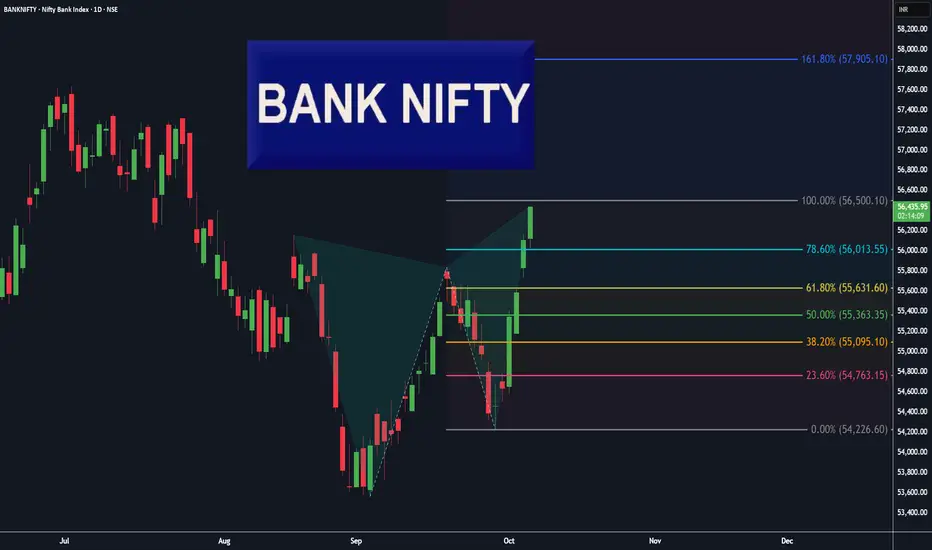
BankNifty Daily, Butterfly pattern completed!Beautiful Butterfly 🦋 pattern has completed on Daily chart of BankNifty.
Expect some profit booking or neutral trend in coming days up-to 55840 level.
Most near level is the re-test of 78.6% level ( 56013 ), for a new UP trend ( investors ).
" Buy 🟢 " above 56013 with the stop loss 🔻 of 55840, for the
🎯 Target 1: 56300
🎯 Target 2: 56500
🎯 Target 3: 57000
🎯 Target 4: open.
" Sell 🔴 " below 55631with the stop loss 🔺 of 55843, for the
🎯 Target 1: 55363
🎯 Target 2: 55095
🎯 Target 3: 54763
🎯 Target 4: open.
Smart Levels is Smart Trading. 👨🎓
⚠ RISK DISCLAIMER :
All content provided by "TradeWithKeshhav" is for information & educational purposes only.
It does not constitute any financial advice or a solicitation to buy or sell any securities of any type. All investments / trading involve risks. Past performance does not guarantee future results / returns.
Always do your own analysis before taking any trade.
Regards :
@TradeWithKeshhav & team
Happy Trading and Investing!
Nifty 50 Daily, Trend Based Fibonacci Extension (Natural levels)Hey Traders, I hope you all are doing well in your life.
Market is nature's response and Price is the God.
Let's check the market with the help of natural levels tool : Trend Based Fibonacci Extension .
After forming a ' W ' pattern on Daily chart, Nifty50 has given a pull-back ( base for Fib-Extension level tool, 24587 ).
Most near level is the re-test of 38.2% level ( 24980 ), for a new UP trend ( investors ).
" Buy 🟢 " above 25110 with the stop loss 🔻 of 24980, for the
🎯 Target 1: 25402
🎯 Target 2: 25650
🎯 Target 3: 26260
🎯 Target 4: 26500.
" Sell 🔴 " below 24960 with the stop loss 🔺 of 25110, for the
🎯 Target 1: 24880
🎯 Target 2: 24780
🎯 Target 3: 24680
🎯 Target 4: 24500.
Smart Levels is Smart Trading. 👨🎓
⚠ RISK DISCLAIMER :
All content provided by "TradeWithKeshhav" is for information & educational purposes only.
It does not constitute any financial advice or a solicitation to buy or sell any securities of any type. All investments / trading involve risks. Past performance does not guarantee future results / returns.
Always do your own analysis before taking any trade.
Regards :
@TradeWithKeshhav & team
Happy Trading and Investing!

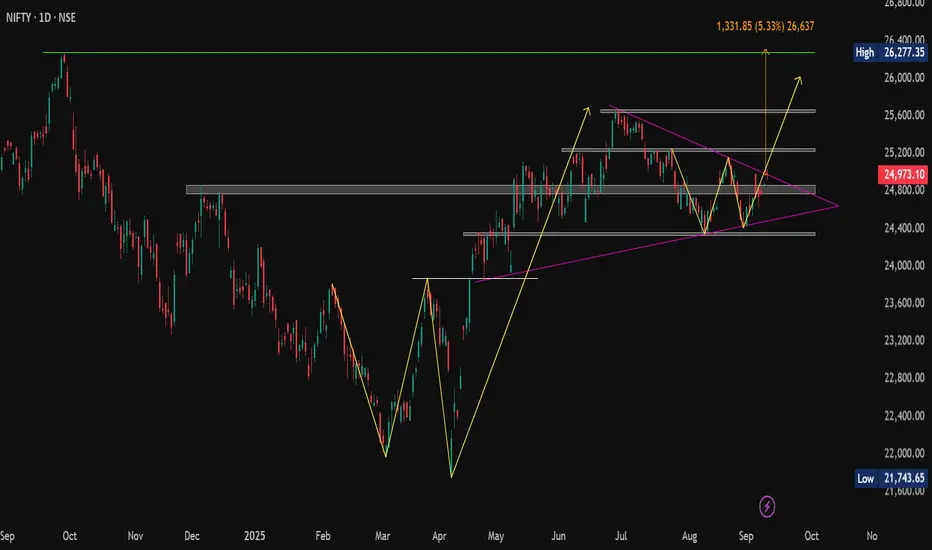
NIFTY: Ascending Triangle Breakout In PlayTechnical Outlook:
CMP: 24,973
📍 Immediate Support Zone: 24,858 – 24,768
📍 Strong Support Zone: 24,363 – 24,329
📍 Immediate Resistance Zone: 25,083 – 25,255 (Clustered zone)
📍 Strong Resistance Zones:
• 25,638 – 25,669
• 26,216 – 26,277 (All-Time High vicinity)
📈 Breakout Alerts:
✅ W-Pattern Breakout above 25,154 (Daily Candle Basis)
🎯 Target: 26,000
✅ Ascending Triangle Breakout above 24,972.50 ( Confirmed on Closing Basis today )
🎯 Target: 26,304 – aligning closely with the ATH of 26,277.35
Conclusion:
With two bullish patterns triggering nearly simultaneously, momentum is building. A sustained move above the immediate resistance cluster could fuel a rally towards uncharted territory.
Watch 25,154 and 25,255 – a clean move above could be the gateway to new all-time highs.
#BreakoutAlert | #TechnicalAnalysis | #ChartPatterns | #PriceAction
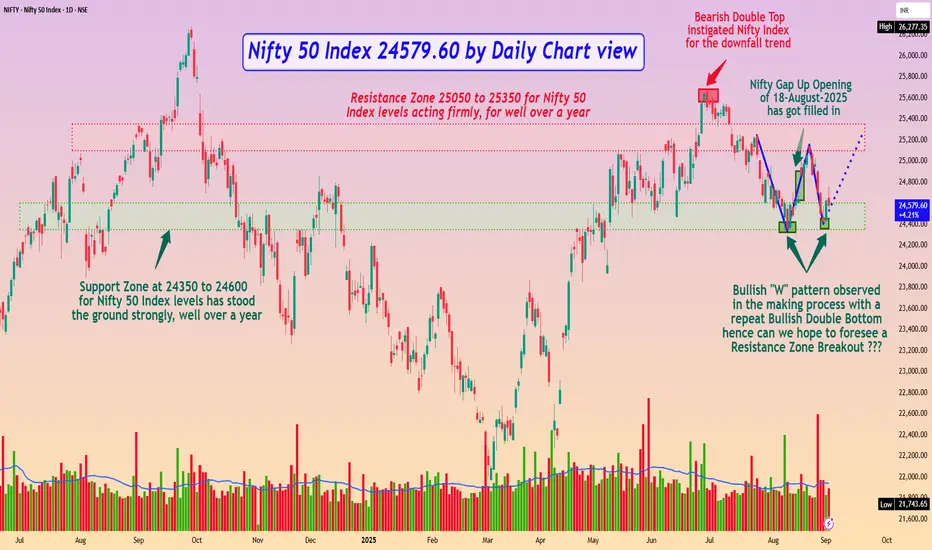
Nifty 50 Index 24579.60 by Daily Chart viewNifty 50 Index 24579.60 by Daily Chart view
- Nifty Gap Up Opening of 18-August-2025 has got filled in
- Bearish Double Top instigated Nifty Index for the downfall trend
- Resistance Zone 25050 to 25350 for Nifty 50 Index levels acting firmly, for well over a year
- Support Zone at 24350 to 24600 for Nifty 50 Index levels has stood the ground strongly, well over a year
- Bullish "W" pattern observed in the making process with a repeat Bullish Double Bottom hence can we hope to foresee a Resistance Zone Breakout ???
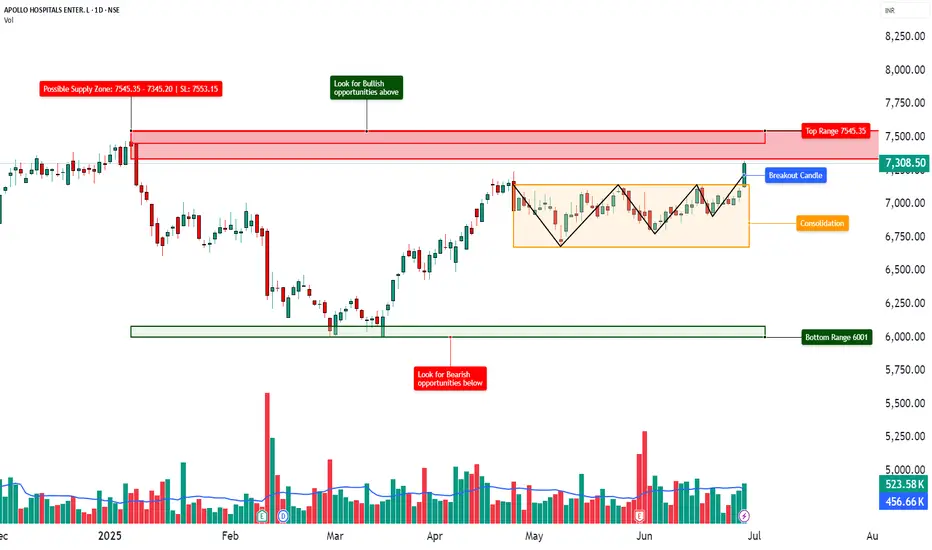
APOLLOHOSP - TECHNICAL ANALYSIS________________________________________________________________________________
📈 Apollo Hospitals Enterprises Ltd. (APOLLOHOSP) – TECHNICAL ANALYSIS
📆 Date: June 28, 2025 | Timeframe: Daily Chart
🔍 For Educational Purposes Only
________________________________________________________________________________
📊 Structure Overview
• Pattern: Rounded "W" Base Breakout
• Breakout Level: ₹7,324
• Current Price: ₹7,308.50 (pullback after breakout)
• Volume: 523.58K vs avg. 456.66K – confirming breakout strength
• Trend Bias: Bullish (as long as price sustains above ₹7,176–₹7,043)
________________________________________________________________________________
📌 Key Zones
🔺 Top Range Resistance: ₹7,545.35
📛 Possible Supply Zone: ₹7,545.35–₹7,345.20 | SL: ₹7,553.15
🟧 Consolidation Zone: ₹6,750–₹7,300
🟩 Demand Support: ₹7,176 / ₹7,043 / ₹6,969
🔻 Bottom Support Range: ₹6,001 (long-term demand base)
Resistance Levels:
• ₹7,382.5
• ₹7,456.5
• ₹7,589.0
Support Levels:
• ₹7,176.0
• ₹7,043.5
• ₹6,969.5
________________________________________________________________________________
🧠 Technical Signals
✔️ Rounded W pattern breakout
✔️ Bollinger Band expansion (BB Squeeze OFF)
✔️ RSI around 62 – showing strength
✔️ SuperTrend & VWAP supportive during breakout
✔️ Sectoral tailwind: Hospitals gaining traction in current market narrative
________________________________________________________________________________
🎯 STWP Educational Trade Plan (For Study Only)
• Entry (Breakout Retest): ₹7,324
• Stop Loss: ₹6,989
• Risk: ₹335/share
• Position Size: 50 shares
• Risk-Reward Ratio: 1:1 | 1:2+
📌 Setup Logic: Volume-backed W Breakout + Consolidation Range Break + Sector Strength
________________________________________________________________________________
⚠️ Cautionary Notes
• Breakdown below ₹7,043 = weakening structure
• If price gets rejected at ₹7,456, sideways action likely
• Always track volume + RSI for divergence signs
________________________________________________________________________________
📢 Disclaimer
This is a study-based chart analysis shared for educational purposes only. It is not a buy/sell recommendation. The author is not SEBI-registered. Please consult a SEBI-registered advisor before making any investment decisions.
________________________________________________________________________________
💬 Your Turn:
Do you think ₹7,545 will break or will price revisit ₹7,000 first?
👇 Drop your view or chart in the comments — let’s grow together!
________________________________________________________________________________
STWP | Learn. Trade. Grow.
________________________________________________________________________________
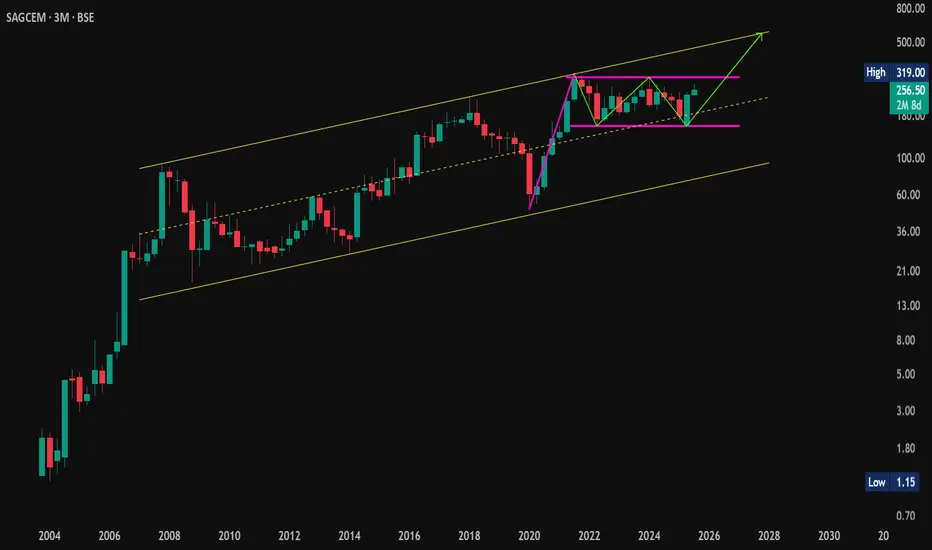
Flag + W Pattern Combo on Monthly! | #SagCem On Radar🔍 #OnRadar
#SagCem (Sagar Cements Ltd.)
🚩 Flag + W Pattern Combo on Monthly!
📈 Chart Timeframe: Monthly & Quarterly (Educational Observation Only)
📊 Technical Structure Overview:
A rare confluence of bullish patterns spotted:
🚩 #FlagPattern — classic continuation structure
🔻🔻 #WPattern (Double Bottom) — bullish reversal signal
🔼 Both developing inside a long-term #AscendingChannel
🎯 Potential Pattern Projections:
Flag Target: 560+
W Pattern Target: 450+
🛡 Support Zones:
255
234–209 (Demand cluster)
❌ Pattern Invalidation:
Below 155 on Monthly Closing Basis (MCB)
🧠 Educational Note:
When multiple bullish structures align on higher timeframes, they often lead to explosive moves—if validated by breakout and volume.
⚠️ Disclaimer:
This is not a buy/sell recommendation. Shared strictly for educational and technical study purposes. Always consult your financial advisor before acting on any market insights.
#PriceAction | #TechnicalAnalysis | #ChartPatterns | #FlagPattern | #Wpattern | #AscendingChannel | #InsideBar | #LongTerm
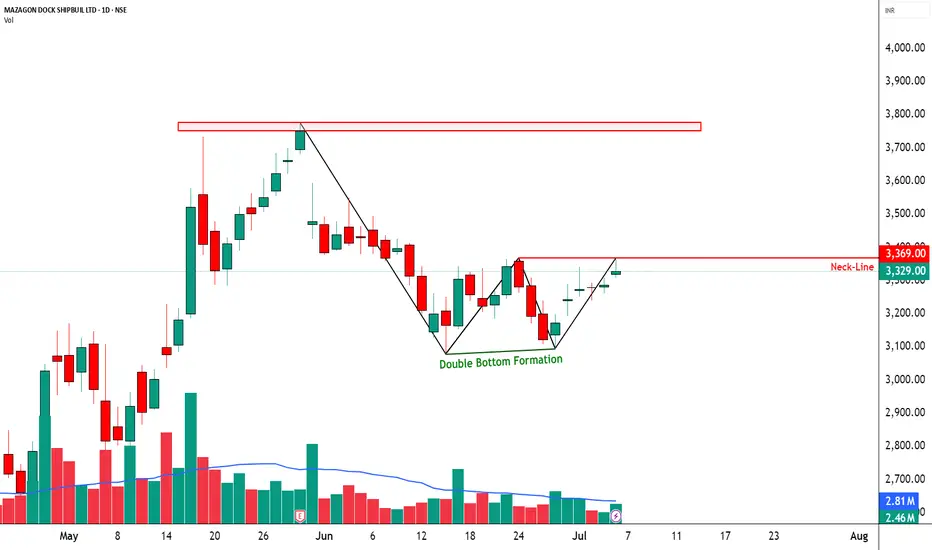
MAZDOCK – TECHNICAL ANALYSIS - W PATTERN________________________________________________________________________________
📈 MAZDOCK – TECHNICAL ANALYSIS
📆 Date: July 4, 2025 | ⏱ Timeframe: Daily Chart
🔍 Educational Breakdown – For Learning & Study Use Only
________________________________________________________________________________
🔹 Price Action Zones
• 🔴 Top Range: 3775
• Resistance: 3362 – 3396 – 3423
• 🟢 Bottom Range: 3077.7
• Support: 3241 – 3274 – 3301
________________________________________________________________________________
🔹 Chart Pattern: ✅ W-Bottom Formation
A clean W-shaped reversal pattern is forming. Price is respecting demand zones and gradually forming higher lows. Neckline lies around 3369 — breakout above this may fuel further upside.
________________________________________________________________________________
🔹 Reversal Candlestick Patterns:
⛔ No major reversal candle on 4th July 2025.
________________________________________________________________________________
🔹 Volume Footprint:
✅ Gradual volume pickup
🚨 Watch for breakout above 3362–3396 with volume >3.5M
🔼 A successful breakout may trigger a swift move toward 3425–3520.
________________________________________________________________________________
🔹 Trend Bias: ✅ Bullish
Short-term momentum favors the bulls with sectoral tailwinds from PSU + Defense themes.
________________________________________________________________________________
📌 What’s Catching Our Eye:
• W-Bottom Pattern nearing breakout
• Price reclaimed key demand zone and consolidating just below resistance
• PSU + Defense theme rally adds sector momentum
________________________________________________________________________________
👀 What We’re Watching For:
• Breakout Confirmation: Daily close above 3396 with 3.5M+ volume
• Pullback Re-entry: Ideal zone 3300–3310 for fresh entries
• Volume Spike: Key trigger for breakout validation
________________________________________________________________________________
⚠️ Risks to Watch:
• Low volume breakout = Bull trap risk
• Sector rotation or sudden weakness in PSU/Defense
• Breakdown below 3240 = pattern failure & shift in bias
________________________________________________________________________________
🔮 What to Expect Next:
• ⚡ Retest of 3362–3396 range likely
• 🔄 Minor consolidation / handle formation possible
• 🔄 Watch for volatility near resistance (intraday fakeouts)
________________________________________________________________________________
📊 Trade Plan (Based on Logic + Volume Confirmation)
🔼 Breakout Long Setup:
• Entry: Above 3369
• Stop Loss: 3300
• Risk–Reward: ~1:1 to 1:2
📌 Why:
• W-bottom breakout
• Sector strength + price structure alignment
• Volume >3.5M is the key trigger
________________________________________________________________________________
🔁 Pullback Long Setup:
• Entry Zone: 3305–3310
• Stop Loss: 3240 (Support 3)
• Risk–Reward: ~1:1 to 1:2
📌 Why:
• Tight SL near structure
• Good risk-reward for early entry
________________________________________________________________________________
🔽 Bearish Setup (Rejection from Resistance):
• Entry: Below 3300
• Stop Loss: Above 3365
• Risk–Reward: ~Flexible — as per individual trader's strategy and risk appetite
📌 Why:
• Rejection from neckline
• Low-volume breakout = trap
• Breakdown below support shifts structure to bearish
________________________________________________________________________________
❌ Invalidation Triggers:
• Daily Close below 3240
• Bearish Marubozu with volume = shift to supply pressure
________________________________________________________________________________
📌 Intraday Supply Zones Noted (15-Min Chart):
The 15-minute chart reveals the presence of multiple intraday supply zones, indicating short-term selling pressure.
🟥 Tested Supply Zone: 3337.30 – 3346.30 | SL: 3352.20
🟥 Strong Supply Zone: 3349.40 – 3358.60 | SL: 3364.50
These zones may act as resistance levels for intraday traders. Watch for price rejection or confirmation candles in these areas before planning any breakout trades.
________________________________________________________________________________
⚠️ Disclaimer:
This analysis is for educational purposes only.
STWP is not a SEBI-registered advisor.
No buy/sell recommendations are made.
Please consult your financial advisor before trading.
STWP is not responsible for trading decisions based on this post.
________________________________________________________________________________
💬 Found this helpful?
Have you caught this W-pattern early?
Share your thoughts in the comments ⬇️
🔁 Spread the insight with fellow traders
✅ Follow STWP for smart technical setups backed by volume and price action
🚀 Let’s trade with patience, logic, and clarity!
Be Self-Reliant | Trade with Patience | Learn with Logic
________________________________________________________________________________
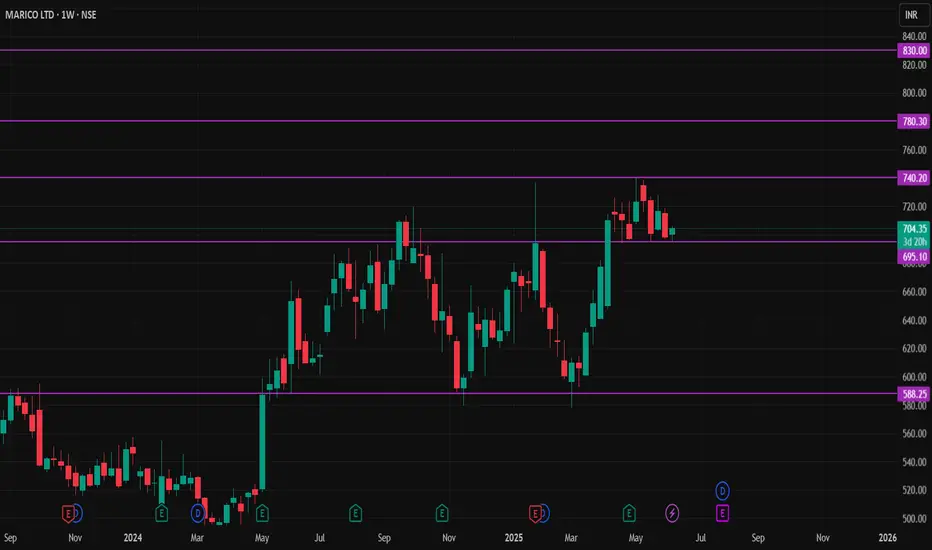
MARICO STOCKNSE:MARICO Stock has formed W shape pattern. Now it's take a best support level of 690 Rupees,
Buy sustain above 710 Rupees,
First Target 730 to 740 Rupees,
Second Target 760 to 780 Rupees,
Third Target 800 to 830 Rupees,
Stoploss below 690 Rupees (Weekly Candle Closed)
UNIONBANK – Positional Breakout SetupPattern: Double Bottom | W Pattern Inside Channel
Trend: HH-HL Structure | Trading Inside Ascending Channel
Volume: Noticeable Build-Up
DMAs: Trading Above Key DMAs
Stage: Aiming for Stage 2 Breakout
The stock is forming a double bottom (W pattern) inside a well-respected ascending channel, with a clean higher high–higher low structure and visible volume build-up. It's now trading above key DMAs, hinting at underlying strength. With price approaching a key breakout zone, it looks primed for a potential Stage 2 continuation.
🔔 Trade Plan
Entry: ₹143.38+ (on breakout and daily close above)
Stop Loss: ₹121.74 (closing basis )
Target 1: ₹151.72
Target 2: ₹172.83
Risk–Reward Insight 🎯
Risk from entry to SL is ₹21.64.
Reward to Target 1 is ₹8.34 (~1:0.38)
Reward to Target 2 is ₹29.45 (~1:1.36)
While T1 gives a conservative move, the bigger play lies in T2 — the upper edge of a 1-year trading range. This is where smart money tends to scale in.
💡You don’t have to go full throttle on day one.
✅ Consider buying a test quantity above ₹143.38 to assess breakout strength.
If the move confirms with strong follow-through and volume, you can look to add on dips or above T1 with a tighter trailing SL.
This approach helps you ride trends without overexposing yourself early. The key is to stay mechanical and let the setup prove itself.
⚠️ Risk Management is Non-Negotiable
Never ignore your stop loss.
Don't chase.
Stick to your plan and size positions according to your risk appetite.
This setup looks technically clean — but remember: even the best setups fail without confirmation. Let price and volume lead the way.
📌 Disclaimer:
This is not investment advice. I am not a SEBI-registered advisor. All content is for educational purposes only. Please do your own analysis and always trade responsibly.

SARDAEN - Breakout WatchlistWhy This Stock?
✅ Base Breakout – Breaking above ₹526.2 with strong volume confirmation (4-5x past trading sessions).
✅ Trading Above Key DMAs – Strong price structure with good RSI.
✅ No Left-Side Resistance – Clean chart structure with potential for an uptrend.
✅ Formation of W Pattern + VCP – Classic bullish continuation setup.
✅ Resisted Market Fall – Showcasing relative strength despite overall weakness.
Safe traders wait for a weekly close above the break-out level ₹526.2.
Key Levels
📌 Entry: ₹538.50
📌 SL (Closing Basis): ₹423.10
📌 Breakout Level: ₹526.2
Fundamentals (Key Metrics)
Market Cap: ₹18,979 Cr.
Stock P/E: 27.9
ROCE: 15.3%
ROE: 14.1%
Sales Growth (YoY): Improving
OPM % YoY Improving
EPS YoY: Improving.
What Could Go Wrong?
⚠️ Overall Market Trend is Bearish – Any weakness in broader indices can drag the stock down.
⚠️ Sectoral Index is Weak – Lack of sectoral strength may limit upside potential.
⚠️ High SL Probability – Strong pullbacks can invalidate the breakout; hence, buy test quantities only.
⚠️ Deep SL
Why This is Worth Watching?
📈 Stocks that Fell Less in Correction – Often become early movers when the market stabilizes.
📈 Volume Picking Up – A good sign that institutional interest might be present.
🚨 Disclaimer: This is not a trade recommendation but a watchlist alert. Do your own research before making any trading decisions. 🚨

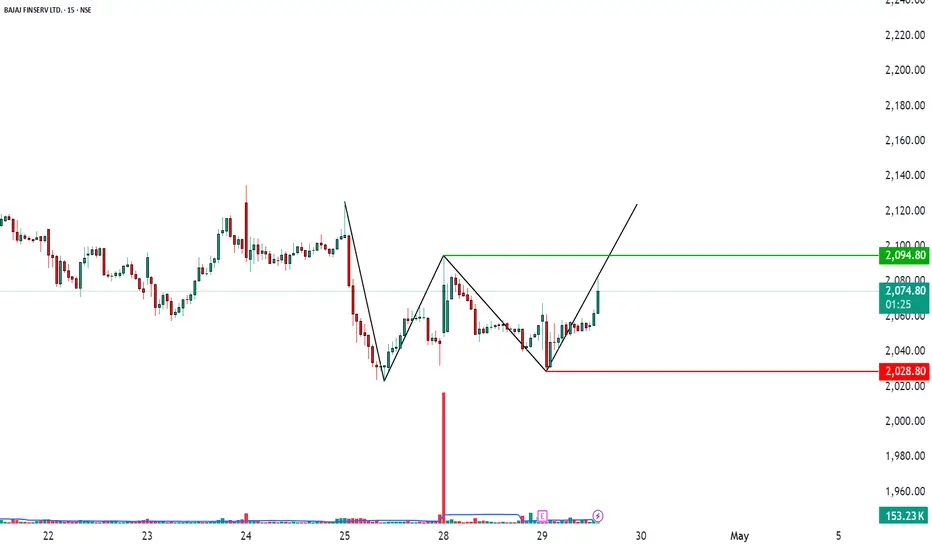
W Pattern Breakout Setup on 15-Min Chart📊 Script: BAJAJ FINSERV LTD. (NSE)
⏱️ Timeframe: 15-Minutes
📌 Chart Pattern: W-Pattern Formation
A potential bullish W-pattern is forming on the 15-minute chart of Bajaj Finserv. The price is consolidating near the neckline, indicating a possible breakout move in the upcoming sessions.
Key Levels:
✅ Breakout Resistance: 2,094.80
⚠️ Support Zone: 2,028.80
💼 Current Price: 2,063.70
If the price sustains above 2,094.80 with volume confirmation, it could trigger a short-term upward rally. The structure shows healthy consolidation and buying interest around support, which adds strength to this setup.
Trade Plan (For Educational Purposes):
📈 Entry: On breakout above 2,095 with strong volume
🎯 Target: ~100–150 points above breakout
🛑 Stop Loss: Below 2,028 (on a candle close basis)
Caution: Results are due so watch for possible reversal below 2028
Dixon Technologies Bullish Bias 10% upsideThe Stock has been consolidating for a while
As visible from the RSI the stock has given a nice breakout from the range
The stock price was also falling and took support near 200day EMA zone
The price has reversed from the selling zone
3 days constant increase in the price and reversal with a W Breakout pattern
The overall sentiment looks really bullish for the counter
Also, the tariff pause shall be helping the business for a short term
Looks really bullish to me.
Caution: Trade as per your risk appetite.

Muthoot Microfin LTD – Major Breakout in Play!🟦 Blue Line: 200 DEMA
Still overhead, but the recent price action indicates a potential shift in trend. Price reclaiming above this zone will be another bullish confirmation.
📌 Breakout Highlights:
Counter Trendline Breakout: Price shattered the CT-based trendline with high volume.
W-Bottom Formation: A textbook double bottom structure is visible with neckline breakout.
Green Path: Illustrates the bullish trajectory already played out post breakout.
Red Zone: Key resistance turned support — now a potential demand zone on retest.
Yellow Path: A healthy retest scenario could play out, offering better R:R entries. A pullback to the neckline before continuation would be ideal.
🔔 Keep it on your radar — structure, volume, and trend all align for a bullish bias.

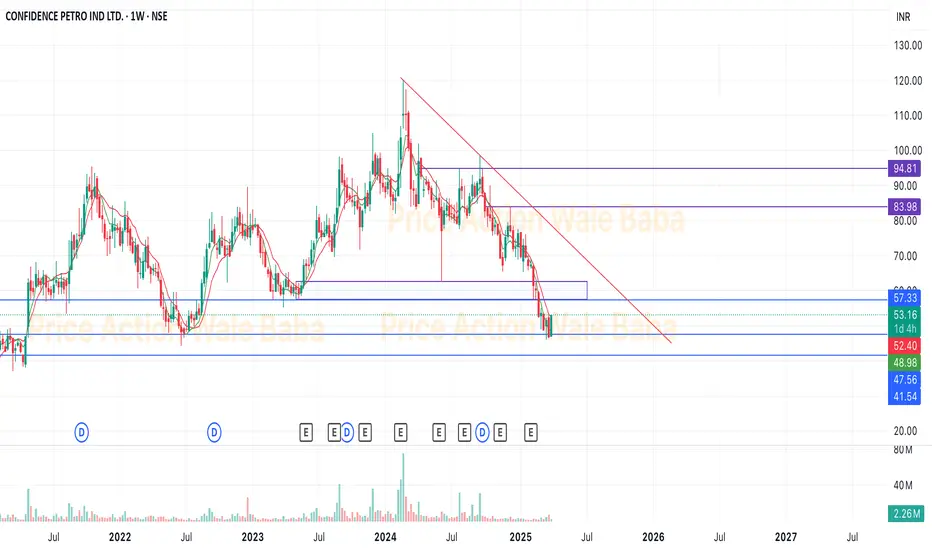
Confipet - 1W TimeframeConfipet looks like a bottom out and good to buy here.
Making a W pattern on 1-day timeframe and as we know crude oil price also going down so it will help in the growth of company.
Buy and hold for the next 1-2 year will give you better profit.
Zensar Technologies W pattern Breakout. 🚨 Zensar Technologies Trade Alert 🚨
🔍 Setup at a Glance:
Pattern: W-pattern forming within a trading channel 📈
Breakout Level: ₹840
Support Zones:
Channel support
200 DMA (holding since March 2024)
Trend: Overall uptrend, trading above key DMAs ✅
Volume: 🚀 2x-3x higher than previous sessions today!
RSI: Strong and supportive – signaling momentum.
💡 Trading Plan:
Entry: Above ₹840 (start small; e.g., buy just 10% of your usual quantity).
If the stock closes above ₹840, you can consider adding more.
Target (T1): ₹1025 (channel top) – +21% upside potential 🎯
Stop Loss (SL): ₹709 – -16% downside risk 🔻
Risk-Reward Ratio (RR): ⚖️ 1:1.3
⚠️ Key Risks & Considerations:
Market Structure:
Currently in a Lower High - Higher Low (LH-HL) sequence.
This trade goes against the broader trend – a higher probability of failure!
Why Consider It?
Exceptional volume and strong RSI, combined with a well-defined W-pattern and breakout level, make this setup compelling.
🚦 Risk Management Tip:
Example Position Sizing: If you usually buy 100 shares, start with only 10 shares initially.
⚠️ Disclaimer: This analysis is for educational purposes only.
Please assess your own risk tolerance and consult with a financial advisor before trading. 📘
💬 What’s your view on Zensar? Let’s discuss in the comments below! 👇
