KRSNAA DIAGNOSTICS LTD looking bullish agianBottom of krsnaa dig ltd is formed @625 levels so that we can go long now CMP of 670 or later near 625 with SL of 620.
target is given in chart @750
long term view
Profit Strategy trading and training institute jaysingpur.
contact no. 8956337959
this view is for educational purpose only.
Wpattern

HAVELLS WEEKLY CHART ANALYSISHavells had a W-pattern break near March 2020 lows. The W and M patterns are very commonly seen on the candlestick charts. W patterns are bullish in character and are generally seen at the bottom of a downtrend, whereas M patterns are bearish and are seen at the top of a rally.
The stock made new highs in Nov 2020 followed by strong follow up bullish candles which can be observed till mid-Jan 2021. Thereafter, the stock went into consolidation for about 6 months but the downside was limited. The consolidation is a phase in which a stock gyrates in a range for some time. If the stock forms deeper lower-lows and lower-highs, it is called a correction. But in case of Havells, the lows were not deeper enough to call it a correction.
The consolidation ended up as a falling wedge pattern (which is considered bullish in character) and then broke out of this pattern in July 2021. The stock had a very strong breakout above the previous high at the end of August but it ended up as an exhaustion. Exhaustions can be observed as very wide candles at or near the top of a rally. It signifies that the buyers are exhausted and the stock may face a sluggish rally or consolidation or correction in the coming weeks or days.
The October sharp fall is an evidence of the exhaustion in the August. But this sell off stopped right near the prior important support/resistance zone (1200) and there was no follow up on the downside thereafter. The stock tested the 1200 zone recently in December and has been trying to hold.
It seems like a range bound action between 1200 to 1500 can be seen in the coming days/weeks (support near 1200 and resistance near 1500). A strong break on either side (below 1200 for downside and above 1500 for upside) will lead to a decisive move.
I hope this analysis will help some traders/investors in decision making.
Regards
#Consult your financial advisor before final decision making.

BANK NIFTY MAKING W PATTERNBank nifty Making Bulish pattern If W pattern Was Complete In Dec Go For Long View making New High
Thank you
Mr . Trader

Ashok Leyland Trade Setup for TomorrowAs you can see in the chart, Ashok Leyland share has made w pattern and given the strong BREAKOUT.
.
So for tomorrow you can buy if it goes above 126 for the target 129-130.
.
What's your view on this comment below in the box.

Axis Bank Trade Setup For TomorrowAs you can see in the chart, Axis Bank has made W pattern & given breakout on today.
.
So for tomorrow if stock goes above 688, you can buy this trade for the target of 700.
.
What's your view on this comment below in the box.

Metropolis LongMetropolis Long
W Pattern prediction
Buy at CMP - 2907
SL- 2640
Target - 3237
Join us, Learn more, Earn more
Disclaimer- We are not SEBI registered advisor.
Charts and views are only for educational purpose.

ICICPRULI TRADE SET-UP FOR TOMORROWICICIPRULI share has following the trendline and as you can see in the chart,
.
ICICIPRULI has making W Pattern, so on tomorrow if stock goes above 640.
.
You can buy this trade for the target of 680.
.
What's your view on this comment below in the box.

IFB Industries bullish breakout observedIFB Industries has given a recent trendline breakout as well as breakout from a W pattern formation in Weekly and Daily charts.
This makes it bullish for in short term.
Entry-EXIT can be done as below:
BUY around 1260-1250 during retracement or RISKY traders can start accumulating above 1316
SL: 1220 below
Targets: 1399 as first target, a breakout with good volume above can take it to 1500+ levels
Risk-Reward ratio: 1:3+
Don't forget to keep revising SL once in profit.
** This is a good time for IFB considering festive season sales as well.

Navinflour longNavinflour long
W Pattern
Took support at 100 Day EMA
Buy at CMP-4050
SL- 3650
Target- 4380, 4550
Disclaimer- We are not SEBI registered advisor.
Charts and views are only for educational purpose.

#niftyauto breakout confirmation Nifty auto index is showing. A firm confirmation of breakout from the previous resistance and also from a double bottom W pattern.
The last weekly candle is wide range bullish open = low pattern. The momentum and trend is bullish on all timeframes.
From the fundamental side covid recovery and festive sales could help stocks in the sector to sustain the bullishness in the short term.

Shilpamed: Targeting 640 to 717 in a swing with tight SL of 620Hello Traders,
My recent trade analysis have gone pretty well. There is lot of noise around which wants us to believe that market is going to crash but at least till now I cannot see any signals like that.
So here I have found a stock, that has formed a W bottom pattern which is a bullish pattern, has good long volumes, and delivery data is also convincing.
It can be traded as follows:-
CMP, Entry price: 640,
Target: 717
SL: 620
Happy Trading!
Disclaimer: My trading ideas are primarily for education purposes. Please do your research carefully before investing.
PS: I am not invested in this stock and neither I will be trading this idea.

Caplin Point - 3mth C&H [R:R 1:5]BUY GUIDANCE:
Never buy before 3PM (for positional trading). I have been burnt many times over. Try to buy between 3:15 - 3:30PM, later the better.
SL: Depending on your risk appetite: Below Weekly BO Candle / Below Daily BO Candle / 50% of Weekly BO candle / Below 20DMA
TGT: After a 10-15%+ vertical move, breakdown of 20DMA (on a daily close basis)
SELL GUIDANCE:
Selling in Profit:
Sell earlier in the session when the prices are higher, around 11AM.
Selling at SL:
Give your stock a chance to recover by end of session. If it doesn't recover, sell anywhere between 3:00 - 3:30PM.
Note:
The breakout levels are derived from the weekly line chart which is respected much more by smart money.
DISCLAIMER:
I reserve the right to be wrong.
I am not a SEBI registered analyst. Please consult your financial advisor before investing.

BUY MGLBUY MGL ABOVE 1200
TARGETS 1280, 1320++
SL BELOW 1100 ON CLOSING BASIS
Disclaimer: All Charts are for educational purpose. Please consult your financial advisor before investing.

IFB Industries Bullish Bias W PatternW Pattern on Weekly Time frame
Great Set up
Looks Bullish
High Volumes
SL 1020s level
Target 1410s Level

TECHM: Double Bottom FormationTechM formed a double bottom on the hourly time frame. Right now price is trading near the supply zone. we may see some good movement in TechM in Intraday/Swing trading.
Levels are marked in the chart itself.

Levels for - 09 Sep 2021EXPLANATION : This is a 15 Min time frame chart of NIFTY , It has formed a Double Bottom Pattern , W pattern . If gave a strong breakout and broke its supply level with volumes and retest the same , I am bullish on NIFTY . If gave a Rejection from supply level its kind of a Right hand shoulder of Inverted head and shoulder pattern .

Swing trade: double bottom breakout and pullbackbuy above 3250 for swing
risky traders can buy at cmp also but stock will pick momentum above previous high(3250)
keep stoploss below 3050 Day closing basis
Target 3400, 3600

L&Tinfotech : double bottom breakout in progressL&T infotech : double bottom breakout in progress. Momentum and trend bullish on all timeframes .
latest daily candle is open = low bullish pattern and likely to trend up.
stop loss could be close below breakout neckline. trailing could be done on daily trendline breach and close also could be indication
for short swing trades.

FMCG Sector verge of short term break out?
#niftyfmcg FMCG sector potential "volatility expansion" on Bollinger band and "W breakout" pattern if breaks out of neckline
with momentum forming a" range shift" from sideways to bullish definitely a sector to watch out for.

M_M - can go for long.M_M is showing a chance for a long trade .
LTP - 791.35
Target - 930
SL - 725
This is purely for educational purpose and I'm not saying anybody to go for this trade. This is my chart analysis.
NSE:M_M

#Vedanta breakout in progressBullish divergence met target &daily rounding pattern breakout in progress and weekly approaching a very wide weekly W pattern breakout neckline. Cautious of a weekly bearish divergence emerging &use tight stop loss at rounding pattern neckline

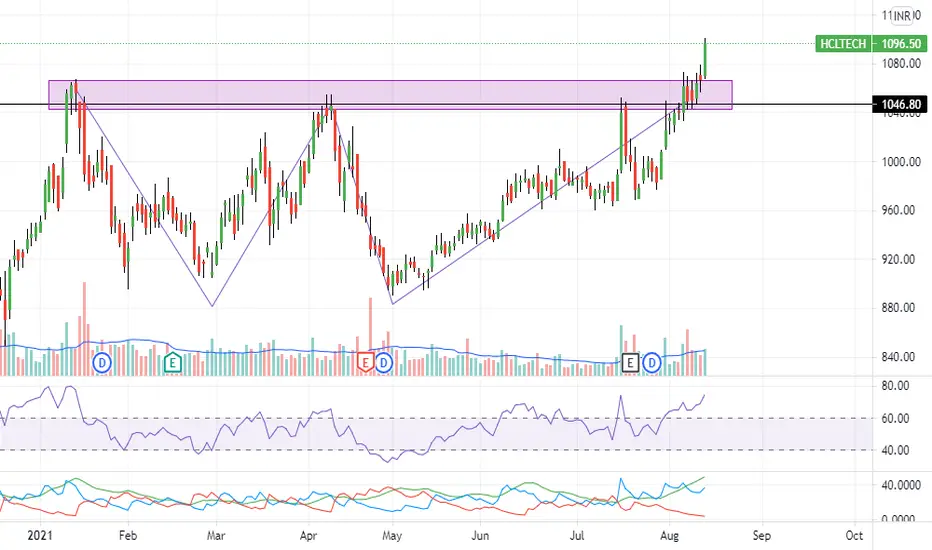
HCL Technologies : Breakout from resistance with momentum #HCLTECHNOLIGIES looks like a breakout of previous resistance after a W pattern. Momentum and trend on all timeframes looks good.Dollar beneficiary move