Nifty 50 spot 25709.85 by the Daily Chart view - Weekly updateNifty 50 spot 25709.85 by the Daily Chart view - Weekly update
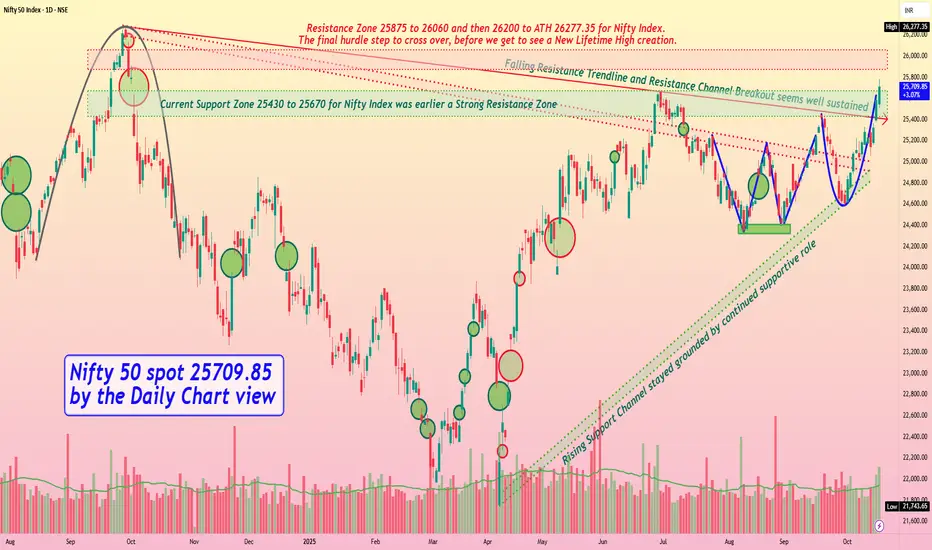
- [ b]Nifty Index now just 567.50 points away from ATH 26277.35 for creating a New Lifetime High Milestone
- Resistance Zone 25875 to 26060 and then 26200 to ATH 26277.35 for Nifty Index
- The final hurdle step to cross over before we get to see a New Lifetime High creation
- Both Falling Resistance Trendline and Resistance Channel Breakout seem well sustained
- Current Support Zone 25430 to 25670 for Nifty Index was earlier a Strong Resistance Zone
- Rising Support Channel has stayed firmly grounded by providing the continued supportive role
- Bullish Technical patterns Double Bottom "W" followed by Rounding Bottom formed by Support Zone neckline
Wpatternbullish
Bank Nifty spot 57713.35 by the Daily Chart view- Weekly updateBank Nifty spot 57713.35 by the Daily Chart view- Weekly update
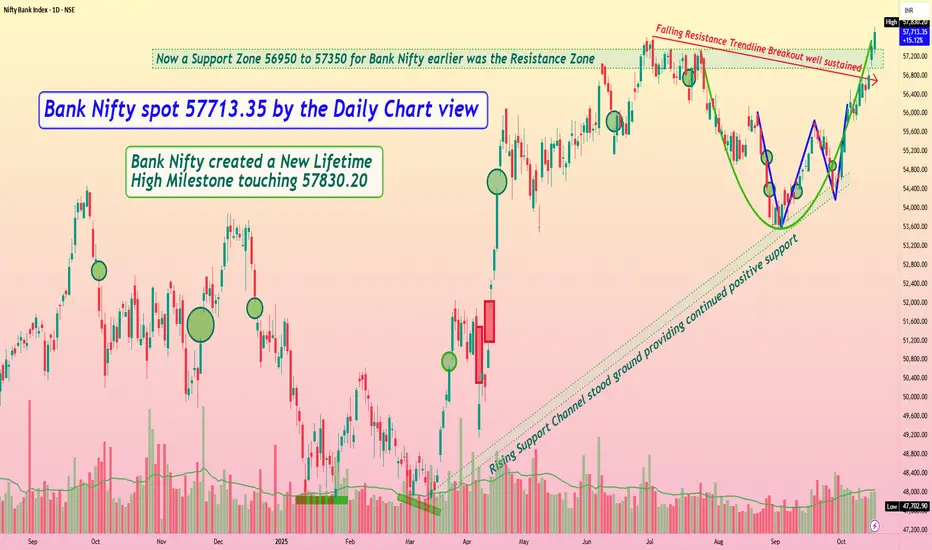
- Bank Nifty created a New Lifetime High Milestone touching 57830.20
- Resistance Zone 56950 to 57350 then ATH 57628.40 for Bank Nifty
- Falling Resistance Trendline Breakout seems to be well sustained for now
- Rising Support Channel stood ground and providing steady positive support
- Current Support Zone 56950 to 57350 for Bank Nifty was earlier the Resistance Zone
- Bullish Rising W pattern done and has been well sustained by current trending momentum
- Bullish Rounding Bottom formed by Support Zone neckline inclusive of W pattern actively effective
BDL – Weekly W-Pattern + Sector Strength + Volume Surge 📈 BDL – Weekly W-Pattern + Sector Strength + Volume Surge = High-Potential Positional Setup
BDL is showing textbook technical confluence at the right time:
Sector: Defence index at all-time highs
Stock: BDL forming a clear double bottom (W-pattern) over several months
Weekly breakout underway with strong green candle and volume confirmation
Structure: Rounded base, higher lows, long support holding strong
Price just broke key levels with momentum — setup for multi-leg positional rally
🧠 Technical Highlights
✅ W-pattern (double bottom) over weekly chart confirms accumulation & reversal
✅ Price breakout from neckline zone around ₹1,525+
✅ Clean structure with support zone holding for 8+ months
✅ Volumes rising with the breakout — early signs of trend continuation
✅ Defence sector tailwind active
🧮 Setup Overview
Entry Zone ₹1,530–₹1,540
Stop Loss (SL) ₹1,293.95
ATH Resistance ₹1,799.45
Target (Positional) ₹2,363.55
SL % −15.38%
Target % +54.34%
Risk : Reward 1 : 3.5
📊 Strategy Recommendation
Add 30–40% position now
Add more on clean ATH breakout or base retest with volume
Avoid full position in one shot — shakeouts possible on weekly charts too
Let volume lead the move — don’t pre-empt full size
⚠️ Cautionary Note:
While the setup is structurally strong, remember:
Markets are still volatile
Sudden sector pullbacks or macro headlines may affect entries
Stick to position sizing and respect your stop loss
📌 Summary
BDL is setting up for a high-reward positional breakout fueled by a confirmed W-pattern, sector momentum, and volume surge. Structure is tight, risk is defined, and the upside potential is significant.
📉 Disclaimer:
This is not a buy/sell recommendation. For educational purposes only. Do your own research and manage risk as per your capital and style.

ICICI Bank-Aiming for Double Bottom Breakout?ICICI Bank – Technical Analysis & Trade Plan
📈 Trend Analysis:
Stock is in a strong uptrend with a higher high, higher low (HH-HL) structure intact.
Consolidating since September 2024, forming a base.
Double bottom formation visible, with a potential VCP (Volatility Contraction Pattern) at play.
Trading above key DMAs, confirming strength.
Sectoral strength: Finance & banking showing momentum and could lead the next market move.
📊 Market Context:
Broader market is showing slight improvement but still in a lower low, lower high (LL-LH) structure.
Index closed above 50 DMA, gaining some momentum, but another round of correction cannot be ruled out.
The main reason for selecting this stock is strong sector movement.
🔍 Trade Plan:
✅ Entry: Above ₹1,328
🚨 Immediate Resistance: ₹1,363
📌 Add more: If ₹1,363 is broken with strong volume
🎯 Positional Target: ₹1,555
❌ Stop Loss (SL - Closing Basis): ₹1,180.45
📉 Risk & Reward Calculation:
Risk (SL to Entry): ₹1,328 - ₹1,180.45 = ₹147.55 (~ 11.11% downside risk)
Reward (Entry to Target): ₹1,555 - ₹1,328 = ₹227 (~ 17.1% upside reward)
Risk-to-Reward Ratio (R:R): 1:1.54 (Moderate reward vs. risk)
⚠️ Risk Considerations:
Overall market still in LL-LH structure → Could just be a pullback within a broader downtrend.
Position Sizing Key:
Consider entering only 30% of the usual position size.
Gradual accumulation near ATH (All-Time High) levels is a wise approach.
📢 Disclaimer: This is not financial advice. Trading involves risk, and past performance does not guarantee future results. Always do your own research and use proper risk management .

SCI(Shipping Corporation of India) Analysis!NSE:SCI – Double Bottom Pattern Forming a Bullish Reversal?
📊 Chart Pattern:
A Double Bottom pattern has been identified on the daily chart of Shipping Corporation of India (SCI), indicating a potential trend reversal from the recent downtrend.
🔍 Key Observations:
Falling Bottom & Rising Bottom:
The first bottom formed at a lower level, followed by a second bottom at a slightly higher level, aligning with bullish RSI divergence (indicating possible strength in the price action).
Neckline Breakout Level:
The neckline of the pattern is around ₹169-172, which serves as the critical resistance level. A breakout above this level could confirm a bullish move.
Projected Target:
The pattern height projection suggests a potential target of ₹193.65 upon a successful breakout.
EMA Resistance Levels:
The price is currently below the 50 EMA (₹198.76), 100 EMA (₹212.83), and 200 EMA (₹218.62). A breakout above these levels would further strengthen the bullish outlook.
RSI Recovery:
The Relative Strength Index (RSI) is recovering from oversold levels, currently at 42.38, suggesting that bullish momentum is slowly building.
📈 Trading Plan:
A confirmed breakout above ₹169-172 with strong volume could indicate a further bullish rally toward the ₹193-195 zone.
Stop-loss: Below the second bottom level to manage risk.
Watch EMA Levels: The stock needs to sustain above key moving averages to continue upward momentum.
Disclaimer: Consider my analysis for educational purposes only.
Before entering any trade:
1️⃣ Educate Yourself – Understand market dynamics and technical patterns.
2️⃣ Do Your Own Research & Analysis – Never rely solely on external opinions.
3️⃣ Define Your Risk-Reward Ratio – Ensure your trade aligns with your risk appetite.
4️⃣ Never Trade with Full Capital – Always manage risk and preserve capital.
Trade wisely! ✅📊

Zensar Technologies W pattern Breakout. 🚨 Zensar Technologies Trade Alert 🚨
🔍 Setup at a Glance:
Pattern: W-pattern forming within a trading channel 📈
Breakout Level: ₹840
Support Zones:
Channel support
200 DMA (holding since March 2024)
Trend: Overall uptrend, trading above key DMAs ✅
Volume: 🚀 2x-3x higher than previous sessions today!
RSI: Strong and supportive – signaling momentum.
💡 Trading Plan:
Entry: Above ₹840 (start small; e.g., buy just 10% of your usual quantity).
If the stock closes above ₹840, you can consider adding more.
Target (T1): ₹1025 (channel top) – +21% upside potential 🎯
Stop Loss (SL): ₹709 – -16% downside risk 🔻
Risk-Reward Ratio (RR): ⚖️ 1:1.3
⚠️ Key Risks & Considerations:
Market Structure:
Currently in a Lower High - Higher Low (LH-HL) sequence.
This trade goes against the broader trend – a higher probability of failure!
Why Consider It?
Exceptional volume and strong RSI, combined with a well-defined W-pattern and breakout level, make this setup compelling.
🚦 Risk Management Tip:
Example Position Sizing: If you usually buy 100 shares, start with only 10 shares initially.
⚠️ Disclaimer: This analysis is for educational purposes only.
Please assess your own risk tolerance and consult with a financial advisor before trading. 📘
💬 What’s your view on Zensar? Let’s discuss in the comments below! 👇

W-Pattern Breakout Alert: KRN Heat Exchanger📊 Setup Overview:
Entry: Above ₹828.75
Stop Loss: ₹670
Target: ₹1030 (Positional)
RR: 1:1.2 (📌 Close to 20% risk, so trade light!)
📈 Technical Highlights:
Bouncing off 30DMA & 50DMA, forming a wide-range candle with strong volumes.
RSI looks bullish.
ATH Resistance: ₹833.5 🚧 — if broken with volume, add more and trail your SL!
💡 Fundamentals:
ROCE: 42.1% | ROE: 41.9% ✅
Market Cap: ₹5153 Cr
PE: 129 😬 vs Sector PE ~32. (Expensive, but growth potential seems priced in.)
Trend: Trading against the trend, so position sizing and risk management are key! 🚨
🛑 Disclaimer:
This is not investment advice. Risk management is crucial, especially when trading counter-trend setups. 🚩
💡 Quick Take:
With a W-pattern breakout, bullish RSI, and strong volume, this setup has potential. But the high PE ratio makes it an expensive bet. Sector comparison suggests caution, so treat this as a high-risk, high-reward trade! 🚀

BANK OF INDIA - ' W ' PATTERN BREAKOUT IN MONTHLY TIMEFRAME Can Enter at CMP or 101
Target - 180, 270, 420
Disclaimer - All information on this page is for educational purposes only,
we are not SEBI Registered, Please consult a SEBI registered financial advisor for your financial matters before investing And taking any decision. We are not responsible for any profit/loss you made.
Request your support and engagement by liking and commenting & follow to provide encouragement
HAPPY TRADING 👍

JublfoodDouble bottom formed at 420.85 & later move above 586 confirmed the Bullish "W" pattern
expect 912 to be tested in weeks to come with stop loss of 550

EXICOM#EXICOM
> W pattern from support
> volume increasing
>trendline breakout
>daily timeframe
> breakout level 350
> weak below 290

PANACEA BIOTECH : Chart Pattern Breakout#PANACEABIO #chartpattern #breakout #trendingsetup #swingtrade
PANACEA BIOTECH : Breakout Candidate
>> W Pattern Visible
>> Trending Setup
>> Volume Dried up
>> Good Strength in Stock
Swing Traders can lock profit at 10% and keep trailing
Please give a Boost or comment if u r Liking the analysis & Learning from it. Keep showing ur Love by following
Disclaimer : This is not a Trade Recommendations & Charts/ stocks Mentioned are for Learning/Educational Purpose. Do your Own Analysis before Taking positions.

Devyani International (W Bullish Pattern)Date : 10th April 2024
Time :12.00 PM
Devayani International is showing reversal from its usual support with other bullish indications.
As we can see ,
first of all W pattern is visible from strong support. also there is a bullish Divergence too.
Wave Count on Devyani is also looks like its time for ABC wave till depth of correction price level, which is 198 Rs.
Order Blocks on multiple time frame is also visible after last bullish movement.
With A Stop Loss of 150 Rs. [ i] We can Long Devyani Int.
Entry Zone will be 162 to 155 Rs with Target of 198 Rs
and RR is Minimum 1:3

PERFECT 'W' PATTERN STOCKThe stock has given a breakout and also the retest has been done.
The stock is ready to move towards the targets of;
1. 190
2. 200
NOTE - Analyse yourself before investing.
HAPPY TRADING!

IZMO : Breakout CandidateSwing Setup
IZMO : Risky Trade but worth it
>> Huge TWS Visible on the Left Side
>> Price currently near Bottom of TWS, Spike Expected
>> W pattern also visible which can breakout
>> Inside Bar forming at the Bottom of W pattern
>> Highlighted supply zone : Almost 12% till there
>> If Breaks Supply zone, Another 12% on cards
>> Trendline Breakout also coinciding with W pattern Breakout
>> SL u can consider 380 levels
Risky Trade but so much Learnings, Chart filled with lot of concepts....which is actually lot of confirmations
Totally Worth Trading this setup with low Risk
Swing Traders can lock 10% profit & keep trailing
Please give a Boost or comment if u r Liking the analysis & Learning from it. Keep showing ur Love by following
Disclaimer : This is not a Trade Recommendations & Charts/ stocks Mentioned are for Learning/Educational Purpose. Do your Own Analysis before Taking positions.

Take Medplus Health for almost double targetTake entry at cmp 669
Target 1227
Term 1.5 year to 2 year
Next average price at 572Rs...at this level invest same amount and make weekly closing basis stop loss of 547Rs......
Downside will be limited and upper side will be open sky so this will be good deal for investors...
we can see W pattern on monthly chart. Lets see W will be a part of our Wealth creation or not.

Infosys Ltd Analysis!NSE:INFY Analysis on a Daily Timeframe!
Double Bottom Pattern formation in Infosys Ltd!
Double Bottom Pattern/ W Pattern Formation with RSI Divergence!
Analysis:
As we can see in the chart NSE:INFY started falling down from Feb 2024. It was in clear downtrend. After that it has made a double bottom pattern but it's second bottom is lower than its first bottom, so I have added RSI indicator to get a confirmation about Divergence. We can see a clear divergence while price falling down RSI moving upwards so we can expect the price will move upwards in the upcoming trading sessions. I have marked all the important levels on the chart please have a look.
Trade Psychology and Setup:
Entry = Current price level is good to Enter
Target = 1607.65
Stop Loss = 1460.50
Disclaimer = Consider my analysis for Educational Purpose only.
Before entering into any trade -
1) Educate Yourself
2) Do your research and analysis
3) Define your Risk to Reward ratio
4) Don't trade with full capital

LICHSGFIN- Breakout of Resistance - Done ✓
- Volume Spike break Resistance - Done ✓
-break Consolidation of cup and handle which good move of that depth.
SL always Paid ...
for MORE check in my TradingView ID
If You LIKE👌👌 MY Idea ......Boost.🔥🔥🔥.. its.
"Disclosure : I am not Sebi-registered." This channel is for only educational purpose. Any profit/loss, I am not responsible.
Before taking any trade on our charts / calls, please consult your financial advisors. Thanks

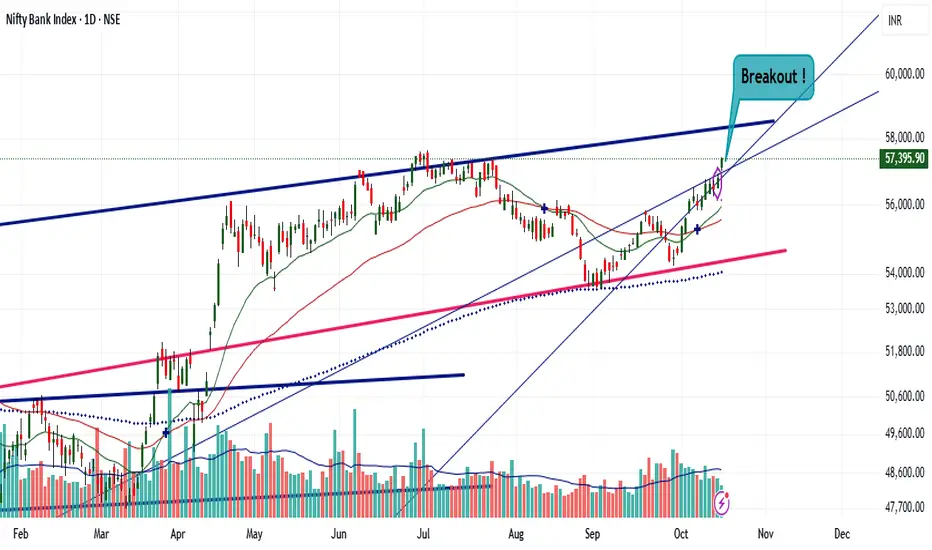
Cracking the Code: Nifty & Bank Nifty Technical Analysis!!Nifty is forming Cup and Handle pattern, it yet to give a breakout !
Bank nifty is creating W pattern with double bottom. Breakout is still pending.
Multiple technical indicators are showing strength for upward movement.

W PATTERN WARKING PERFECTLYW PARTERN SHOWES GRAB IT
W PATTERN WARKING PERFECTLY
ETHBTC
just wait and watchhh

Karur Vysya Bank : Inverse H&S Pattern Breakout#KARURVYSYA #patterntrading #breakout #momentumtrading #swingtrading
Karur Vysya Bank : Swing Trade
>> Inverse H&S pattern Breakout
>> W-pattern visible after Pattern Breakout
>> Good Strength & Volume in stock
Swing Traders can lock 10% profit & keep trailing
Please Like or comment if u r Liking the analysis & Learning from it. Keep showing ur Love
Disclaimer : This is not a Trade Recommendations & Charts/ stocks Mentioned are for Learning/Educational Purpose. Do your Own Analysis before Taking positions.

JSW ENERGY WEEKLY CHART BREAKOUT IDEAJSW Energy Weekly Chart Breakout Happening on the Short Term Basis...
This Stock created the Resistance Zone around 355.00 to 365.00 level as 1st time it was touched the level April' 2022...
It was touched the Resistance Level on 2nd time around September' 2022...
And just Lest week it was touched the same Resistance Level on 3rd time....
Its also creating "W" Pattern or Double Bottom on the Weekly Chart for Bullish run.
Weekly Volume showing Good sign since March-April 2021...
We are expecting a clean Breakout from @363.00 if its will sustain above @363.00
:: Data Point ::
Breakout Level: @363.00
1st Target: @405.00
2nd Target: @460.00
Stoploss Point: @339.00

HIMATSEIDE Analysis(Double Bottom)!HIMATSEIDE Analysis on Weekly Timeframe
Bullish view on HIMATSEIDE
Double Bottom Pattern Formation in HIMATSEIDE
Neckline Breakout
HIMATSEIDE has made double bottom patten on Weekly Timeframe. The price has given breakout to the neckline 85.45 and now it is trading above it. We can see the breakout has happend with the good volume. We can expect further upmove upto 107.80.
Trade Psychology and Setup =
Entry = Between 85 - 90 but it will good if we can enter with lower price
Target = 107.80
Stop Loss = Below 75.80
Disclaimer = All my analysis are for Educational Purpose only. Before entering into any trade - 1) Educate Yourself 2) Do your own research and analysis 3) Define your Risk to Reward ratio 4)Don't trade with full capital
