BTC 1H🧠 Market Context
Bitcoin has just completed a liquidity sweep after an extended move, tapping into a high-timeframe supply/demand reaction zone. Price action is currently compressing, signaling that we’re approaching a decision point where momentum traders and HTF participants collide.
The recent impulse leg shows aggressive positioning, but follow-through volume is starting to fade — typically a precursor to either consolidation or a sharp expansion move.
🔑 Key Levels To Watch
Major Resistance / Supply: Previous breakdown region + liquidity cluster
Mid-Range Pivot: Intraday structure flip area
Primary Support: Demand zone aligned with prior consolidation base
Invalidation Level: Clean break + acceptance beyond HTF structure
These zones are not just horizontal levels — they represent orderflow interest areas where reactions are statistically more likely.
📈 Bullish Scenario
If price holds above the mid-range structure and builds higher lows:
Expect continuation toward equal highs / resting liquidity
Break-and-retest of resistance could trigger expansion
Momentum confirmation: strong candle closes + increasing volume
Bias shifts bullish on structure confirmation, not anticipation.
📉 Bearish Scenario
Failure to reclaim reclaimed structure could signal:
Distribution inside resistance
Sweep-and-reverse pattern
Rotation back into lower demand zones
A clean breakdown below support with acceptance likely opens a fast-move liquidity vacuum.
⚠️ Trading Strategy
Avoid chasing mid-range noise
Let price come into levels
Focus on confirmations:
Structure breaks
Volume expansion
Reaction speed at zones
Remember: Location > Prediction.
🧭 Final Thoughts
Bitcoin is sitting at a high-probability reaction area. The next expansion move will likely come after liquidity is fully engineered around current consolidation.
Stay patient, trade the reaction — not the emotion.
X-indicator

M&M is looking good for 21% upside in next 5-6 MonthsM&M is looking good for 21% upside in next 5-6 Months
LTP - 3528
SL - 3280
Targets - 4300+
timeframe - 5-6 Months
Fundamentals:
Mahindra & Mahindra operates diverse businesses including Auto, Farm, Financial Services. It holds market leadership in SUVs and LCVs, is the #1 tractor manufacturer, and #1 in EV Re.
Company has delivered good profit growth of 113% CAGR over last 5 years.
Happy investing.

Gold Price Update: Trendline Breakout with Clear Risk DefindGold has broken above the falling trendline, and this move is important not because of one candle, but because of the change in structure. After a prolonged corrective phase, price is now holding above the breakout level, which signals that buyers are starting to step in.
What I like about this setup is the clarity. The breakout is clean, risk is clearly defined below the structure, and price is now trading in an area where continuation becomes more likely if buyers maintain control.
There is no need to chase the move. As long as price holds above the breakout zone, the upside continuation scenario remains valid. If price falls back below the marked risk area, the idea is invalidated. Simple and objective.
This is not about prediction.
It’s about reacting to what price is already showing.
⚠️ Disclaimer
This analysis is for educational purposes only. Markets involve risk. Always manage your position size and trade according to your own risk management rules.

US Dollar Index (DXY)1. What is the US Dollar Index (DXY)?
The US Dollar Index (DXY) is a financial index that measures the strength or weakness of the US dollar (USD) relative to a basket of major global currencies.
It represents how the US dollar is performing in the international foreign exchange (forex) market.
The index helps traders, investors, policymakers, and economists track global confidence in the US dollar.
2. Origin and History of DXY
The US Dollar Index was introduced in 1973 by the Federal Reserve.
Its creation followed the collapse of the Bretton Woods system, when currencies moved from fixed exchange rates to floating rates.
Later, responsibility for the index shifted to ICE (Intercontinental Exchange), which now maintains and publishes it.
3. Base Value of the Index
The base value of DXY is 100.
A reading above 100 means the US dollar has strengthened compared to the base year.
A reading below 100 means the US dollar has weakened.
4. Currency Basket Composition
The DXY is calculated against six major currencies, each with a specific weight:
Euro (EUR) – ~57.6%
Japanese Yen (JPY) – ~13.6%
British Pound (GBP) – ~11.9%
Canadian Dollar (CAD) – ~9.1%
Swedish Krona (SEK) – ~4.2%
Swiss Franc (CHF) – ~3.6%
The Euro has the largest influence, meaning EUR/USD movements heavily impact DXY.
5. How DXY is Calculated
DXY is calculated using a geometric weighted average of the six currencies.
It uses exchange rates between the US dollar and each currency.
The formula gives more weight to currencies with larger trade relationships with the US.
6. What Does a Rising DXY Indicate?
A rising DXY indicates:
Strengthening US dollar
Increased global demand for USD
Capital flowing into US assets
Often reflects:
Higher US interest rates
Strong US economic data
Global risk aversion (safe-haven demand)
7. What Does a Falling DXY Indicate?
A falling DXY indicates:
Weakening US dollar
Reduced demand for USD
Capital moving out of US assets
Often reflects:
Lower interest rates
Expansive monetary policy
Improved global risk sentiment
8. Relationship Between DXY and Interest Rates
DXY is strongly influenced by US interest rates, especially Federal Reserve policy.
Higher interest rates:
Attract foreign investment
Strengthen USD
Push DXY upward
Lower interest rates:
Reduce yield advantage
Weaken USD
Push DXY downward
9. Role of the Federal Reserve
The Federal Reserve (Fed) plays a critical role in DXY movement.
Key Fed tools affecting DXY:
Interest rate decisions
Quantitative easing (QE)
Quantitative tightening (QT)
Forward guidance
Hawkish Fed → Stronger DXY
Dovish Fed → Weaker DXY
10. DXY as a Global Risk Indicator
DXY often behaves as a safe-haven indicator.
During global crises:
Investors rush to USD
DXY rises sharply
During risk-on environments:
Investors seek higher returns elsewhere
DXY weakens
11. Impact of DXY on Commodities
Most global commodities are priced in USD.
Relationship:
Strong DXY → Commodities become expensive → Prices fall
Weak DXY → Commodities cheaper → Prices rise
Strong inverse correlation with:
Gold
Silver
Crude oil
12. Relationship Between DXY and Gold
Gold and DXY usually move in opposite directions.
When DXY rises:
Gold becomes expensive in other currencies
Demand falls
When DXY falls:
Gold demand rises as hedge against USD weakness
13. Impact of DXY on Equity Markets
Strong DXY:
Hurts US exporters
Can pressure emerging market equities
Weak DXY:
Benefits multinational companies
Supports global equity markets
14. DXY and Emerging Markets
Emerging markets often have USD-denominated debt.
Strong DXY:
Debt servicing becomes expensive
Capital outflows from EMs
Weak DXY:
Eases financial pressure
Encourages capital inflows
15. DXY and Indian Markets
DXY has a major influence on:
INR exchange rate
FII flows
Crude oil prices
Rising DXY:
Rupee depreciation
FII selling pressure
Falling DXY:
Rupee appreciation
Improved liquidity for Indian equities
16. DXY in Forex Trading
DXY is widely used by forex traders as a directional bias tool.
If DXY is bullish:
USD pairs like USD/JPY, USD/INR tend to rise
If DXY is bearish:
Pairs like EUR/USD, GBP/USD tend to rise
17. DXY Technical Analysis
Traders analyze DXY using:
Support and resistance levels
Trendlines
Moving averages
RSI and MACD
Breakouts in DXY often lead to strong trends across global markets.
18. DXY Futures and Trading Instruments
DXY can be traded via:
Futures contracts (ICE Exchange)
ETFs like UUP
CFDs
Used for:
Hedging currency exposure
Speculative trading
19. Limitations of the DXY
Currency basket is Euro-heavy
Does not include:
Chinese Yuan
Indian Rupee
May not fully reflect modern global trade dynamics
20. DXY vs Broad Dollar Index
Broad Dollar Index includes currencies of:
China
Mexico
South Korea
DXY is narrower but more widely followed in markets
21. Long-Term Trends in DXY
DXY tends to move in long cycles:
Multi-year bull and bear phases
Driven by:
Interest rate cycles
Economic leadership
Global capital flows
22. Why DXY is Important for Traders and Investors
Acts as a global macro compass
Helps anticipate:
Commodity trends
Equity market movements
Currency volatility
Essential for:
Forex traders
Commodity traders
Equity investors
23. Summary
DXY is a powerful indicator of US dollar strength
Influences almost every global asset class
Reflects macroeconomic, monetary, and geopolitical trends
Understanding DXY helps investors make better cross-market decisions

Long term bullish Chart clearly explains
disclaimer
Only for education purposes
I am not sebi registered
Kindly analyse your trades

We’re looking at Gold vs USD on the 1-hour chartPrice recently completed a deep pullback after a strong bullish leg.
That pullback formed a rounded / cyclical bottom (purple curve), which often signals trend continuation, not reversal.
🧠 Structure & Price Action
What stands out:
Higher low formed after the sell-off → bullish market structure
Strong impulsive bullish candles off the lows → buyers in control
Price reclaimed and is holding above a key mid-range level (~4960)
This tells us:
The correction phase is likely complete, and price is transitioning back into an impulse phase upward.
🎯 Trade Idea (Based on Your Chart)
✅ Entry
Buy around 4,960 – 4,970
This is a pullback entry inside bullish continuation
🛑 Stop Loss
Below the recent structure low
Around 4,840 – 4,860
If price breaks here, the bullish idea is invalidated
🎯 Target
5,050 – 5,100 zone
This aligns with:
Prior resistance
Projected impulse leg (measured move)
Liquidity resting above highs
Risk–Reward:
Roughly 1:2.5 to 1:3, which is solid for an intraday/swing setup.
🔍 Why This Setup Makes Sense
Bullish continuation after correction
Structure shift confirmed (higher low)
Strong momentum candles
Clear invalidation level (clean risk)
The blue projected path you drew fits perfectly with a pullback → continuation → expansion model.
⚠️ Invalidation Clue
If price:
Breaks and closes below the stop zone
Or starts printing lower highs + strong bearish momentum
→ bullish bias is off, and we reassess.

NIFTY KEY LEVELS FOR 11.02.2026NIFTY KEY LEVELS FOR 11.02.2026
Timeframe: 3 Minutes
Sorry for the delayed post..
If the candle stays above the pivot point, it is considered a bullish bias; if it remains below, it indicates a bearish bias. Price may reverse near Resistance 1 or Support 1. If it moves further, the next potential reversal zone is near Resistance 2 or Support 2. If these levels are also broken, we can expect the trend.
When a support or resistance level is broken, it often reverses its role; a broken resistance becomes the new support, and a broken support becomes the new resistance.
If the range(R2-S2) is narrow, the market may become volatile or trend strongly. If the range is wide, the market is more likely to remain sideways
please like and share my idea if you find it helpful
📢 Disclaimer
I am not a SEBI-registered financial adviser.
The information, views, and ideas shared here are purely for educational and informational purposes only. They are not intended as investment advice or a recommendation to buy, sell, or hold any financial instruments.
Please consult with your SEBI-registered financial advisor before making any trading or investment decisions.
Trading and investing in the stock market involves risk, and you should do your own research and analysis. You are solely responsible for any decisions made based on this research.

Pullback Into Resistance, Sell-the-Rally Setup
Market Structure
Overall structure is bearish-to-range after a strong selloff.
Price made a rounded bottom from the Feb lows, then transitioned into a corrective rally.
The rally is retracing into a prior supply / resistance zone, not breaking structure yet.
Key Zones
Major Resistance / Supply: ~5,100 – 5,213
Marked clearly on your chart.
Previous breakdown zone → now acting as resistance.
Minor Resistance (Entry Zone): ~5,050 – 5,105
Price is currently reacting here.
Prior support turned resistance (classic S/R flip).
Support: ~4,650 – 4,700
Strong demand zone.
Previous reaction + liquidity pool.
Intermediate Support: ~4,905
Likely first pause or bounce area if rejection starts.
Price Action Story
The white path shows a corrective ABC-style move into resistance.
Momentum on the way up is weaker compared to the selloff (bearish sign).
No clean bullish break-and-hold above the resistance zone yet.
This favors a rejection rather than continuation.
Trade Idea (As Illustrated)
Bias: Short
Entry: Into 5,050 – 5,100 resistance
Invalidation: Clean 1H close and acceptance above ~5,213
Targets:
~4,905 (partial / scale-out)
~4,650 (main target / demand zone)
What Would Flip This Bullish?
Strong impulsive break above 5,213
Followed by a successful retest and hold
Until then → rallies are suspect.
Summary
This is a sell-the-rally setup into a well-defined resistance zone, aiming for a move back into demand. The chart is structured, levels are respected, and the risk is clearly defined — exactly how you want it.

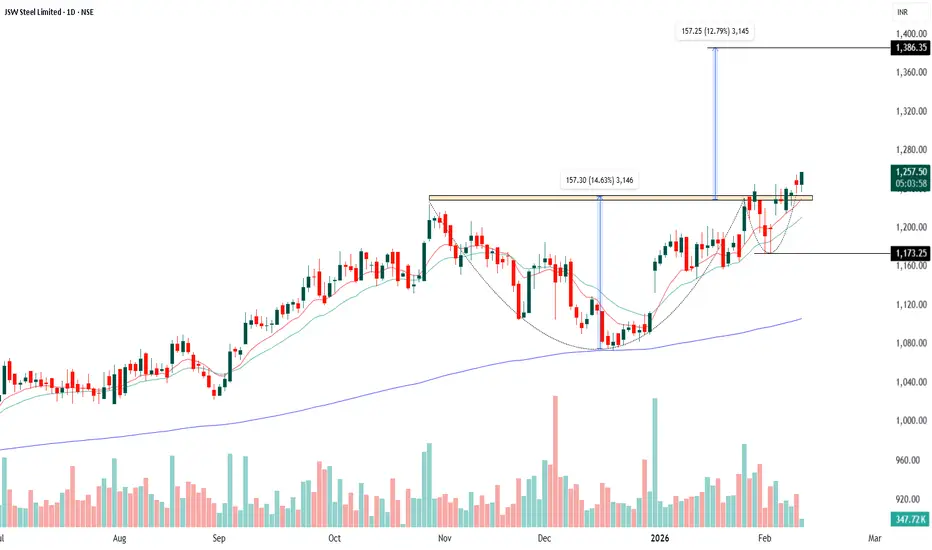
JSW STEEL - Cup and Handle - Daily The price formed a rounded bottom from November to early January, which is the cup. This shows gradual accumulation and exhaustion of selling pressure rather than panic selling.
After reaching the previous resistance zone near 1,240–1,250, the stock moved into a short, shallow pullback, forming the handle. The handle is tight and does not break the prior swing low, which is a healthy sign.
The handle is happening above key moving averages and near the breakout level, which strengthens the pattern quality.
Volumes during the cup were moderate and expanded near the right side of the cup. During the handle, volumes have cooled slightly, which is typical and constructive for a breakout.
A decisive close above 1,255–1,260 with good volume would confirm the cup and handle breakout.
Once confirmed, the pattern projection points towards 1,380–1,400, which also aligns with the measured move marked on the chart.
Entry can be planned on a close above 1,260 or on a minor dip near 1,220–1,230 if the handle support holds. A practical stop loss would be below 1,170, which is below the handle low.
Educational disclaimer: This explanation is for learning purposes only and not a buy or sell recommendation. Chart patterns can fail, and markets carry risk. Always combine technical analysis with risk management and personal due diligence before trading.
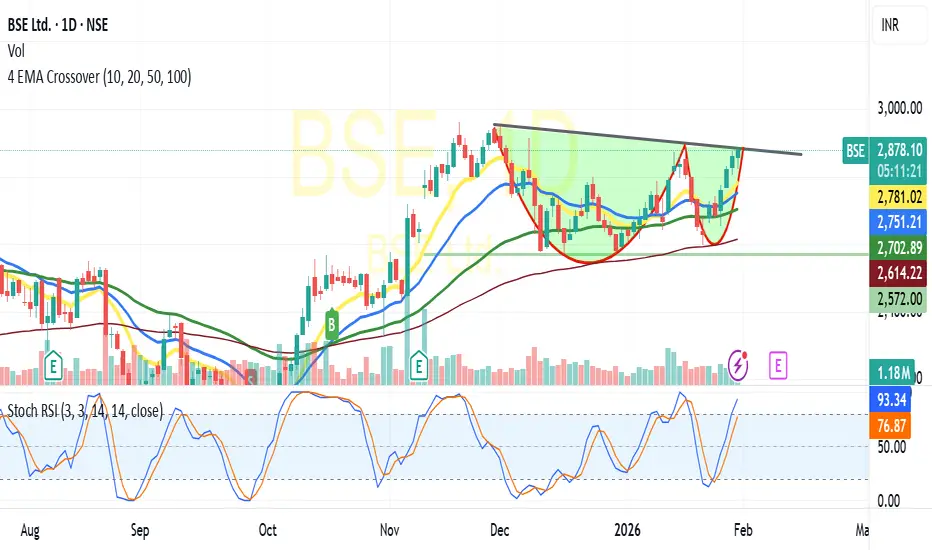
BSE-Likely Cup &Handle Break outBSE:
Trading at 2881 and above all its critical Moving averages Viz10/20/50/10 DEMA
In daily chart has formed C&H Pattern,
Based on the pattern and price volume suggests -breaking the Neckline resistance at 2880-2900 likely to test 2950/3000+ shortly(For educational purpose only)
Maxhealth• Market structure is key: Lower Highs + Lower Lows = Downtrend
• Channels help define direction and control risk
• Always mark major support–resistance zones before planning a trade
• Support can turn into resistance after breakdown
• A bounce doesn’t mean trend reversal — wait for confirmation
• RSI coming out of oversold shows momentum improvement, not trend change
• Trade levels, not emotions
• Let price confirm before assuming upside
• Patience and discipline are edge in trending markets
Learning focus: Follow structure first, indicators second.*

NIFTY LOOKS WEAKTechnical Levels to Watch
If you're tracking the intraday chart for a reversal:
Resistance: 26,000 remains a major psychological hurdle.
Support: 25,800 is the immediate zone to watch for stability.

XAGUSD - Parallel ChannelThe price of silver has already borken out from this parallel channel that it was trading inside for the past few days. If the Bullish momentum continues, expect to have quick pullback to approx $74-$75 before continuing the next leg up. Also the RSI has now returned to neutral territoriy, which would be a good sign for the bullish trend to continue. But if we do see a breakdwon in the momentum, expect the prices to retest $50-$54 before turning bullish again.

Gold Trading Strategy for 10th February 2026📊 Intraday Trading Plan – Breakout Strategy (1-Hour Candle)
This strategy is based on 1-hour candle confirmation. Trades should be taken only after candle close, not during formation.
🔼 BUY SETUP (Bullish Breakout)
🟢 Condition:
Buy ABOVE the HIGH of the 1-hour candle
Candle must close above 5109
📍 Entry:
Buy once price sustains above 5109 after 1-hour candle close
🎯 Targets:
Target 1: 5123
Target 2: 5140
Target 3: 5158
🛑 Stop Loss:
Below the low of the same 1-hour candle or as per your risk management
📈 View:
Strength above 5109 indicates bullish momentum
Trail stop loss after each target is achieved to protect profits
🔽 SELL SETUP (Bearish Breakdown)
🔴 Condition:
Sell BELOW the LOW of the 1-hour candle
Candle must close below 5024
📍 Entry:
Sell once price sustains below 5024 after 1-hour candle close
🎯 Targets:
Target 1: 5009
Target 2: 4990
Target 3: 4978
🛑 Stop Loss:
Above the high of the same 1-hour candle or as per your risk management
📉 View:
Breakdown below 5024 confirms bearish pressure
Partial profit booking is recommended at each target
⚠️ Important Trading Rules
✔ Trade only after 1-hour candle close
✔ Avoid overtrading
✔ Follow strict risk management
✔ Market conditions can change rapidly
🚨 DISCLAIMER
⚠️ This content is for educational purposes only.
⚠️ Not a buy/sell recommendation.
⚠️ Stock/Index market investments are subject to market risk.
⚠️ Past performance does not guarantee future results.
⚠️ Please consult your financial advisor before taking any trade.
⚠️ The author is not responsible for any profit or loss arising from the use of this information.

Gold Trading Strategy for 11th Feb 2026📊 Intraday Trading Setup (Based on 15-Minute Candle)
Time Frame: 15-Minute
Methodology: Price Action + Breakout Confirmation
Tool Reference: Icona DNA$.M
🔼 BUY SETUP (Bullish Scenario)
Condition:
Buy only if a 15-minute candle closes above 5080
Entry:
👉 Buy above the high of the confirmed 15-minute candle closing above 5080
Targets:
🎯 Target 1: 5090
🎯 Target 2: 5100
🎯 Target 3: 5110
View:
Sustained price action above 5080 indicates bullish strength.
As per Icona DNA$.M, momentum expansion and volume confirmation favor an upside continuation once resistance is decisively broken.
🔽 SELL SETUP (Bearish Scenario)
Condition:
Sell only if a 15-minute candle closes below 4998
Entry:
👉 Sell below the low of the confirmed 15-minute candle closing below 4998
Targets:
🎯 Target 1: 4980
🎯 Target 2: 4965
🎯 Target 3: 4950
View:
A breakdown below 4998 signals weakness.
According to Icona DNA$.M, loss of structure and bearish momentum can accelerate selling pressure toward lower demand zones.
🛑 Risk Management
Always trade with strict stop loss based on your risk appetite.
Avoid over-leveraging.
Trade only after candle close confirmation, not on assumption or early breakout.
⚠️ DISCLAIMER
This analysis is for educational purposes only.
Market conditions are dynamic, and trading involves substantial risk.
The author is not responsible for any profit or loss arising from the use of this information.
Please consult your financial advisor before taking any trades.
Trade at your own risk.

XAGUSD 1H Bearish Trendline Rejection📉 Market Structure
Primary trend: Bearish
Price is making lower highs & lower lows
Clear descending channel visible
The recent rally looks like a corrective pullback, not a trend reversal
🔴 Key Rejection Zone
Resistance: 83.50 – 84.20
Price has been rejected exactly at the descending trendline
Bearish reaction candle + arrow confirms seller dominance
📊Pattern Insight
Structure resembles a bear flag / falling channel
Impulse down → consolidation → rejection → continuation expected
Trendline break did NOT happen → bearish continuation favored
❌ Invalidation
Hourly close above 85.00 setup
Clean breakout + hold above descending trendline→ would delay or invalidate bearish setup

XAUUSD – Consolidating Above 5,000 Before the Next Expansion XAUUSD – Consolidating Above 5,000 Before the Next Expansion | Lana ✨
Gold is currently trading around 5,020 USD/oz after a controlled technical pullback from recent highs. The overall structure, however, suggests this is a pause within a broader medium-term rising channel rather than a trend reversal.
On the H2 timeframe, price continues to respect the ascending channel and internal trendline support. The 5,000–5,050 zone has now become a key liquidity battleground between short-term sellers and medium-term buyers.
🔍 Technical View
5,000 USD remains the key psychological pivot. Holding above this level keeps the medium-term bullish structure intact.
5,260–5,270 (Sell FVG zone) acts as the next supply region and liquidity target if bullish momentum expands.
5,450–5,600 represents higher-timeframe liquidity near the all-time high zone, where stronger sell reactions may emerge.
Any pullback toward the lower boundary of the channel would likely be seen as structural re-accumulation rather than reversal.
Price action suggests compression within value, indicating liquidity build-up before a potential expansion move.
🌍 Fundamental Backdrop
Gold remains supported by three major drivers:
A weaker US Dollar as markets await key US data releases.
Cooling US Treasury yields, reducing the opportunity cost of holding gold.
Ongoing central bank gold accumulation and geopolitical uncertainty, reinforcing long-term demand.
Markets are closely watching upcoming Nonfarm Payrolls and CPI data, which will shape expectations around future Fed policy:
A more dovish outcome may trigger a breakout above current resistance.
A more hawkish surprise could create short-term pressure, though deeper pullbacks may still attract accumulation within the broader trend.
🧠 Lana’s View
The pullback near 5,000 appears technical, not structural. As long as the rising channel holds, the medium-term bias remains constructive.
Gold is consolidating — not reversing.
✨ Stay patient, respect liquidity zones, and let the data confirm the next expansion.

EURUSD Weekly Outlook (SMC + HTF Resistance Confluence)📊 Market Structure Overview
EURUSD is currently trading into a major weekly supply / resistance zone while respecting a long-term descending trendline connecting multiple swing highs. Price has approached this area several times historically and reacted with strong bearish momentum — making it a high-probability reaction zone on the HTF.
🔎 Key Technical Observations
Price is testing a multi-year descending trendline → strong dynamic resistance.
Presence of SMC concepts on chart: BOS / CHoCH and visible FVG zones below current price.
Current rally looks like a liquidity grab into premium pricing within weekly structure.
Equal / relative highs marked — potential buy-side liquidity before reversal.
HTF structure overall remains bearish / corrective, not a confirmed bullish trend reversal.
📍 Trading Plan (Idea — Not Financial Advice)
➡️ Primary Bias: Bearish from weekly resistance.
➡️ Entry Concept:
Wait for lower-timeframe confirmation such as:
Bearish engulfing candle
Pin bar rejection
Market structure shift / CHoCH
➡️ Targets:
First reaction → mid FVG / internal demand
Major target → HTF demand zone around parity region (~1.00 area)
Extended bearish scenario → deeper weekly demand near lower red zone
⚠️ Risk Factors / Invalidation
Strong weekly close above trendline and resistance zone.
Bullish continuation with sustained higher highs + higher lows on HTF.
Macro catalysts (ECB/Fed policy shifts) could accelerate volatility.
🧠 Final Thoughts
This setup aligns with a classic premium sell model — price rallies into HTF supply + trendline confluence before targeting imbalances below. Patience is key: confirmation matters more than prediction.

Gold Analysis & Trading Strategy | February 11-12✅ 1H Trend Analysis
● After breaking above 5070, price surged to a high of 5119 but failed to continue accelerating, forming a short-term top.
● The bullish structure remains intact, but after the push higher, the market has entered a consolidation and correction phase.
● Price is currently ranging between 5030–5100, and the moving averages are beginning to converge.
● The Bollinger Bands are narrowing, indicating volatility compression and a wait for the next directional move.
● The 5000–4980 zone is the key short-term boundary.
👉 The core focus is the breakout direction of 5000 and 5100.
🔴 Resistance
● 5100–5120 (previous high resistance)
● 5160–5180 (extended target after breakout)
🟢 Support
● 5000–4980 (key boundary zone)
● 4940–4900 (structural defense zone)
✅ Trading Strategy Reference
🔰 Long Strategy (Buy on pullback)
👉 Entry 1: 5000–5020
👉 Entry 2: 4970–4980
🎯 Target 1: 5100
🎯 Target 2: 5160
🔰 Short Strategy (Light short near previous highs)
👉 Entry: Light short between 5100–5120
🎯 Target: 5050 / 5020 / 4980
✅ Risk Control
● If price holds firmly above 5120 → bullish acceleration, upside space opens
● If price breaks below 4980 → structure weakens, deeper pullback likely
● Current phase: The rally failed to hold, but the trend has not turned bearish; range-bound consolidation, waiting for direction.

TATA GOLD Next StepGold and gold-linked ETFs can be sensitive to:
📉 Short-Term Risks
Profit booking after strong rallies (can cause dips).
Global macro data (e.g., US rate news, dollar strength) affecting gold prices.
Market corrections can continue before new trend emerges.
📈 Short-Term Positives
Safe-haven demand remains strong — especially with geopolitical uncertainty and inflation concerns.
Corrective pullbacks often become entry points for long-term investors.
Important: Short-term price moves are hard to predict — gold prices fluctuate from day to day based on macro news and technical traders’ behavior.
On my advise for all investors may be buy maximum lot size of #TATAGOLDETF for earn Maximum Return to year and year

Nifty50 analysis(11/2/2026).CPR: narrow + ascending cpr: trending
FII: 69.45 bought
DII: 1,174.21 bought
Highest OI: too soon to tell
CALL OI: 26000
PUT OI: 26000
Resistance: - 26000
Support : - 25950
conclusion:.
My pov
1.market is in buy on dip mode any fall or support can rise the market to 26000 to atm.
2. Yesterday forms a virgin cpr so today highly possible to touch cpr and rise . 25930 also today narrow cpr.
3. If it breaks 26000 then all time high is the target. Only if it close in day candle.
4. Fii and dii continusly buying this show the bullishness in market. Clearly market in trend and a trend rise from a sharp fall. Expect the anything can happen.
What IF:
1.market can fall upto 25900 there one hour candle 50ma support that gives a good support.
2. If market breaks 26000 then all time high is the resistance.
Psycology:
Make a trade with high possibilities. Dont hope one factor make multiple factor on your side.
note:
8moving average ling is blue colour.
20moving average line is green colour
50moving average line is red colour.
200moving average line is black colour.
cpr is for trend analysis.
MA line is for support and resistance.
Disclaimer:
Iam not Sebi registered so i started this as a hobby, please do your own analysis, any profit/loss you gained is not my concern. I can be wrong please do not take it seriously thank you

Sagility cmp 50.07 by Weekly Chart view since listedSagility cmp 50.07 by Weekly Chart view since listed
- Support Zone 43.50 to 47.50 Price Band
- Resistance Zone 53.75 to ATH 57.89 Price Band
- Darvas Box Chart Setup : Price traversing between 47 to ATH 53.25 range since Nov 2025
- Volumes facing selling pressure at each uptrend at Resistance Zone lower side price level
- Bullish Rounding Bottoms have been made between the Support Zone and Resistance Zone
- Resistance Zone Breakout trigger may happen but is subject to Volumes increase exponentially

NIFTY 50 — This Is Not a Trend. This Is a Setup.CMP: 25,946
The panic low is in.
The bounce happened.
Now we’re at the part where amateurs get chopped.
Daily:
Still below the real supply at 26,200–26,300.
Until that level is accepted, this is repair — not breakout.
Intraday:
Tight compression between 25,930 and 25,980.
VWAP magnet.
Liquidity building on both sides.
This is where the market decides who pays.
---
The Playbook
Above 25,980 — and holding
That’s when range expands.
Target liquidity near 26,050–26,120.
Momentum players re-enter.
Below 25,930
Fast rotation into 25,850.
No drama. Just mechanics.
---
We’re sitting at a structural pivot.
Balanced number. Balanced order flow.
Markets don’t idle at balance — they transition.
No prediction.
Only positioning for the move.
#NIFTY50 #IndexTrading #MarketStructure #IntradayPlan #Liquidity #TradingView
