XAUUSDGreetings!
Welcome traders.
By choosing to "Follow", you can stay updated with the latest information promptly. Kindly consider clicking "Boost" as well.
Wishing you a pleasant day.
X-indicator

XAUUSD Short Idea XAUUSD short idea, sell below harmonic level (below B) with a confirmation. target till the FVG or Ride it with a trailing SL.

MOMENTUM STOCK- HIGH VOLUME ACTION AT TOP OF CONSOLIDATIONPrice above 20, 50 & 200 SMA.
RSI > 60 in Weekly and daily.
MACD - positive crossover
ADX (5) > 20

Bearish Pullback From Key Resistance, Targets Below
Overall structure
Gold is in a short-term bearish correction after a strong impulsive sell-off. The left side of the chart shows a distribution → breakdown → liquidity sweep, followed by a corrective bounce that is now losing steam.
Key zones & story the chart tells
Major Resistance Zone (≈ 5,105 – 5,213)
This blue zone previously acted as support, then flipped to resistance. Price has revisited it and failed to reclaim, confirming a classic support → resistance flip.
Entry Area (around 5,100)
The pullback into resistance aligns with:
Lower-high structure
Bearish reaction after a corrective rally
Rejection near prior consolidation
This is the logical short entry zone, as marked.
Fair Value Gap (FVG)
The rally partially filled the FVG but failed to continue higher — another sign of weak bullish intent.
Notice the white projected path: price is respecting a corrective wave rather than impulsive buying.
Targets
1st Target: ~4,750
Prior reaction level and mid-range liquidity. Likely pause or partial take-profit zone.
2nd Target / Support: ~4,586
Strong demand zone and previous base. This is the main downside objective if bearish momentum continues.
Bias summary
Bias: Bearish below 5,105
Invalidation: Clean break and hold above 5,213
Market logic:
Distribution → breakdown → pullback into resistance → continuation lower
Big picture takeaway
This is a textbook pullback-short setup after a strong bearish impulse. As long as gold remains capped below the resistance band, the path of least resistance points down toward 4,750 and potentially 4,586.

Senores Pharma cmp 823.40 by Daily Chart view since it listedSenores Pharma cmp 823.40 by Daily Chart view since it listed
- Support Zone 765 to 805 Price Band
- Resistance Zone 835 to ATH 876.50 Price Band
- Stock Price trending upside within Rising Price Channel
- Volumes are running well in sync under avg traded quantity
- Majority Technical Indicators EMA, BB, MACD, RSI trending positively

ITC 4H Kijun Failure: Is the Downtrend Louder Than the Dividend?The dividend adjustment is complete — price action now carries the final verdict .
On the 4H chart, ITC attempted a Kijun reclaim but failed to gain acceptance. The probe above equilibrium was sold into, followed by compression and a delayed but decisive close back below Kijun. Weekly price action remains under the Kumo , keeping HTF bias firmly bearish.
As long as price fails to close above 324.75 on a 4H basis (high of the reclaim attempt), the bearish structure remains intact.
Downside reference zones: 307.6 → 303.6 → 298.5 → 293.0
Bottom line:
The dividend narrative has faded. The structure hasn’t.

Silver future heading towards 100 MA Silver future is heading towards it's 100 mA of 2,15,000 almost. But one can consider 199,282 as the pivot level and 1,71508 as the major support, because that was the last major leg of this rally.

TRADE CATALYST SERIES - Episode 1 // PARADEEP PHOSPHATES LTDMajor trade deals don’t just influence diplomacy -- they create real opportunities in the stock market.
This series explores how the evolving India-US and India-EU trade partnerships could act as catalysts for select Indian companies. Each episode highlights carefully researched stocks that may benefit from these global economic shifts.
NSE:PARADEEP
1. Macro Catalyst Overview
These india's trade deals brings in two major developments:
India-EU FTA : A deal eliminating tariffs on Indian industrial goods and agricultural exports to Europe, while slashing import duties on European machinery.
US-India Trade : A strategic agreement focusing on technology transfer and supply chains, but reducing reliance on cheap/discounted Russian oil .
Global supply chains are decoupling from single-source dependencies. India is positioning itself as a manufacturing hub, while the West seeks to align India’s energy and tech standards with its own.
Market Impact:
Positive: Cheaper capital goods (machinery) for Indian manufacturers and opened gates for Indian agri-exports.
Negative: Potential spike in energy costs due to the shift away from discounted Russian feedstock.
2. Sector Impact - Fertilizers & Agro-chemicals
The "Agri-Export" angle : The EU has removed tariffs on Indian commodities. helps increase demand of NPK fert and nutrients.
The "Capex" advantage: Fert plants are capital intensive. removal of duties on European machinery will significantly lowers the cost of capacity expansion and maintenance.
The "Feedstock" squeeze: The sector requires high energy. The US-India pact’s pressure to move away from cheap Russian gas/ammonia could increase input costs, compressing margins.
3. Stock Spotlight
PPL is India’s second-largest private phosphatic fertilizer player. It distinguishes itself through backward integration (making its own acids) and a "parentage moat"—it is a joint venture with the OCP Group (Morocco), which controls 70%+ of the world's phosphate reserves.
Why This Company Benefits:
-Direct Beneficiary of Agri-Boom: PPL has a stronghold in Eastern and Southern India—key regions for tea and spice plantations. As the India-EU FTA boosts these plantations' income, PPL’s high-margin NPK fertilizer sales are poised to surge.
-Capex Efficiency: PPL is aggressively expanding capacity to 3.7 MMT. The zero-duty import of European technology will directly reduce the project cost of this expansion, improving ROCE.
- Raw Material Shield: While the sector faces energy cost risks (US Deal fallout), PPL’s partnership with OCP ensures a steady supply of Rock Phosphate, insulating it from the worst of the supply chain disruptions.
4. Fundamental Strength Check
Revenue Growth +48%yoy (Q3 2026)
Operating Margin ~9.5% ( compressed)
P/E ~ 14x
D/E 0.8x
order book is showing high visibility
5. Technicals
On Weekly chart the price is in a very sweet support zone. also the volume on red candles weekly is shrinking below VA of 10 - indicating sellers are loosing the control and bulls might now take over soon.
On Fib within price range between a year period the next targets would be at 0.5, 0.618 and 0.786 levels.
6. Risk Factors
->Energy Cost Inflation: If the US-India deal forces a switch to expensive LNG/Ammonia, PPL’s raw material bill could rise, squeezing margins further.
->Regulatory Hiccups: The recent seizure of 25,000 MT of Urea (Jan 2026) over quality disputes ("Biuret content") highlights operational and regulatory risks.
->Subsidy Dependence: Like all fertilizer stocks, PPL’s cash flow is heavily dependent on the timely release of government NBS (Nutrient Based Subsidy) payments.
->Monsoon Sensitivity: A sub-par monsoon could dampen the expected demand boom from the agri-export sector.
7. Final Verdict
I am Long on the weekly period with the following values.
Entry : 120-130
T1 : 160
T2 : 177
SL : 115
Future episodes will explore additional sectors and companies that could emerge as beneficiaries of evolving global trade partnerships. If your eye catches on to some particular stock reflecting on the same let me know in the comments below I will do a episode on it too.

ABINFRA – Trade AlertCMP: 20.99
Breakout Context: Trendline + consolidation breakout confirmed today with strong volume, adding conviction.
- Target: 26.64 (+26.9%)
- Stop Loss: 19.30 (-8.0%)
- Risk/Reward Ratio: ~1 : 3.4
🔑 Key Notes
- Strong volume breakout suggests genuine momentum; monitor for retests.
- Healthy retest zone: 20.41 – 20.50 (as long as price holds above stop loss).
- Trail stop loss upward as price advances to secure gains.

BTCUSD (1H) – Bearish Continuation | Trendline Breakdown IdeaMarket Structure
Bitcoin remains in a clear descending channel on the 1H timeframe. Price has consistently respected the downward sloping trendline, confirming a strong bearish structure with lower highs and lower lows.
Technical Confluence
Trendline Resistance (Red): Multiple rejections validate seller dominance.
Auto Pitchfork: Price is trading below the median line, indicating continuation toward the lower parallel.
Dynamic Support (Green): The recent breakdown below channel support signals bearish continuation rather than a reversal.
Balance of Power (BoP): Reading around -0.38 reflects sustained selling pressure with no bullish divergence.
Price Action
A brief consolidation failed to hold, followed by a strong bearish impulse that broke key intraday support. The current move suggests momentum-driven continuation, not exhaustion.
Trade Idea
Bias: Bearish
Sell Zone: Pullback toward broken support / descending trendline
Targets:
First target: Previous minor low
Extended target: Lower pitchfork boundary / demand zone
Invalidation: Sustained close above the descending trendline
Conclusion
As long as BTC remains below the descending trendline and pitchfork median, the path of least resistance is downward. Any retracement into resistance is likely to be a selling opportunity unless market structure shifts.
Always manage risk and wait for confirmation.

EVEREADY | Trade SetupCurrent Market Price (CMP): 345.40
Breakout Context:
A trendline plus consolidation breakout has been confirmed today with strong volume, adding conviction to the move.
Target: 440 (approx. +27.4% from CMP)
Stop Loss: 316 (risk of about -8.5% from CMP)
Key Notes
- Breakouts accompanied by volume often indicate genuine momentum, but be prepared for possible retests of the breakout zone.
- If price dips toward 341.00–340.50 but holds above the stop loss, consider it a healthy retest.
- Trail your stop loss upward as price advances toward the target to secure gains and reduce risk.

Bearish Rejection From Supply, Targets Below
Market Structure
Price previously made a blow-off top (sharp impulsive high, marked by the red arrow), followed by a strong bearish reversal, breaking short-term structure.
The subsequent bounce formed a lower high, confirming a bearish market structure shift on the intraday timeframe.
Key Zones
Gray zone (≈ 4,880–4,950): Former demand → now supply / resistance.
Price retested this area and rejected, which is classic bearish continuation behavior.
Blue zone (≈ 4,520–4,600): Major support / demand zone from the prior swing low.
Trade Idea Logic (as drawn)
Entry: Short on rejection from the gray supply zone after weak bullish retracement.
1st Target: Around 4,714 — interim support / liquidity pool.
2nd Target: The blue support zone — completion of the bearish leg and likely reaction area.
Price Action Clues
Retracement into resistance was corrective (overlapping candles), not impulsive → favors sellers.
Failure to reclaim the gray zone = sellers still in control.
Momentum points downward, aligning with the projected path.
Invalidation
A clean 45-min close and hold above the gray supply zone would weaken the bearish bias and suggest deeper consolidation or reversal.

Bearish continuation for BTCUSD📍 Primary Plan — Short the Pullback
✅ Entry Zone (Sell)
69,800 – 70,800
Reason:
Previous breakdown area
Intraday supply
Likely retest zone after bounce
🛑 Stop Loss
Above 71,300
Why:
Above last lower-high cluster
Above pullback structure
If price gets here → bearish idea weakens
🎯 Targets
Target Level Logic
T1 68,000 intraday support
T2 66,500 recent sweep zone
T3 65,000 next liquidity pocket
T4 60,000 Final stoppage
Scale out — don’t hold full size to last target.
🚀 Alternate Plan — Breakout Long (Only If Structure Shifts)
Right now this is counter-trend — so only trade if confirmed.
✅ Breakout Confirmation (Must Have)
15m candle close + hold above 71,000–71,200
Not just a wick — a body close + small pullback hold.
📍 Long Entry Zone
On retest of 71,000–71,200 after breakout
🛑 Stop Loss (Long)
Below 70,200
🎯 Long Targets
Target Level
T1 72,300
T2 73,100
T3 74,200
⚠️ Quick Reality Check (Important)
Right now:
Momentum = bearish
Structure = lower highs / lower lows
Best edge = short pullbacks, not blind longs
Breakout longs only after reclaim — no anticipation trades here 😄

Sharda Cropchem (D): Aggressive Bullish (Earnings-Led Re-rating)(Timeframe: Daily | Scale: Linear)
The stock has confirmed a major breakout from a 7-month consolidation ("The Box"). This is a high-quality breakout because it is supported by a fundamental turnaround (earnings explosion) and record volumes.
🚀 1. The Fundamental Catalyst (The "Why")
The technical explosion is fully justified by the numbers:
> Q3 Earnings Blowout: The 366% profit jump re-rated the stock overnight. The market is adjusting the price to reflect this new earnings reality.
> Dividend Yield: The interim dividend of ₹6 (Record Date: Feb 6) adds a "Carry" incentive for buyers to hold.
> Volume Significance: The "Huge Volume" is institutional accumulation. Funds are likely re-entering the stock after the strong guidance.
📈 2. The Chart Structure (Rectangle Breakout)
> The Box: The ₹760 – ₹1,160 trading range, the stock spent 7 months coiling in this zone.
> The Breakout: Today's close at ₹1,162.70 is the first valid daily close above this multi-year barrier. A breakout from such a deep base usually has long legs.
📊 3. Volume & Indicators
> RSI: RSI is rising in all timeframes. In "Blue Sky" breakouts (New ATH), RSI can stay above 70 (Overbought) for extended periods. Do not treat it as a sell signal yet.
> EMAs: The Positive Crossover (PCO) across all timeframes confirms the trend is in the strongest possible state ("Markup Phase").
🎯 4. Future Scenarios & Key Levels
The stock is now in "Price Discovery."
🐂 Bullish Targets (The Upgraded View):
- Target 1: ₹1,327
- Target 2: ₹1,560.
🛡️ Support (The "Must Hold"):
- Immediate Support: ₹1,119 – ₹1,150 . The breakout zone.
- Refinement: If the stock dips to ₹1,120 , it is a "screaming buy" opportunity. The sideways support of ₹760 is now too far away to be relevant for this momentum leg.
Conclusion
This is a Grade A+ Setup.
> Refinement: The combination of Record Earnings + New ATH + Volume is the "Holy Trinity" of trading setups.
> Strategy: Watchout for the price action in the coming days & hold for ₹1,327 .


DAILY FOREX SCAN Session – 26 05 02 26Scanning multiple forex pairs to filter high-quality trade setups. No trades are forced—only structure-based opportunities.
Note: There may be a delay in this video due to upload processing time.
Disclaimer: FX trading involves high leverage and substantial risk, and losses can exceed your initial investment. This content is for educational purposes only and should not be considered financial advice. Trade at your own risk.

Double bottom created in Dmart 1) On support dmart have formed double bottom pattern
2) falling wedge pattern makes more confirmation that buyers are taking control now
3) In negative market stock didn't breakdown
4) In short term stock may reach 4300 levels with strict sl R:R is good

NAS100 – Range extension Play from discount area.🔍 Market Context
Nasdaq is currently reacting from a discount area with confluence from the 24700 support zone and the lower trendline support. Price has shown signs of holding this level, indicating a potential bullish pullback toward premium levels.
📘 Trade Idea (Long Bias)
Entry: 24700
Stop-Loss: 24550 (below structural support + trendline)
Take-Profit Targets:
TP1: 25000
TP2: 25175
This setup anticipates a reaction from the discount zone back toward equilibrium and previous supply levels.
📌 Notes
Confluence of discount pricing, trendline support, and horizontal support increases probability.
Structure remains bearish overall, so this is a counter-trend pullback long—manage risk accordingly.
⚠️ Disclaimer
For educational purposes only. Not financial advice. Follow for more ideas.

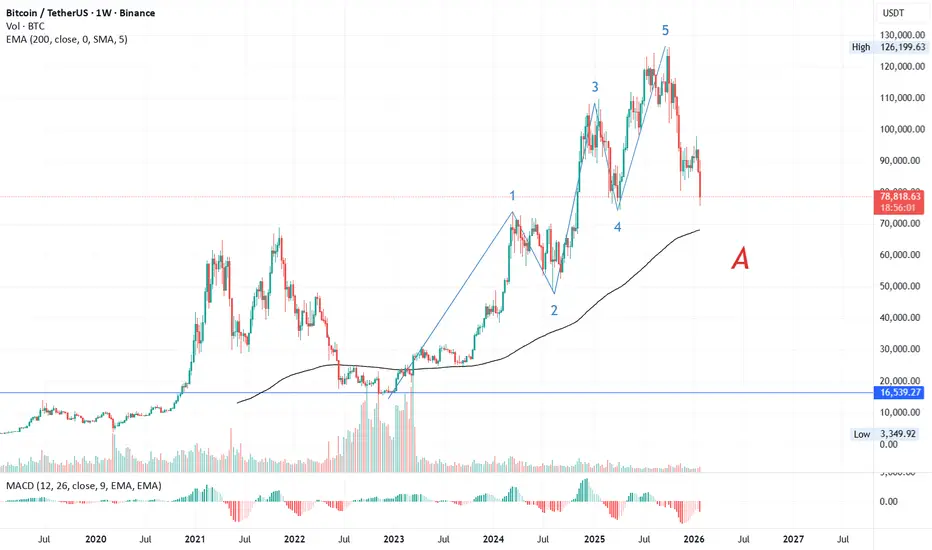
#BitcoinBitcoin Wave Analysis
Bitcoin’s bull run began in December 2022 around $14,500, forming a clear impulsive structure:
- Wave 1: $73,700 (March 2024)
- Wave 2: $50,500 (August 2024)
- Wave 3: $108,000 (January 2025)
- Wave 4: $79,000 (March 2025)
- Wave 5: $126,199 before correction
After this five-wave move, Bitcoin entered a corrective phase. The A wave shows a five-wave subdivision, with Wave 1 extended. Elliott Wave theory suggests retracement often revisits Wave 2 territory, pointing to $65,000–$67,000, in line with the 200 EMA weekly (~$67,000). This implies a potential 15% drawdown from current levels.
Silver - Falling WedgeSilver (XAUUSD) price action has evolved into a falling wedge pattern. Which fits with my previous thesis (refer to my previous post) where i was planning to go long. Once the upper resistance of this wedge get's breached, I am going long. Ideally once the price corsses $78 !!!
Not financial advice.

Nasdaq Ichimoku 1H: Kijun Rejection — Control Firmly with BearsNasdaq Ichimoku 1H: Kijun Rejection — Control Firmly with Bears
The Daily TF has just undergone a Kumo breakdown , confirming a fresh bearish shift in higher-timeframe structure . That HTF signal provides clear downside context and support for continuation setups on lower timeframes.
Within this backdrop, the 1H chart printed a clean Kijun reclaim failure . Price attempted to reclaim balance but failed to sustain or close above the Kijun, reinforcing that upside attempts remain corrective and are being sold into .
As long as price fails to decisively close above 25,169 on a 1H closing basis , bearish structure remains intact. Below, the following reference levels act as natural reaction zones within the ongoing downtrend:
L1: 24,856
L2: 24,752
L3: 24,652
Until balance is reclaimed and held, the message from structure is clear: Control remains firmly with the bears.

XAUUSD (H2) – Liam ViewXAUUSD (H2) – Liam View
USD strength continues to limit gold | Sell-side structure still active
Quick summary
Gold remains under pressure on the H2 timeframe as a firm US Dollar keeps weighing on precious metals. The recent rebound looks corrective and lacks solid acceptance above supply. With markets positioning ahead of the delayed US Non-Farm Payrolls on Feb 11, volatility may increase, but structure still favours selling rallies.
Macro context
A stronger USD generally acts as resistance for gold and silver.
If the current USD rebound sustains, downside pressure on gold can continue.
Positioning ahead of US labour data increases the risk of liquidity-driven moves.
Technical view (H2)
After a sharp sell-off, price bounced from demand but stalled below previous distribution.
Key zones
Major sell zone: 5115 – 5130, extending toward 5535
Current reaction area: around 5000
Key demand / liquidity base: 4550 – 4580
Lower highs below resistance keep sell-side control intact unless price reclaims 5115 decisively.
Trading scenarios
Primary: Sell rallies into 5000 → 5115, targeting 4550
Continuation: Clean break below 4550 opens further downside
Invalidation: Only strong H2 acceptance above 5115 shifts bias bullish
Execution notes
Expect stop runs near data releases.
Wait for level reaction, not candle chasing.
Bias: sell rallies until structure changes.
— Liam

Analysis on GoldI see a W Structure with double top at 5010-5000 levels with OB at 5025-5010 pushing gold back to 4850-4750 levels. I see a sell from these levels for the NY session
Gold sell 5000-4980
Safe Sell 5020-500
Tp levels on the chart
Happy Trading
