ABINFRA – Trade AlertCMP: 20.99
Breakout Context: Trendline + consolidation breakout confirmed today with strong volume, adding conviction.
- Target: 26.64 (+26.9%)
- Stop Loss: 19.30 (-8.0%)
- Risk/Reward Ratio: ~1 : 3.4
🔑 Key Notes
- Strong volume breakout suggests genuine momentum; monitor for retests.
- Healthy retest zone: 20.41 – 20.50 (as long as price holds above stop loss).
- Trail stop loss upward as price advances to secure gains.
X-indicator

BTCUSD (1H) – Bearish Continuation | Trendline Breakdown IdeaMarket Structure
Bitcoin remains in a clear descending channel on the 1H timeframe. Price has consistently respected the downward sloping trendline, confirming a strong bearish structure with lower highs and lower lows.
Technical Confluence
Trendline Resistance (Red): Multiple rejections validate seller dominance.
Auto Pitchfork: Price is trading below the median line, indicating continuation toward the lower parallel.
Dynamic Support (Green): The recent breakdown below channel support signals bearish continuation rather than a reversal.
Balance of Power (BoP): Reading around -0.38 reflects sustained selling pressure with no bullish divergence.
Price Action
A brief consolidation failed to hold, followed by a strong bearish impulse that broke key intraday support. The current move suggests momentum-driven continuation, not exhaustion.
Trade Idea
Bias: Bearish
Sell Zone: Pullback toward broken support / descending trendline
Targets:
First target: Previous minor low
Extended target: Lower pitchfork boundary / demand zone
Invalidation: Sustained close above the descending trendline
Conclusion
As long as BTC remains below the descending trendline and pitchfork median, the path of least resistance is downward. Any retracement into resistance is likely to be a selling opportunity unless market structure shifts.
Always manage risk and wait for confirmation.

EVEREADY | Trade SetupCurrent Market Price (CMP): 345.40
Breakout Context:
A trendline plus consolidation breakout has been confirmed today with strong volume, adding conviction to the move.
Target: 440 (approx. +27.4% from CMP)
Stop Loss: 316 (risk of about -8.5% from CMP)
Key Notes
- Breakouts accompanied by volume often indicate genuine momentum, but be prepared for possible retests of the breakout zone.
- If price dips toward 341.00–340.50 but holds above the stop loss, consider it a healthy retest.
- Trail your stop loss upward as price advances toward the target to secure gains and reduce risk.

Bearish Rejection From Supply, Targets Below
Market Structure
Price previously made a blow-off top (sharp impulsive high, marked by the red arrow), followed by a strong bearish reversal, breaking short-term structure.
The subsequent bounce formed a lower high, confirming a bearish market structure shift on the intraday timeframe.
Key Zones
Gray zone (≈ 4,880–4,950): Former demand → now supply / resistance.
Price retested this area and rejected, which is classic bearish continuation behavior.
Blue zone (≈ 4,520–4,600): Major support / demand zone from the prior swing low.
Trade Idea Logic (as drawn)
Entry: Short on rejection from the gray supply zone after weak bullish retracement.
1st Target: Around 4,714 — interim support / liquidity pool.
2nd Target: The blue support zone — completion of the bearish leg and likely reaction area.
Price Action Clues
Retracement into resistance was corrective (overlapping candles), not impulsive → favors sellers.
Failure to reclaim the gray zone = sellers still in control.
Momentum points downward, aligning with the projected path.
Invalidation
A clean 45-min close and hold above the gray supply zone would weaken the bearish bias and suggest deeper consolidation or reversal.

Bearish continuation for BTCUSD📍 Primary Plan — Short the Pullback
✅ Entry Zone (Sell)
69,800 – 70,800
Reason:
Previous breakdown area
Intraday supply
Likely retest zone after bounce
🛑 Stop Loss
Above 71,300
Why:
Above last lower-high cluster
Above pullback structure
If price gets here → bearish idea weakens
🎯 Targets
Target Level Logic
T1 68,000 intraday support
T2 66,500 recent sweep zone
T3 65,000 next liquidity pocket
T4 60,000 Final stoppage
Scale out — don’t hold full size to last target.
🚀 Alternate Plan — Breakout Long (Only If Structure Shifts)
Right now this is counter-trend — so only trade if confirmed.
✅ Breakout Confirmation (Must Have)
15m candle close + hold above 71,000–71,200
Not just a wick — a body close + small pullback hold.
📍 Long Entry Zone
On retest of 71,000–71,200 after breakout
🛑 Stop Loss (Long)
Below 70,200
🎯 Long Targets
Target Level
T1 72,300
T2 73,100
T3 74,200
⚠️ Quick Reality Check (Important)
Right now:
Momentum = bearish
Structure = lower highs / lower lows
Best edge = short pullbacks, not blind longs
Breakout longs only after reclaim — no anticipation trades here 😄

Sharda Cropchem (D): Aggressive Bullish (Earnings-Led Re-rating)(Timeframe: Daily | Scale: Linear)
The stock has confirmed a major breakout from a 7-month consolidation ("The Box"). This is a high-quality breakout because it is supported by a fundamental turnaround (earnings explosion) and record volumes.
🚀 1. The Fundamental Catalyst (The "Why")
The technical explosion is fully justified by the numbers:
> Q3 Earnings Blowout: The 366% profit jump re-rated the stock overnight. The market is adjusting the price to reflect this new earnings reality.
> Dividend Yield: The interim dividend of ₹6 (Record Date: Feb 6) adds a "Carry" incentive for buyers to hold.
> Volume Significance: The "Huge Volume" is institutional accumulation. Funds are likely re-entering the stock after the strong guidance.
📈 2. The Chart Structure (Rectangle Breakout)
> The Box: The ₹760 – ₹1,160 trading range, the stock spent 7 months coiling in this zone.
> The Breakout: Today's close at ₹1,162.70 is the first valid daily close above this multi-year barrier. A breakout from such a deep base usually has long legs.
📊 3. Volume & Indicators
> RSI: RSI is rising in all timeframes. In "Blue Sky" breakouts (New ATH), RSI can stay above 70 (Overbought) for extended periods. Do not treat it as a sell signal yet.
> EMAs: The Positive Crossover (PCO) across all timeframes confirms the trend is in the strongest possible state ("Markup Phase").
🎯 4. Future Scenarios & Key Levels
The stock is now in "Price Discovery."
🐂 Bullish Targets (The Upgraded View):
- Target 1: ₹1,327
- Target 2: ₹1,560.
🛡️ Support (The "Must Hold"):
- Immediate Support: ₹1,119 – ₹1,150 . The breakout zone.
- Refinement: If the stock dips to ₹1,120 , it is a "screaming buy" opportunity. The sideways support of ₹760 is now too far away to be relevant for this momentum leg.
Conclusion
This is a Grade A+ Setup.
> Refinement: The combination of Record Earnings + New ATH + Volume is the "Holy Trinity" of trading setups.
> Strategy: Watchout for the price action in the coming days & hold for ₹1,327 .


DAILY FOREX SCAN Session – 26 05 02 26Scanning multiple forex pairs to filter high-quality trade setups. No trades are forced—only structure-based opportunities.
Note: There may be a delay in this video due to upload processing time.
Disclaimer: FX trading involves high leverage and substantial risk, and losses can exceed your initial investment. This content is for educational purposes only and should not be considered financial advice. Trade at your own risk.

Double bottom created in Dmart 1) On support dmart have formed double bottom pattern
2) falling wedge pattern makes more confirmation that buyers are taking control now
3) In negative market stock didn't breakdown
4) In short term stock may reach 4300 levels with strict sl R:R is good

NAS100 – Range extension Play from discount area.🔍 Market Context
Nasdaq is currently reacting from a discount area with confluence from the 24700 support zone and the lower trendline support. Price has shown signs of holding this level, indicating a potential bullish pullback toward premium levels.
📘 Trade Idea (Long Bias)
Entry: 24700
Stop-Loss: 24550 (below structural support + trendline)
Take-Profit Targets:
TP1: 25000
TP2: 25175
This setup anticipates a reaction from the discount zone back toward equilibrium and previous supply levels.
📌 Notes
Confluence of discount pricing, trendline support, and horizontal support increases probability.
Structure remains bearish overall, so this is a counter-trend pullback long—manage risk accordingly.
⚠️ Disclaimer
For educational purposes only. Not financial advice. Follow for more ideas.

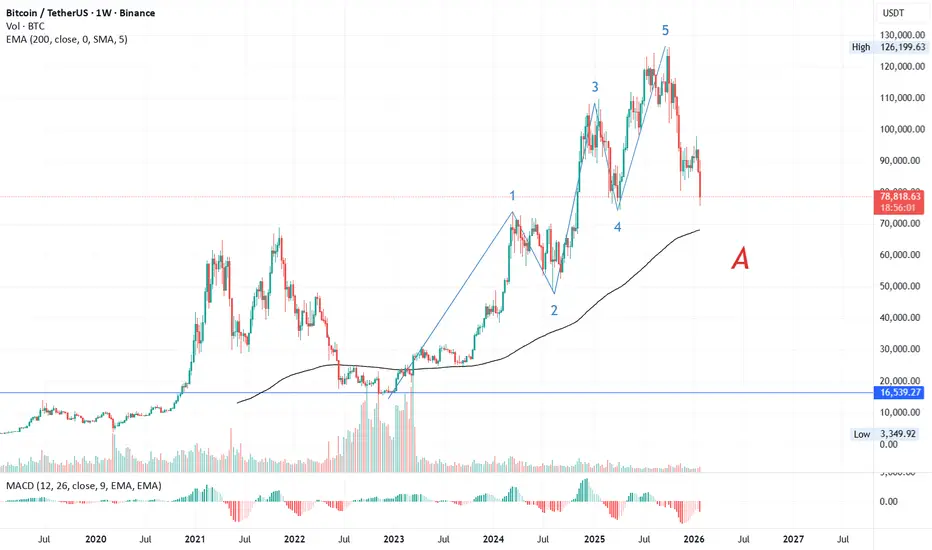
#BitcoinBitcoin Wave Analysis
Bitcoin’s bull run began in December 2022 around $14,500, forming a clear impulsive structure:
- Wave 1: $73,700 (March 2024)
- Wave 2: $50,500 (August 2024)
- Wave 3: $108,000 (January 2025)
- Wave 4: $79,000 (March 2025)
- Wave 5: $126,199 before correction
After this five-wave move, Bitcoin entered a corrective phase. The A wave shows a five-wave subdivision, with Wave 1 extended. Elliott Wave theory suggests retracement often revisits Wave 2 territory, pointing to $65,000–$67,000, in line with the 200 EMA weekly (~$67,000). This implies a potential 15% drawdown from current levels.
Silver - Falling WedgeSilver (XAUUSD) price action has evolved into a falling wedge pattern. Which fits with my previous thesis (refer to my previous post) where i was planning to go long. Once the upper resistance of this wedge get's breached, I am going long. Ideally once the price corsses $78 !!!
Not financial advice.

Nasdaq Ichimoku 1H: Kijun Rejection — Control Firmly with BearsNasdaq Ichimoku 1H: Kijun Rejection — Control Firmly with Bears
The Daily TF has just undergone a Kumo breakdown , confirming a fresh bearish shift in higher-timeframe structure . That HTF signal provides clear downside context and support for continuation setups on lower timeframes.
Within this backdrop, the 1H chart printed a clean Kijun reclaim failure . Price attempted to reclaim balance but failed to sustain or close above the Kijun, reinforcing that upside attempts remain corrective and are being sold into .
As long as price fails to decisively close above 25,169 on a 1H closing basis , bearish structure remains intact. Below, the following reference levels act as natural reaction zones within the ongoing downtrend:
L1: 24,856
L2: 24,752
L3: 24,652
Until balance is reclaimed and held, the message from structure is clear: Control remains firmly with the bears.

XAUUSD (H2) – Liam ViewXAUUSD (H2) – Liam View
USD strength continues to limit gold | Sell-side structure still active
Quick summary
Gold remains under pressure on the H2 timeframe as a firm US Dollar keeps weighing on precious metals. The recent rebound looks corrective and lacks solid acceptance above supply. With markets positioning ahead of the delayed US Non-Farm Payrolls on Feb 11, volatility may increase, but structure still favours selling rallies.
Macro context
A stronger USD generally acts as resistance for gold and silver.
If the current USD rebound sustains, downside pressure on gold can continue.
Positioning ahead of US labour data increases the risk of liquidity-driven moves.
Technical view (H2)
After a sharp sell-off, price bounced from demand but stalled below previous distribution.
Key zones
Major sell zone: 5115 – 5130, extending toward 5535
Current reaction area: around 5000
Key demand / liquidity base: 4550 – 4580
Lower highs below resistance keep sell-side control intact unless price reclaims 5115 decisively.
Trading scenarios
Primary: Sell rallies into 5000 → 5115, targeting 4550
Continuation: Clean break below 4550 opens further downside
Invalidation: Only strong H2 acceptance above 5115 shifts bias bullish
Execution notes
Expect stop runs near data releases.
Wait for level reaction, not candle chasing.
Bias: sell rallies until structure changes.
— Liam

Analysis on GoldI see a W Structure with double top at 5010-5000 levels with OB at 5025-5010 pushing gold back to 4850-4750 levels. I see a sell from these levels for the NY session
Gold sell 5000-4980
Safe Sell 5020-500
Tp levels on the chart
Happy Trading

BTC 1D UpdateThe Hook: Is the floor finally in? $70k is the new battleground. 🩸📉
If you’re looking at your portfolio today, take a deep breath. Bitcoin has officially plunged below $71,000, hitting lows we haven't seen since early November 2024. We’ve wiped out over $500 billion in market cap this week alone, and nearly $1.7 billion in leveraged positions have been vaporized in the last 24 hours.
Why the panic? It’s a "perfect storm" of macro uncertainty. The market is reeling from $272 million in ETF outflows, a partial U.S. government shutdown causing delays in key economic data, and the nomination of Kevin Warsh as Fed Chair, which has investors scrambling to safe-havens like gold.
The Technical Roadmap:
The Critical Support: We are currently battling to hold the $70,129 – $70,900 zone. Losing this could trigger an accelerated slide toward the next major demand level at $68,000 or even $65,000.
The Recovery Trigger: To flip the narrative, we need to reclaim $74,434 on the daily chart. Once we flip that level back into support, the path back to $80k and beyond reopens.
Sentiment Check: The Fear & Greed Index has tanked to 11 (Extreme Fear). Historically, this level of "blood in the streets" is exactly where long-term wealth is built while the "paper hands" exit.
The Play: The smart money isn't panic-selling; they are waiting for the 4H candle to confirm buyer absorption at these levels. Don't be the exit liquidity—be the one who understands the math behind the move.
#Bitcoin #BTC #CryptoTrading #TechnicalAnalysis #TradingView #Web3 #BTCDump #MarketPanic

AAPLAAPL | 1D | Aggressive BUY Setup
📌 Buy only above blue line (262.17) on strong close.
🛑 Stop Loss below red line (255.50) to control risk.
🎯 Minimum Target: Green line (275.38); further upside possible if momentum sustains.
📊 Price attempting base formation after decline
📈 RSI near oversold zone, bounce setup forming
Trade confirmation is mandatory. Strict risk management advised.

Part 2 Ride The Big MovesLot Size
Options trade in lots, not single units.
Lot size varies by instrument.
Why Are Options Popular?
Low upfront premium.
Leverage.
Sophisticated hedging.
High liquidity.
European vs American Options
Indian index options are European — can only be exercised on expiry.
Stock options are American — can be exercised any time (but rarely done).

The Global Inflation Surge: A New Era of High PricesUnderstanding Inflation and Its Return
Inflation refers to the sustained increase in the general price level of goods and services over time, reducing the purchasing power of money. For nearly two decades before 2020, many advanced economies struggled more with low inflation or even deflation than with rising prices. Central banks frequently worried about stimulating demand rather than containing it.
However, this pattern changed dramatically after the COVID-19 pandemic. What began as a temporary spike driven by supply disruptions quickly evolved into a broad-based and persistent inflationary cycle, affecting food, energy, housing, transportation, and services across the globe.
Key Drivers of the Global Inflation Surge
1. Post-Pandemic Supply Chain Disruptions
The pandemic severely disrupted global supply chains. Factory shutdowns, port congestion, labor shortages, and transportation bottlenecks reduced the availability of goods. When demand rebounded faster than supply, prices surged. Key industries such as semiconductors, automobiles, electronics, and pharmaceuticals faced prolonged shortages, pushing costs higher worldwide.
2. Massive Fiscal and Monetary Stimulus
Governments and central banks injected trillions of dollars into the global economy to prevent economic collapse during the pandemic. While these measures were necessary, they also significantly increased money supply. Ultra-low interest rates and direct cash transfers boosted consumer spending, creating excess demand that outpaced supply, fueling inflation.
3. Energy and Commodity Price Shocks
Energy prices became a major contributor to inflation. Crude oil, natural gas, and coal prices rose sharply due to recovering demand, underinvestment in energy infrastructure, and geopolitical tensions. Rising energy costs increased production and transportation expenses, which were passed on to consumers. Similarly, prices of metals, fertilizers, and agricultural commodities surged, affecting food inflation globally.
4. Geopolitical Conflicts and Trade Fragmentation
Geopolitical instability has played a crucial role in sustaining inflation. Conflicts, sanctions, and trade restrictions have disrupted commodity flows, especially in energy and food markets. Increased protectionism and the reshoring of supply chains have raised production costs, reversing decades of globalization that once helped keep prices low.
5. Labor Market Pressures
In many countries, labor shortages emerged as workers reassessed employment conditions after the pandemic. Wage growth accelerated, particularly in services, logistics, and healthcare. While higher wages support consumption, they also increase costs for businesses, contributing to a wage-price spiral in some economies.
Inflation Across Regions
Advanced Economies
The United States, Europe, and parts of East Asia experienced inflation levels not seen in 30–40 years. Housing rents, healthcare, education, and services became major inflation drivers. Central banks responded aggressively by raising interest rates at the fastest pace in decades, aiming to cool demand and restore price stability.
Emerging and Developing Economies
Emerging markets faced a double burden: rising domestic inflation and currency depreciation against the US dollar. Higher import costs for fuel, food, and raw materials intensified inflationary pressures. For low-income countries, inflation translated into food insecurity and increased poverty, highlighting the unequal global impact of rising prices.
Impact on Households and Businesses
Cost of Living Crisis
For households, inflation has significantly reduced purchasing power. Essentials such as food, fuel, housing, and utilities have become more expensive, forcing consumers to cut discretionary spending. Middle- and lower-income families are disproportionately affected, as they spend a larger share of income on basic necessities.
Business Challenges
Businesses face rising input costs, higher borrowing expenses, and uncertain demand. Profit margins are under pressure, particularly for small and medium enterprises that lack pricing power. Companies are increasingly focusing on cost efficiency, automation, and pricing strategies to survive in an inflationary environment.
Central Bank Response and Policy Dilemmas
Central banks around the world have responded by tightening monetary policy through interest rate hikes and balance sheet reductions. While higher rates help curb inflation, they also slow economic growth and increase the risk of recession.
Policymakers face difficult trade-offs:
Raise rates aggressively and risk economic slowdown.
Ease too early and allow inflation to become entrenched.
Manage public debt, which becomes more expensive as interest rates rise.
This delicate balance has made inflation control one of the most complex economic challenges in recent history.
Is This a New Era of High Prices?
Many economists believe the world may be entering a period of structurally higher inflation compared to the pre-pandemic era. Several long-term factors support this view:
De-globalization and supply chain diversification
Energy transition costs
Aging populations and labor shortages
Increased defense and climate-related spending
Persistent geopolitical uncertainty
However, others argue that inflation will moderate once supply chains normalize and monetary tightening takes full effect. The future likely lies somewhere in between—lower than peak levels, but higher and more volatile than in the past decade.
Opportunities in an Inflationary World
Despite its challenges, inflation also reshapes economic opportunities:
Investors turn toward real assets like commodities, real estate, and inflation-linked bonds.
Businesses that can pass on costs or innovate gain competitive advantages.
Governments prioritize domestic manufacturing and strategic industries.
Financial markets evolve with new hedging and risk-management strategies.
Conclusion
The global inflation surge marks a turning point in the world economy. What began as a temporary post-pandemic shock has evolved into a complex and persistent challenge shaped by structural, geopolitical, and demographic forces. Whether inflation settles at moderate levels or defines a new era of high prices will depend on policy responses, global cooperation, and economic adaptation.
For households, businesses, investors, and policymakers alike, understanding inflation is no longer optional—it is essential. The world is adjusting to a reality where price stability can no longer be taken for granted, signaling a profound shift in the global economic landscape.
Alpha Capture Through Earnings SurprisesUnderstanding Alpha and Earnings Surprises
Alpha represents returns above a benchmark (like the Nifty 50 or S&P 500) after adjusting for risk. If the index gives 12% and your strategy gives 18% with similar risk, that extra 6% is alpha.
An earnings surprise occurs when a company’s reported earnings (EPS or profits) differ materially from analyst expectations. These expectations are not casual guesses—they’re baked into prices through forecasts, models, options pricing, and institutional positioning.
Positive earnings surprise: Actual earnings > Expected earnings
Negative earnings surprise: Actual earnings < Expected earnings
The key insight: markets often underreact or overreact to earnings surprises, and that behavioral inefficiency creates tradable opportunities.
Why Earnings Surprises Move Markets
Stock prices are forward-looking. By the time earnings are announced, much of the “known” information is already priced in. What moves the stock is new information.
Earnings surprises deliver exactly that:
New data on profitability
Updated signals about demand, margins, and costs
Management commentary on future guidance
A strong earnings beat doesn’t just say “this quarter was good”—it often forces analysts to revise future estimates upward. That repricing process takes time, which is where alpha lives.
The Post-Earnings Announcement Drift (PEAD)
One of the most well-documented anomalies in finance is Post-Earnings Announcement Drift (PEAD).
What it means:
Stocks with positive earnings surprises tend to continue rising for weeks or months
Stocks with negative surprises tend to continue falling
This directly contradicts the Efficient Market Hypothesis, which assumes prices instantly reflect all information.
Why does PEAD exist?
Institutional investors adjust positions gradually
Analysts revise forecasts slowly
Behavioral biases delay full price discovery
Risk managers scale exposure over time, not instantly
This slow digestion of information allows traders and investors to ride the trend.
Types of Earnings Surprise Strategies
1. Earnings Momentum Strategy
This strategy focuses on stocks that consistently beat earnings expectations.
Core logic:
Companies that beat once are more likely to beat again
Strong operational momentum persists
Traders rank stocks based on:
Size of earnings surprise
Frequency of past beats
Strength of guidance
Positions are taken long in strong beaters and short in consistent underperformers.
2. Short-Term Earnings Reaction Trades
This is more tactical and event-driven.
Approach:
Trade immediately after earnings announcement
Capture sharp price movement over 1–5 days
Key signals:
Gap-up with high volume after a beat
Gap-down breakdown after a miss
The trick here is not the earnings number alone, but how the market reacts to it.
3. Earnings Surprise + Valuation Filter
Not all earnings beats are equal.
A company trading at:
Reasonable valuation + earnings beat = sustainable upside
Extremely high valuation + small beat = risk of sell-off
Combining surprise data with valuation metrics (P/E, EV/EBITDA) improves risk-adjusted returns.
4. Earnings Surprise with Guidance Analysis
Often, guidance matters more than reported earnings.
Scenarios:
Earnings beat + raised guidance → very bullish
Earnings beat + cautious guidance → mixed reaction
Earnings miss + strong guidance → potential reversal
Sophisticated traders focus on forward-looking statements, not just historical numbers.
Measuring Earnings Surprises
Professionals don’t rely on headlines. They use precise metrics:
Standardized Unexpected Earnings (SUE)
(Actual EPS – Expected EPS) / Standard deviation of EPS estimates
Revenue Surprise
Often more important in growth stocks
Margin Surprise
Indicates pricing power and cost control
Large positive SUE values tend to produce stronger post-earnings drift.
Behavioral Finance Angle
Earnings surprise strategies work because humans are involved.
Common biases:
Anchoring: Investors stick to old price targets
Confirmation bias: Ignoring bad news for favorite stocks
Overconfidence: Analysts slow to admit forecast errors
Herd behavior: Institutions wait for consensus before acting
These biases delay price adjustment, allowing alpha to persist.
Role of Options and Volatility
Earnings announcements are volatility events.
Before earnings:
Implied volatility rises
Options become expensive
After earnings:
Volatility collapses (IV crush)
Advanced alpha strategies:
Buy stock + sell expensive options
Trade post-earnings directional moves once uncertainty clears
Use straddles/strangles when surprise magnitude is expected to be large
Options markets often reveal expectations, helping traders anticipate surprise risk.
Risks in Earnings Surprise Trading
This strategy is powerful—but not easy money.
Key risks:
False breakouts after earnings
One-time gains masking weak core business
Market-wide risk-off events overpowering company results
Liquidity traps in small-cap stocks
Earnings surprises work best when:
Market trend supports the trade
Liquidity is strong
Risk management is strict
Stop losses and position sizing are non-negotiable.
Earnings Surprises in Emerging Markets (India Context)
In markets like India:
Information asymmetry is higher
Analyst coverage varies widely
Retail participation increases volatility
This actually enhances earnings surprise alpha, especially in mid-cap and small-cap stocks.
However:
Corporate governance risk must be filtered
One-off accounting gains should be excluded
Promoter commentary carries outsized influence
Smart traders combine earnings data with balance-sheet quality and cash-flow analysis.
Building a Sustainable Alpha Model
A robust earnings surprise alpha framework includes:
Clean earnings data
Analyst expectation tracking
Surprise magnitude ranking
Volume and price confirmation
Risk filters (market trend, sector strength)
Alpha is not captured from one trade—it’s harvested over many disciplined repetitions.
Final Thoughts
Alpha capture through earnings surprises works because markets are human systems, not perfect machines. Even with advanced algorithms and instant news, information takes time to be fully absorbed, interpreted, and acted upon.
Earnings surprises sit at the intersection of:
Fundamental truth
Market expectations
Human psychology
For traders and investors who respect data, manage risk, and understand behavior, earnings season is not chaos—it’s opportunity.

Financial Freedom Through Euro–Dollar DynamicsThe Euro–Dollar Relationship: A Global Financial Barometer
The EUR/USD pair represents the exchange rate between the euro (used by the Eurozone) and the U.S. dollar (the world’s primary reserve currency). Together, these two economies account for a significant share of global GDP, trade, and investment flows. As a result, EUR/USD reflects more than currency strength—it mirrors global economic confidence, monetary policy divergence, and geopolitical stability.
When the U.S. economy outperforms Europe, capital flows toward dollar-denominated assets, strengthening the USD and pushing EUR/USD lower. Conversely, when the Eurozone shows resilience or the Federal Reserve adopts a dovish stance, the euro strengthens. For individuals seeking financial freedom, understanding these shifts helps identify where money is moving—and how to position alongside it.
Interest Rates: The Core Driver of Currency Wealth
At the heart of Euro–Dollar dynamics lie interest rates, set by the European Central Bank (ECB) and the U.S. Federal Reserve (Fed). Interest rate differentials determine where global investors park their money.
Higher U.S. rates attract capital into U.S. bonds and equities, strengthening the dollar.
Higher European rates improve euro demand and reduce dollar dominance.
For traders, this creates long-term trends that can last months or even years. Riding these trends—rather than chasing short-term noise—can generate consistent returns. For investors, understanding rate cycles helps in allocating capital between U.S. stocks, European equities, bonds, and currency-hedged instruments.
Financial freedom is rarely built through random trades; it is built by aligning with long-duration macro trends, and interest rate policy is one of the most reliable trend drivers.
Inflation, Purchasing Power, and Real Wealth
Inflation erodes purchasing power, silently damaging long-term financial security. The Euro–Dollar dynamic reflects how well each region controls inflation relative to growth.
If U.S. inflation is high and the Fed lags in response, the dollar may weaken.
If Europe faces energy-driven inflation shocks, the euro may depreciate.
For individuals, this matters because currency value affects real wealth. Income earned in a weakening currency loses global purchasing power, while assets held in a stronger currency preserve or enhance wealth.
Many financially independent individuals diversify income streams across currencies—earning in one currency while investing in another. Understanding EUR/USD trends helps protect savings from inflation and currency depreciation, a crucial but often overlooked step toward financial freedom.
Trading EUR/USD as a Tool for Income Independence
The Euro–Dollar pair is the most liquid currency pair in the world. High liquidity means tighter spreads, lower transaction costs, and smoother price action—ideal conditions for traders aiming to build consistent income streams.
From a financial freedom perspective:
Day traders benefit from predictable volatility during London–New York overlap.
Swing traders exploit macro themes like rate hikes, inflation data, and policy guidance.
Position traders ride multi-month trends driven by monetary cycles.
Unlike equities, forex markets operate nearly 24 hours a day, allowing flexibility for those balancing trading with jobs or businesses. While trading carries risk, disciplined EUR/USD trading—supported by macro understanding—can evolve into a scalable income source, supporting location-independent lifestyles.
Euro–Dollar Dynamics and Global Asset Allocation
Financial freedom is not only about earning more—it’s about allocating capital wisely. EUR/USD movements influence global asset performance:
A strong dollar often pressures emerging markets and commodities.
A weak dollar supports risk assets, global equities, and alternative investments.
Euro strength benefits European exporters and regional stock indices.
By tracking Euro–Dollar trends, investors can adjust portfolios proactively—reducing drawdowns and enhancing long-term returns. This macro-aware allocation reduces reliance on any single market or economy, making wealth more resilient.
Psychological Freedom Through Macro Understanding
One underrated aspect of financial freedom is psychological stability. Many retail investors panic during volatility because they lack context. Understanding Euro–Dollar dynamics provides that context.
When markets move sharply after central bank meetings, inflation reports, or geopolitical events, informed individuals recognize these moves as part of larger cycles—not random chaos. This clarity reduces emotional decision-making, improves discipline, and builds confidence—key traits of financially independent thinkers.
Business, Remittances, and Cross-Border Opportunities
For entrepreneurs, freelancers, and international workers, EUR/USD impacts:
Export and import costs
Overseas earnings
Profit margins on global contracts
Those who understand currency dynamics can time conversions, hedge exposure, or price services strategically. Over time, these small optimizations compound into significant financial advantages—another pathway to independence beyond traditional employment.
Risks and Responsible Use of Currency Dynamics
While Euro–Dollar dynamics offer opportunities, financial freedom requires risk awareness. Leverage misuse, overtrading, and ignoring macro shifts can quickly destroy capital. True freedom comes from risk-adjusted growth, not reckless speculation.
Successful participants treat EUR/USD as a strategic tool—not a gamble—combining technical analysis, macro data, and strict risk management.
Conclusion: Aligning With Global Money Flow
Financial freedom in the modern world is no longer confined to saving salaries or investing locally. It is about understanding how global money moves—and positioning oneself accordingly. The Euro–Dollar dynamic stands at the center of this global system, reflecting interest rates, inflation, economic confidence, and political stability.
By mastering EUR/USD dynamics, individuals gain more than trading profits or investment returns. They gain insight, flexibility, and control over their financial destiny. Whether through trading, investing, currency diversification, or global business, aligning with Euro–Dollar trends can transform money from a source of stress into a tool for long-term independence.
In essence, financial freedom is not about predicting every market move—it is about understanding the forces that shape them. And few forces are as powerful, persistent, and revealing as the Euro–Dollar relationship.

Inter-Market Edge: Mastering Cross-Asset TradesWhat Is Inter-Market Analysis?
Inter-market analysis studies the relationships between major asset classes, primarily:
Equities (stocks and indices)
Bonds (interest rates and yields)
Commodities (energy, metals, agriculture)
Currencies (forex pairs)
Volatility instruments (like VIX)
The core idea is simple: capital constantly rotates between asset classes based on economic conditions, monetary policy, inflation expectations, and risk sentiment. By tracking where money is flowing before it fully shows up in your trading instrument, you gain early insight.
Why Cross-Asset Trading Matters
Single-asset traders often react late. Cross-asset traders anticipate.
Key benefits include:
Early trend detection
Bond yields or currencies often move before equities.
Signal confirmation
A stock market breakout supported by falling bond yields and a weak currency is more reliable.
False signal filtering
If equities rise but bonds and commodities disagree, caution is warranted.
Superior risk management
Inter-market divergence frequently warns of trend exhaustion or reversals.
Broader opportunity set
When one market is range-bound, another may be trending strongly.
Core Inter-Market Relationships
To master cross-asset trades, traders must understand some foundational relationships.
1. Stocks and Bonds: The Risk Barometer
Rising bond prices (falling yields) usually indicate risk aversion.
Falling bond prices (rising yields) often signal economic optimism or inflation concerns.
Classic relationship
Stocks ↑ → Bonds ↓ (risk-on)
Stocks ↓ → Bonds ↑ (risk-off)
Trading edge
If bond yields start rising before equities rally, it often signals an upcoming stock market breakout. Conversely, falling yields during a stock rally can warn of weakness ahead.
2. Interest Rates and Equities
Central bank policy sits at the heart of inter-market analysis.
Low or falling rates support equity valuations and growth stocks.
Rising rates pressure high-valuation stocks, especially technology and small caps.
Cross-asset insight
Rate-sensitive sectors (banking, real estate, utilities) often move before broader indices. Watching rate futures can provide early sector rotation signals.
3. Currencies and Risk Sentiment
Currencies are not just exchange tools; they are risk indicators.
Safe-haven currencies: USD, JPY, CHF
Risk currencies: AUD, NZD, emerging market currencies
Key dynamics
Strong USD often pressures commodities and emerging market equities.
Weak domestic currency can boost exporters but increase inflation risk.
Trading edge
A strengthening USD alongside falling equities often confirms a risk-off environment. Conversely, a weakening USD with rising commodities supports a global risk-on trade.
4. Commodities and Inflation Expectations
Commodities reflect real-world demand and inflation trends.
Crude oil influences inflation, transport, and emerging markets.
Gold reflects real yields, inflation fears, and currency confidence.
Industrial metals signal economic growth.
Inter-market signal
Rising commodities with rising bond yields often indicate inflationary pressure, which can eventually hurt equity valuations.
5. Gold, Dollar, and Real Yields
Gold deserves special attention in cross-asset trading.
Gold rises when real yields fall.
Gold weakens when real yields rise, even if inflation is high.
Edge for traders
If gold rallies while equities rise and the dollar weakens, it often signals excess liquidity. If gold rises while equities fall, it reflects fear and capital preservation.
Volatility as a Cross-Asset Tool
Volatility indices, especially equity volatility, act as early warning systems.
Rising volatility during a price rally signals distribution.
Falling volatility during consolidation supports trend continuation.
Cross-asset traders watch volatility alongside bonds and currencies to judge whether risk appetite is genuine or fragile.
Practical Cross-Asset Trading Strategies
1. Confirmation Strategy
Before entering a trade, ask:
Do bonds agree?
Does the currency support the move?
Are commodities aligned with the macro narrative?
Example:
A stock index breakout supported by falling volatility and stable bond yields has higher probability.
2. Lead-Lag Strategy
Some markets move earlier than others:
Bonds often lead equities.
Currencies often lead commodities.
Commodities often lead inflation data.
Traders can position early in the lagging market once the leading market signals a shift.
3. Relative Strength Across Assets
Instead of predicting direction, compare strength between asset classes:
Equities vs bonds
Growth stocks vs value stocks
Commodities vs currencies
This helps identify capital rotation rather than guessing tops and bottoms.
4. Risk-On / Risk-Off Framework
Create a simple checklist:
Stocks ↑, yields ↑, volatility ↓ → Risk-on
Stocks ↓, yields ↓, volatility ↑ → Risk-off
Trading in alignment with the prevailing regime dramatically improves consistency.
Common Mistakes in Inter-Market Trading
Over-correlation bias: Relationships change over time.
Ignoring timeframes: Short-term trades may not follow long-term inter-market trends.
Confirmation paralysis: Waiting for every asset to align can lead to missed trades.
Macro blindness: News, policy, and global events matter in cross-asset trading.
Building the Inter-Market Mindset
Mastering cross-asset trades is less about predicting prices and more about understanding flows. Successful inter-market traders think like capital allocators, not just chart readers. They ask:
Where is money coming from?
Where is it going?
What fear or optimism is driving that movement?
By integrating equities, bonds, currencies, commodities, and volatility into one analytical framework, traders gain clarity in noisy markets.
Conclusion
The inter-market edge transforms trading from isolated decision-making into strategic positioning. In a world driven by global liquidity, central banks, inflation cycles, and geopolitical shifts, cross-asset awareness is no longer optional—it is essential.
Traders who master inter-market analysis don’t just react to price; they anticipate behavior, align with capital flows, and trade with context. That context is the real edge—quiet, powerful, and consistently profitable when applied with discipline.
If you want, I can also break this into headings for a blog, PDF notes, or turn it into a trading framework with examples from Indian markets 📈

The Commodity Super Cycle: Gold & Crude Oil in Focus1. Understanding the Commodity Super Cycle
A commodity super cycle refers to a long-term (10–30 years) period of rising commodity prices, driven by structural changes in the global economy rather than short-term speculation. Unlike normal commodity cycles, super cycles are fueled by massive demand shifts, supply constraints, geopolitical realignments, and monetary policy trends.
Historically, super cycles have emerged during periods of industrialization, reconstruction, or major technological change—such as post-World War II rebuilding or China’s rapid growth in the early 2000s. Today, the world appears to be entering a new super cycle, shaped by energy transition, geopolitical fragmentation, inflationary pressures, and rising global debt. In this environment, Gold and Crude Oil stand at the center of the narrative.
2. Why Gold and Crude Oil Matter in a Super Cycle
Gold and crude oil are not just commodities; they are macro indicators.
Gold reflects monetary stability, inflation expectations, currency confidence, and geopolitical risk.
Crude Oil reflects economic growth, energy security, industrial activity, and geopolitical power.
Together, they act as barometers of global stress and expansion. When both trend higher over a sustained period, it often signals deep structural shifts in the global economy.
3. Gold: The Monetary Anchor of the Super Cycle
Gold has always played a unique role as a store of value and hedge against uncertainty. In the current cycle, gold’s importance has increased due to several converging factors.
a) Inflation and Monetary Expansion
Following years of aggressive money printing by central banks, global economies are grappling with persistent inflation. Even when inflation moderates, real interest rates often remain negative, which historically supports higher gold prices. Investors turn to gold to preserve purchasing power when fiat currencies weaken.
b) Central Bank Accumulation
One of the strongest structural drivers for gold is record central bank buying, especially by emerging economies like China, India, Russia, and Middle Eastern nations. These countries are actively diversifying away from the US dollar, increasing gold reserves as a neutral, non-sanctionable asset.
c) Geopolitical Risk and De-Dollarization
Rising geopolitical tensions, sanctions, trade wars, and regional conflicts have reinforced gold’s role as a safe-haven asset. In a fragmented world economy, gold acts as financial insurance, increasing its long-term demand.
d) Supply Constraints
Gold mining faces challenges such as declining ore grades, rising extraction costs, environmental regulations, and limited new discoveries. This supply rigidity, combined with rising demand, strengthens gold’s super-cycle potential.
4. Crude Oil: The Energy Engine of the Super Cycle
Crude oil remains the lifeblood of the global economy, despite the push toward renewable energy. In a super cycle, oil prices are shaped by structural supply-demand imbalances rather than short-term shocks.
a) Chronic Underinvestment in Supply
Over the past decade, oil companies have reduced capital expenditure due to ESG pressures, price volatility, and energy transition narratives. This has led to insufficient investment in exploration and production, making supply less responsive to rising demand.
b) Geopolitical Supply Risks
Oil supply is highly sensitive to geopolitics. Sanctions on major producers, conflicts in the Middle East, OPEC+ production controls, and strategic reserve policies all contribute to structural tightness in oil markets.
c) Resilient Global Demand
Despite electric vehicle adoption and renewable energy growth, oil demand continues to rise, especially in emerging markets. Transportation, aviation, petrochemicals, and industrial sectors still depend heavily on crude oil, making demand more inelastic than often assumed.
d) Inflation Feedback Loop
Rising oil prices feed directly into transportation costs, manufacturing, and food prices, reinforcing inflation. This creates a self-sustaining cycle where higher energy prices support the broader commodity complex.
5. Gold vs Crude Oil: Correlation and Divergence
While both benefit from a super cycle, gold and crude oil behave differently:
Gold thrives during economic uncertainty, currency weakness, and falling real yields.
Crude oil thrives during economic expansion, supply disruptions, and inflationary growth.
Periods when both rise together typically signal stagflationary conditions—slow growth with high inflation. Such environments are particularly challenging for traditional equity and bond portfolios, increasing the appeal of commodities.
6. Investment and Trading Implications
The commodity super cycle reshapes portfolio construction and trading strategies.
a) Portfolio Hedging
Gold acts as a hedge against inflation, currency depreciation, and systemic risk, while oil provides exposure to global growth and energy scarcity. Together, they enhance portfolio resilience.
b) Equity Market Impact
Rising gold prices support mining stocks, while higher crude oil prices benefit energy producers, refiners, and oil-service companies. However, energy-intensive industries may face margin pressure.
c) Trading Volatility
Both commodities offer high volatility, making them attractive for futures, options, and swing trading. Super cycles often feature sharp corrections within a long-term uptrend, rewarding disciplined traders.
7. Risks to the Super Cycle Thesis
No super cycle is without risks. Key threats include:
A sharp global recession reducing demand
Rapid technological breakthroughs reducing oil dependency
Aggressive monetary tightening strengthening the US dollar
Policy interventions such as price caps or windfall taxes
However, these factors often cause temporary pullbacks rather than structural trend reversals.
8. The Road Ahead
The current global landscape—marked by inflationary pressures, geopolitical realignment, energy insecurity, and rising debt—creates fertile ground for a commodity super cycle. Gold and crude oil stand at the core of this transformation.
Gold represents trust, stability, and monetary insurance, while crude oil represents power, growth, and energy dominance. Together, they reflect a world transitioning from decades of deflationary stability to a more volatile, inflation-prone regime.
Conclusion
The commodity super cycle is not just about price appreciation; it is about structural change in how the global economy functions. Gold and crude oil are the twin pillars of this shift—one anchoring monetary confidence, the other driving industrial momentum. For investors and traders who understand their dynamics, this cycle offers long-term opportunity alongside short-term volatility.
In a world of uncertainty, commodities are no longer optional—they are essential.
