Long Idea: Balkrishna Industries LTD Balkrishna Industries Ltd (BALKRISIND) successfully executed a significant breakout from a long-term descending parallel channel on February 3, 2026. The breakout was characterized by a massive 11.63% gap-up at the market open and was confirmed by a multi-fold surge in trading volume to 2.32 million shares, well above its typical average. This volume-backed move signalised strong institutional participation, effectively reclaiming all major moving averages, including the 200-day DMA.
Bullish Reversal: The stock recently broke a five-day losing streak with a significant gap-up.
India-US Trade Tailwinds: A landmark India-US trade deal is expected to directly benefit BALKRISIND, with its 14% US revenue exposure poised for growth following tariff reductions.
Domestic Infrastructure Push: The Union Budget 2026 increased public capital expenditure to ₹12.2 lakh crore, directly fueling demand for the company's core off-highway tires (OTR) in construction and mining.
Strategic Expansion: The company is expanding its Carbon Black capacity to 360,000 MTPA and is on track to launch Commercial Vehicle (CV) Radial tires in Q4 FY26.
The combination of a high volume channel breakout and structural tailwinds from the Union Budget 2026 makes BALKRISIND a high-conviction "Buy on Dips" candidate.
Entry Range: ₹2,570 – ₹2,590
Note: After the massive 11.63% gap-up on February 3, the stock is currently consolidating.
Entering near the current market price (CMP) or on minor intraday pullbacks is ideal to capture the next leg of the rally.
Stop Loss (SL): ₹2,380 (On a Daily Closing Basis)
Rationale: This level sits just below the 200-day DMA and the upper boundary of the broken descending channel. A slide below this would invalidate the breakout and suggest a "bull trap."
Target 1 (Short-term): ₹2,750
Rationale: This aligns with the recent intraday high and psychological resistance.
Target 2 (Medium-term): ₹2,920
Rationale: Based on the measured move projection of the parallel channel height, targeting the 2025 swing highs.
Risk-to-Reward Ratio: Approximately 1:1.7 at current levels, improving to 1:2.5 if entry is secured closer to ₹2,530.
X-indicator

USDJPY Pullback Explained: Trend Support in Focus!For me, USDJPY is still behaving like a healthy uptrend, not a market that is rolling over. Price has been respecting a clear rising channel structure, with buyers consistently defending higher lows.
The recent move lower looks more like a pullback into major trend support rather than a sign of weakness. This is exactly how strong trends usually behave, they pause, retrace, and then decide the next leg based on support reaction.
From a broader perspective:
On the fundamental side, currencies are currently adjusting to shifting rate expectations and global risk sentiment. In such phases, trends rarely reverse immediately. Instead, price often retraces into key levels before continuing or changing structure.
What I’m watching now:
As long as the rising channel and demand zone hold, the overall structure remains intact. The next move will largely depend on how price reacts at this support, not on short-term volatility.
This is not a trade call, it’s an observation of market behavior and structure.
Disclaimer: This analysis is for educational purposes only and does not constitute financial advice. Trading involves risk.

XAUUSD – H2 Technical AnalysisXAUUSD – H2 Technical Outlook: Bullish Structure Rebuild as Precious Metals Surge | Lana ✨
Precious metals are back in focus as silver surges sharply, adding momentum to the broader metals complex. In this context, gold is showing signs of structure rebuilding after a healthy correction, setting the stage for potential continuation.
📈 Market Structure & Technical Context
After a strong impulsive drop, gold successfully defended the 4,420–4,450 strong support zone, where buyers stepped in decisively. Since then, price has been forming higher lows along an ascending trendline, signalling a shift from distribution into recovery.
The current price action suggests this move is corrective-to-bullish, not just a short-lived bounce.
🔍 Key Levels to Watch
Strong Support: 4,420 – 4,450
This zone remains the structural base. As long as price holds above it, bullish scenarios stay valid.
Mid Resistance / Reaction Zone: ~5,050 – 5,080
Price is currently consolidating here, absorbing supply after the rebound.
Next Resistance: ~5,135
A clean break and acceptance above this level would confirm continuation strength.
Upper Targets: ~5,300 – 5,350
Aligned with Fibonacci extensions and prior supply zones.
Higher Objective: ~5,580
Only in play if bullish momentum accelerates across the metals market.
🎯 Bullish Scenarios
If gold continues to respect the upper trendline and holds above the 5,000 psychological level:
A brief pullback into 5,000–5,050 could offer structure for continuation.
Acceptance above 5,135 opens the path toward 5,300+.
Strong momentum, supported by silver’s breakout, could extend moves toward 5,580.
Any pullbacks toward support are currently viewed as constructive corrections, not weakness.
🌍 Intermarket Insight
Silver’s sharp rally highlights renewed demand across precious metals, often acting as a leading signal for broader sector strength. This backdrop supports the idea that gold’s recent correction was a reset, not a reversal.
🧠 Lana’s View
Gold is rebuilding its bullish structure step by step. The focus is not on chasing price, but on how price reacts at key levels. As long as structure and momentum remain aligned, the broader trend stays constructive.
✨ Stay patient, respect the zones, and let the market confirm the next expansion.

Dollar Strength and Weakness in Trading MarketsUnderstanding the U.S. Dollar in Financial Markets
The U.S. dollar (USD) is the world’s primary reserve currency and plays a central role in global trade, finance, and investment. Its strength or weakness affects everything from international trade balances to commodity prices, equity markets, and currency pairs. In trading, understanding dollar movements is crucial because it impacts risk, profitability, and strategy across multiple asset classes.
What Does Dollar Strength Mean?
A strong dollar occurs when the USD appreciates relative to other currencies. In forex markets, this means it takes fewer dollars to buy another currency, such as the euro, yen, or pound. Strength in the dollar is typically reflected in major indices like the U.S. Dollar Index (DXY), which measures the dollar against a basket of six major currencies.
Key factors driving dollar strength include:
U.S. Interest Rates: Higher interest rates attract foreign capital, as investors seek better yields on U.S. assets. The Federal Reserve’s monetary policy plays a pivotal role; rate hikes often result in dollar appreciation.
Economic Data: Strong GDP growth, low unemployment, and robust manufacturing or services output boost confidence in the U.S. economy, strengthening the dollar.
Global Risk Aversion: During times of global uncertainty or crisis, investors flock to safe-haven assets. The U.S. dollar is considered the ultimate safe-haven currency, leading to demand-driven strength.
Trade Balance: A declining U.S. trade deficit can signal a stronger economy and support the dollar, though this is more complex when compared to other influencing factors.
Fiscal Policy: Government spending, tax policies, and debt levels influence investor perception of U.S. economic stability. Responsible fiscal policies tend to support the currency.
Implications of a Strong Dollar:
Forex Trading: Currencies like the euro, yen, or emerging market currencies tend to weaken when the dollar strengthens. Traders may short these currencies against the dollar.
Commodities: Most commodities, such as gold, oil, and silver, are priced in dollars. A strong dollar makes them more expensive for non-U.S. buyers, often leading to lower commodity prices.
Global Markets: U.S. exports become more expensive, potentially impacting multinational companies’ revenues. Conversely, imports become cheaper.
Emerging Markets: Countries with debt denominated in USD face higher repayment costs, potentially creating financial stress and affecting currency stability.
What Does Dollar Weakness Mean?
A weak dollar occurs when the USD depreciates relative to other currencies. It takes more dollars to purchase foreign currencies. Dollar weakness often benefits commodities and global trade but can signal economic or monetary policy issues domestically.
Key factors driving dollar weakness include:
Lower Interest Rates: When U.S. rates fall relative to other economies, investors may move capital abroad seeking higher yields.
Economic Slowdown: Weak economic data, rising unemployment, or declining manufacturing output can reduce confidence in the USD.
Inflation Concerns: Persistent inflation erodes the purchasing power of the dollar, contributing to its weakness.
Fiscal Deficits: Expanding government debt without strong economic growth can undermine investor confidence in the currency.
Global Liquidity Needs: Central banks may inject liquidity into the market or devalue currencies to boost exports, indirectly weakening the dollar if the USD is compared to those currencies.
Implications of a Weak Dollar:
Forex Trading: Other currencies appreciate against the dollar. Traders may go long on EUR/USD, GBP/USD, or AUD/USD.
Commodities: Commodity prices often rise as a weak dollar makes them cheaper for non-U.S. buyers. Gold, oil, and agricultural products often benefit.
U.S. Exports: A weaker dollar makes U.S. goods more competitive abroad, potentially boosting corporate profits for exporters.
Emerging Markets: Dollar-denominated debt becomes easier to service for emerging economies, which can stabilize financial conditions.
Measuring Dollar Strength and Weakness
Traders use various tools to track the dollar:
U.S. Dollar Index (DXY): A weighted index of the dollar against six major currencies (EUR, JPY, GBP, CAD, SEK, CHF). A rising DXY indicates strength; a falling DXY indicates weakness.
Forex Pairs: Monitoring pairs like EUR/USD, GBP/USD, USD/JPY, and USD/CHF gives traders insight into relative strength or weakness.
Commodity Prices: Inversely, commodities like gold and oil can act as indirect indicators of dollar strength.
Interest Rate Differentials: Comparing U.S. rates with other countries’ central banks helps traders anticipate dollar movements.
Economic Indicators: GDP, employment data, inflation, and consumer confidence provide signals for potential currency shifts.
Trading Strategies Based on Dollar Strength/Weakness
1. Forex Trading:
Strength: Shorting other currencies against USD (e.g., EUR/USD, GBP/USD) to capitalize on appreciation.
Weakness: Going long on foreign currencies against USD to benefit from depreciation.
2. Commodity Trading:
Strength: Caution on commodities as prices may drop due to a strong USD.
Weakness: Consider buying commodities or commodity ETFs as a hedge or profit strategy.
3. Stock Market Implications:
Strength: U.S. multinational companies may face export headwinds; domestic-focused companies may benefit from lower import costs.
Weakness: Exporters gain competitiveness abroad, boosting earnings potential.
4. Emerging Market Trading:
Strength: Monitor for potential stress in countries with USD debt. Currency carry trades may be riskier.
Weakness: Investors may enter emerging market equities and bonds, as debt servicing costs decrease.
Interconnectedness with Global Markets
The dollar does not exist in isolation. Its movement impacts global capital flows:
Capital Flows: A strong dollar attracts investment in U.S. treasuries and equities, while a weak dollar can encourage global investment elsewhere.
Interest Rate Arbitrage: Traders exploit differences in rates between countries, magnifying dollar movements.
Geopolitical Risks: Crises or conflicts often trigger a flight to the dollar, temporarily boosting its value.
Conclusion
Understanding dollar strength and weakness is vital for traders across forex, commodities, equities, and emerging markets. A strong dollar can depress commodities, pressure global exporters, and stress emerging markets. Conversely, a weak dollar can lift commodity prices, enhance U.S. export competitiveness, and reduce debt servicing burdens abroad.
For traders, tracking economic indicators, interest rate differentials, and geopolitical events is essential for predicting dollar movements. Effective strategies require adapting to the dollar’s direction, whether through currency trading, hedging commodities, or evaluating global equity exposure.
In essence, the dollar’s strength or weakness is not just a number on a chart—it reflects the global balance of trade, capital flows, and investor confidence, making it one of the most influential variables in the financial markets.

Stock Market Trading (Equities)Introduction
Stock market trading, often referred to as equity trading, is the buying and selling of shares of publicly listed companies through a regulated marketplace known as a stock exchange. Equities represent ownership in a company, and shareholders are entitled to a portion of the company's profits in the form of dividends and capital gains. Stock trading serves as a fundamental component of financial markets, providing liquidity, capital formation, and investment opportunities for individuals, institutions, and corporations alike.
The stock market is often perceived as a barometer of the economy, reflecting investor sentiment, corporate performance, and broader macroeconomic trends. Trading in equities is both an art and a science, combining analytical rigor, strategy, and psychological discipline.
Key Participants in Stock Market Trading
Retail Investors: Individual traders who buy and sell stocks for personal investment or short-term trading profits. Retail investors account for a significant portion of trading volume in major stock exchanges.
Institutional Investors: Entities such as mutual funds, hedge funds, insurance companies, and pension funds that invest large sums of money in equities. Their trades can significantly impact stock prices due to the size of their transactions.
Market Makers & Brokers: Market makers provide liquidity by quoting both buy and sell prices, facilitating smoother trading. Brokers act as intermediaries between investors and the exchange, executing orders on behalf of clients.
Regulators: Regulatory authorities like the Securities and Exchange Board of India (SEBI) in India or the U.S. Securities and Exchange Commission (SEC) ensure fair practices, transparency, and protection for investors.
Types of Equity Trading
Equity trading can broadly be categorized into long-term investing and short-term trading, each with distinct objectives and strategies.
Long-Term Investing:
Investors hold stocks for an extended period, usually years, aiming to benefit from dividends and capital appreciation. This strategy is based on fundamental analysis, which evaluates a company's financial health, growth potential, and market position. Long-term investors are less concerned with short-term price fluctuations and focus on the company's intrinsic value.
Short-Term Trading:
Traders aim to profit from price volatility within short periods, ranging from seconds (high-frequency trading) to days or weeks. This category includes:
Day Trading: Buying and selling stocks within the same trading session.
Swing Trading: Holding stocks for several days or weeks to capture intermediate-term trends.
Scalping: Executing multiple trades in a day to profit from small price movements.
Fundamental Analysis
Fundamental analysis involves evaluating a company's underlying financial health and growth potential to estimate its intrinsic value. Key aspects include:
Financial Statements:
Income Statement: Evaluates profitability through revenue, expenses, and net profit.
Balance Sheet: Assesses the company's assets, liabilities, and equity.
Cash Flow Statement: Analyzes liquidity and operational efficiency.
Ratios & Metrics:
Price-to-Earnings (P/E) Ratio: Measures stock valuation relative to earnings.
Return on Equity (ROE): Indicates profitability for shareholders.
Debt-to-Equity Ratio: Shows financial leverage and risk.
Macro & Industry Analysis:
Economic indicators like GDP growth, interest rates, and inflation impact stock performance.
Industry trends, competitive landscape, and regulatory policies influence individual company prospects.
Fundamental analysis is particularly favored by long-term investors seeking stable returns based on sound business fundamentals.
Technical Analysis
Technical analysis focuses on stock price movements and trading volume to predict future price trends. Traders use historical data and chart patterns to identify entry and exit points. Key tools include:
Charts: Line charts, candlestick charts, and bar charts provide visual representations of price movements.
Indicators:
Moving Averages: Identify trends by smoothing out price fluctuations.
Relative Strength Index (RSI): Measures overbought or oversold conditions.
MACD (Moving Average Convergence Divergence): Helps detect trend reversals.
Patterns: Head-and-shoulders, double tops/bottoms, and trendlines are common patterns used to anticipate price behavior.
Technical analysis is commonly applied by short-term traders and those seeking to exploit market psychology and price momentum.
Stock Market Orders
Traders and investors execute trades through different types of orders:
Market Order: Executes immediately at the current market price.
Limit Order: Executes only at a specified price or better.
Stop-Loss Order: Automatically sells a stock when it reaches a predetermined price to limit losses.
Stop-Limit Order: Combines stop-loss and limit orders for controlled execution.
Choosing the right type of order is crucial for managing risk and optimizing profits.
Risk Management in Equity Trading
Equity trading carries inherent risks, including market risk, company-specific risk, and liquidity risk. Effective risk management strategies include:
Diversification: Spreading investments across sectors, industries, and asset classes to reduce exposure to a single stock.
Position Sizing: Allocating a fixed portion of capital to each trade based on risk tolerance.
Stop-Loss Strategies: Limiting losses by setting predefined exit points.
Hedging: Using derivatives like options and futures to protect against adverse price movements.
Risk management is essential to survive in volatile markets and preserve capital.
Stock Market Strategies
Traders and investors employ various strategies depending on their objectives:
Value Investing: Buying undervalued stocks with strong fundamentals, aiming for long-term growth.
Growth Investing: Focusing on companies with high growth potential, even if currently overvalued.
Momentum Trading: Capitalizing on strong trends, buying rising stocks and selling before a reversal.
Dividend Investing: Targeting stocks that provide regular income through dividends.
Algorithmic Trading: Using automated systems and algorithms to execute trades at high speed and efficiency.
Behavioral Aspects of Trading
Psychology plays a crucial role in stock trading. Emotional biases such as fear, greed, overconfidence, and herd mentality can impact decision-making. Successful traders cultivate discipline, patience, and emotional control to make rational decisions.
Regulation and Compliance
Stock markets operate under strict regulations to ensure transparency and investor protection. Key regulatory practices include:
Listing Requirements: Companies must meet financial and disclosure standards to be listed on exchanges.
Insider Trading Regulations: Prevent individuals with non-public information from exploiting unfair advantages.
Market Surveillance: Exchanges monitor trading activity to detect manipulation and fraud.
Disclosure Norms: Companies must regularly disclose financial results, material events, and corporate governance practices.
In India, SEBI oversees the functioning of stock exchanges, brokers, and listed companies to maintain a fair and efficient market.
Technological Impact
Modern equity trading is heavily technology-driven. Online trading platforms, mobile apps, and algorithmic trading systems have democratized access, enabling retail investors to participate with ease. Artificial intelligence, machine learning, and data analytics are increasingly used to identify patterns, forecast trends, and automate trading strategies.
Conclusion
Stock market trading in equities is a dynamic and multifaceted activity, offering opportunities for wealth creation and capital growth. Success in trading requires a blend of analytical skills, strategic planning, risk management, and psychological discipline. Understanding fundamental and technical factors, along with macroeconomic and behavioral elements, equips traders and investors to navigate market volatility effectively.
While trading involves risks, disciplined approaches, continuous learning, and adherence to regulatory norms can significantly enhance the probability of long-term success. Whether one aims for long-term investment growth or short-term trading profits, equities remain a cornerstone of financial markets, providing avenues for participation in the wealth generated by companies and economies.
In essence, stock market trading is not merely about buying low and selling high; it is an intricate process of research, analysis, timing, and emotional control, offering immense learning opportunities and financial rewards for those who approach it with knowledge, patience, and strategy.

XAUUSD (H3) – Liam PlanXAUUSD (H3) – Liam Plan
Safe-haven bid is back, but structure is still corrective | Trade the zones, not the headlines
Quick summary
Gold is up for a second day as US–Iran tensions revive safe-haven demand. At the same time, expectations for Fed rate cuts keep the USD on the defensive, which typically supports non-yielding assets like gold. However, with ADP and ISM Services PMI ahead, short-term volatility can spike fast — and that’s exactly where gold tends to run liquidity before choosing direction.
My approach: respect the macro tailwind, but execute based on structure.
Macro context
Gold usually benefits when:
geopolitical risk rises (risk-off flows),
rate-cut expectations increase (lower real yields),
the USD weakens or struggles to sustain a bounce.
That said, pre-data sessions often produce fake moves. The market will likely “test” both sides before committing.
Technical view (H3 – based on the chart)
Price rebounded sharply from the recent low, but the overall swing structure is still in a correction / rebalancing phase after a major impulse down.
Key zones on the chart:
Major supply / premium target: 5570 – 5580 This is the clear “sell reaction” zone if price expands higher.
Current decision area: around 5050 – 5100 Price is pushing back into a key mid-range level — where continuation must prove acceptance.
Deep demand / liquidity base: 4408, then 4329 If the market fails to hold higher supports, these are the next magnets for sell-side liquidity.
This is a classic: bounce → retest → decide environment.
Trading scenarios (Liam style: trade the level) Scenario A: Continuation bounce
If price holds above the current base and continues to reclaim levels:
Upside rotation can extend toward 5200 → 5400 → 5570–5580
Expect reactions near each resistance band, especially approaching premium.
Logic: safe-haven flows + softer USD can fuel continuation, but only if price accepts above the mid-range.
Scenario B: Rejection and rotation lower
If price fails to hold above 5050–5100 and prints rejection:
Expect a pullback back into prior demand
Deeper continuation opens toward 4408, then 4329
Logic: corrective rallies often redistribute before the next leg lower, especially around major data.
Execution notes
With ADP + ISM ahead, avoid chasing candles.
Wait for price to tag the zone and show a clear reaction.
Trade smaller if spreads widen.
My focus: If price accepts above the mid-range, I’ll respect the bounce. If it rejects, I’ll treat the move as a corrective rally and look for rotation lower. Either way, I’m trading levels — not headlines.
— Liam

Nifty 50 : The “Trump–Modi” Rally Meets Budget Reality 🇮🇳🇺🇸Right now, the Indian market feels like it’s standing at a very interesting crossroads — both technically and fundamentally. After the wild start to February 2026, what we’re seeing looks more like a relief rally trying to fight against stretched valuations.
From Budget Shock to Trade Deal Pop
Just a few days back, sentiment was terrible.
The Union Budget’s surprise hike in STT on Futures and Options (0.05% and 0.15%) caught traders completely off guard. That one move alone wiped out nearly ₹10 lakh crore in market cap in a single session. The market was in full panic mode.
But then came the twist.
The “Trump–Modi” trade deal on Feb 2 flipped the script overnight.
The U.S. cut reciprocal tariffs on Indian goods from a brutal 50% to 18%, and in return, India agreed to shift energy imports toward the U.S., committing nearly $500 billion in energy and tech deals.
That was enough to light a fire under the market. Nifty responded with one of its strongest single-day moves, jumping 2.55% and reclaiming the 25,700 zone. Pure relief rally.
But I’m Not Chasing This Move Yet
Even with all the excitement, I don’t think this is the time to blindly chase green candles.
The chart still suggests we might need some time-wise consolidation before any serious attempt at new all-time highs.
Key points of concern :
IT is dragging badly. While textiles and gems are flying, Nifty IT is down almost 5% thanks to H-1B fee hikes and weakness in U.S. tech. That’s a heavy index weight to ignore.
Valuations are stretched. Without stronger earnings support, this rally could easily lose steam near the 26,000–26,100 supply zone.
RBI risk ahead. The Feb 6 MPC meeting is key. A rate cut is unlikely, but the tone matters. If the RBI isn’t dovish enough, sentiment can cool quickly.
My Take
For now, I’d rather stay patient.
This move still feels more like a relief bounce than the beginning of a clean, sustainable breakout. I’d rather see some stability and a proper base form before getting aggressive with fresh positions. We can even expect a move to fill the gap formed during the relief rally.
Right now, the moving averages are still in a bearish crossover, which tells me the broader structure hasn’t fully turned bullish yet. Ideally, I want to see the 20-day EMA cross back above the 50-day EMA and, more importantly, the index sustaining above those levels. That kind of strength would give more confidence that the bullish momentum is real and not just a short-term pullback rally.
Until that happens, it’s better to step back, stay patient, and reassess rather than forcing trades.
📢📢📢
If my perspective changes or if I gather additional fundamental data that influences my views, I will provide updates accordingly.
Thank you for following along with this journey, and I remain committed to sharing insights and updates as my trading strategy evolves. As always, please feel free to reach out with any questions or comments.
Other posts related to this particular position and scrip, if any, will be attached underneath. Do check those out too.
Disclaimer : The analysis shared here is for informational purposes only and should not be considered as financial advice. Trading in all markets carries inherent risks, and past performance is not indicative of future results. It’s essential to conduct your own research and assess your risk tolerance before making any investment decisions. The views expressed in this analysis are solely mine. It’s important to note that I am not a SEBI registered analyst, so the analysis provided does not constitute formal investment advice under SEBI regulations.

IIFL 1 Day Time Frame 📊 Daily Pivot & Key Levels (1‑Day Timeframe)
📍 Daily Pivot:
• ₹520.28 (reference level for bias)
📈 Resistance Levels:
• R1: ₹532.57 — first upside hurdle
• R2: ₹543.28 — next barrier above
• R3: ₹555.57 — extended resistance zone
📉 Support Levels:
• S1: ₹509.57 — immediate support
• S2: ₹497.28 — next support zone
• S3: ₹486.57 — deeper support below
📌 How to Use These Levels Today
📈 Bullish view:
Break above ₹532.5 – ₹543.3 can open room toward ₹555+ for the day.
📉 Bearish view:
If price drops below ₹509.5, sellers could push toward ₹497 and then ₹486.5.
🟡 Pivot reaction:
Holding above the pivot ₹520.28 suggests bias toward upside today.
Falling below pivot suggests weakness intraday.
🔍 Note on Current Price Trend
Some data (delayed) shows moving averages and indicators near oversold, but pivot levels remain useful for intraday decisions.

Is Biocon forming base? cmp 372.80Stock Update - *Biocon cmp 372.80*
Biocon has undergone a healthy correction from recent highs andcurrently consolidating near a key demand zone, indicates base formation.
Technically current price holding above short term support
Support zone : 355 - 360
Immediate resistance: 390 - 400
Major resistance: 420
Price action suggests selling pressure is easing and stability near current levels can lead to a gradual upside move.
8% to 14% Upside Potential

NCC 1 Week Time Frame 📌 Latest Price Context (as of 3 Feb 2026)
Last traded price around ₹152–₹153 on NSE.
📊 1-Week Technical Levels
🔁 Immediate Resistance (Upside)
These are the levels where price may struggle to rise further within the next week:
₹155–₹157 → First resistance zone (short-term pivot R1/R2).
₹160–₹162 → Next barrier where selling pressure could appear.
₹160 is also cited as an immediate resistance by market analysts, above which short-term bullish momentum could improve.
Bullish Short-Term Trigger:
➡️ A clear close above ₹157–₹160 on daily charts may open the path for a rebound.
🔽 Immediate Support (Downside)
These are key levels where price might find buying interest this week:
₹150–₹150.2 → First support zone near S1.
₹147–₹145 → Next support cluster (S2/S3).
₹142–₹140 → Stronger support zone if price weakens; analysts cite ₹142 as important short-term floor.
Bearish Short-Term Trigger:
➡️ A clear break and close below ₹145–₹142 on daily charts may signal further weakness toward lower supports.
📉 Short-Term Technical Sentiment
Price is trading below key short-term moving averages (20/50 DMA), indicating bearish bias near term.
RSI remains subdued, suggesting limited upside momentum in the immediate term.
Analyst commentary highlights the stock being in a downtrend, with resistance overhead and volatility remaining elevated.
📌 1-Week Outlook Summary
Bullish Scenario (1W):
Holds above ₹150
Breaks and sustains above ₹155–₹160
➡️ Upside target in the week toward ₹160–₹162+
Neutral/Rangebound (1W):
Trades between ₹147–₹157
➡️ Sideways action likely in a tight range
Bearish Scenario (1W):
Breaks below ₹145–₹142
➡️ Further weakness toward ₹140 or lower

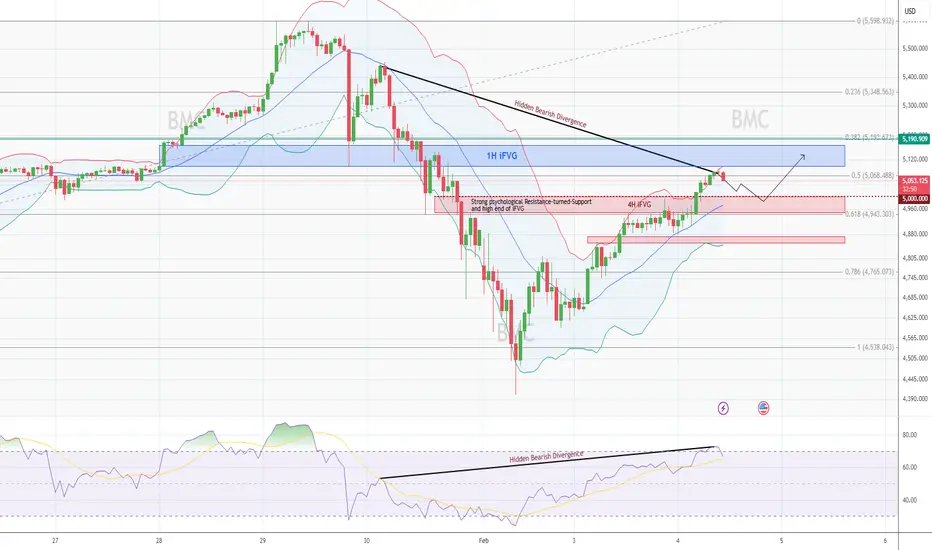
Gold Short Term AnalysisGold Analysis (1H Chart)
Gold rose more than 2.5% during the early Asian session on Wednesday, and made highs of 5081.25
Although to test the mentioned highs, it has exhausted much of its strength
The bullish price action is getting weak, forming smaller candles than previous, with falling volumes every next candle
And the prices have entered the overbought zone on the 1H chart:
- Prices are testing the upper Bollinger band
- RSI is also trending above 70 levels and turning
- A hidden bearish divergence could also be identified on the 1H chart
Projection
- Thus, a moderate downside correction cannot be neglected towards the marked red zone (5000-4950): The resistance turned support or iFVG
- After which prices might continue the bullish trend towards the blue zone (1H iFVG between 5100-5170).
OIL 1 Day Time Frame 📊 Current Approx Price (as per today data): ₹488.90 – ₹514.4 range (varies by platform/time) — OIL has recently traded around this area near daily pivot/major levels.
📈 Daily Pivot & Key Levels (Classic method)
Level Price (₹) Role
R3 (3rd Resistance) 507.45 Strong upside hurdle
R2 499.40 Secondary resistance
R1 491.35 Near-term resistance
Daily Pivot 483.30 Trend bias line
S1 (1st Support) 475.25 Immediate support
S2 467.20 Next downside cushion
S3 459.15 Major support zone
👉 Interpretation (1-day frame):
Price above pivot (~483-484) = bullish bias on the daily.
Near-term resistance cluster: ₹491–₹499–₹507 — watch breakout closes above these for continuation.
Downside support cluster: ₹475 → ₹467 → ₹459 — breakdown below these suggests short-term correction.
📊 Short Summary (Daily Momentum & Indicators)
Technical bias:
• RSI near bullish/neutral zone — showing positive momentum without being extremely overbought.
• MACD / ADX generally leaning bullish indicating trend strength at the moment.
Overall daily structure favors bullish to sideways — supports holding and resistance being tested.
🧠 How to use these levels (Daily)
📍 Bullish setup:
• If price stays above pivot ~483 and holds above R1 (~491) → next target R2 ~499 → R3 ~507.
📍 Bearish setup:
• If price falls below pivot ~483 and breaks S1 (~475) → move down to S2 (467) & potentially S3 (459).
📍 Key breakouts:
• Clear daily close above 507 → strong bull confirmation.
• Close below 459 → negates short-term bull view.

XAU/USD – Bullish Recovery From Demand Zone, Targeting Range 🔍 Technical Analysis (H1)
🟢 Market Structure
After a strong bearish move, Gold found solid support at the Extreme POI Demand Zone.
Price respected the pivot point, forming a clear higher low — an early sign of bullish recovery ✔️
Buyers stepped in aggressively from the demand zone, confirming institutional interest.
📦 POI & Key Zones
Extreme POI Point (Demand Zone): Strong rejection → base for reversal 🟩
High POI Point (Supply / Mitigation Zone): Current reaction area; price is consolidating above it.
Successful hold above this zone increases probability of continuation.
📈 Momentum & Price Action
Breakout from the minor bearish structure suggests trend shift to bullish.
Price is forming a bullish consolidation (flag / step pattern) before continuation.
As long as price stays above the High POI zone, bullish bias remains intact 💪
🎯 Targets
🎯 Primary Target:
5,050 – 5,100 (Range High / Liquidity Zone)
🎯 Extended Target (if momentum continues):
5,180 – 5,220
🛑 Invalidation Level:
Sustained close below 4,750 would weaken the bullish scenario.
✅ Conclusion
Gold is showing a healthy bullish recovery from a major demand zone. Holding above the High POI increases the probability of a move toward the range high target. Expect minor pullbacks before continuation — buy-the-dip structure 📊🚀

Analysis on GoldI see a complete W structure at 5120-5130 levels Gold is Bullish so enter at the levels where it will be pushed down to 5000-4950 levels
Expecting a fall till this Friday from the levels
Gold sell 5075-5100
Safe sell 5135-5120
Tp levels on the chart
Happy Trading

Gold flipped structure — real reversal or liquidity trap?Gold has just delivered a clear structural shift after weeks of heavy downside pressure — but this is not the time to chase.
Market Structure (M30)
Price printed a bullish CHoCH, ending the prior bearish sequence.
Followed by a BOS to the upside, confirming short-term bullish control.
Momentum is strong, but price is now approaching a key reaction zone.
Key Zones to Watch
FVG Support: ~4,950 – 4,980
→ Ideal area for pullback continuation if bullish structure holds.
Mid Resistance / Reaction: ~5,100 – 5,150
→ Expect volatility and possible shakeout.
Upper Target Zone: 5,270 – 5,450
→ Fibonacci 0.5 → 0.786 retracement of the prior sell-off.
Trading Scenarios
Bullish continuation:
Wait for pullback into FVG + higher low → continuation toward 5,27x → 5,45x.
Failure scenario:
Loss of FVG + M30 close back below ~4,95x → bullish structure invalid, range or reversal risk.
🧠 Trading Mind
This is a reaction market, not a prediction market.
After a structure flip, pullbacks pay — breakouts trap.

BIRLACORPN 1 Month View 📌 Current price range (recent NSE close): ~₹1,020–₹1,060 area over the past few weeks.
📊 Monthly Support & Resistance Zones (Key Levels)
🛑 Resistance Levels
Immediate Resistance: ~₹1,055–₹1,074
– This zone has shown repeated short-term highs around this range.
Next Upside Layer: ~₹1,085–₹1,110
– Price may face selling pressure if it approaches this zone.
Higher Level Breakout Target: ~₹1,220–₹1,250+
– Longer-term structure resistance from earlier higher levels in 2025.
🧱 Support Levels
Primary Support: ~₹1,017–₹1,031
– Near recent lows seen multiple times in late Jan/early Feb.
Secondary Support: ~₹1,000–₹989
– A psychologically important round number zone.
Lower Support: ~₹970 and below
– Weakness beyond this may lead to more downside.
📈 Trend & Momentum (1-Month)
Moving averages (20/50/100/200) are above current prices, indicating the recent trend is neutral to slightly bearish/sideways in the short term (price below short & mid MAs).
Oscillators like RSI are mid-range (not deeply oversold nor overbought), suggesting no strong immediate reversal signal.
TradingView technicals show the 1-month technical rating is currently on a sell bias, implying sellers dominate this timeframe.
📌 1-Month Price Action Summary
📉 Sideways / Mild Downtrend:
Price has traded mostly between ~₹1000–₹1075 without a decisive breakout.
Break above ₹1,075–₹1,085 could attract short covering and push towards next resistance (~₹1,120+).
A drop below ₹1,000 may accelerate weakness and test lower support (~₹970–₹950).

Varun Beverages: Formation Near Support | Multi-Target Study📄 Description
Varun Beverages is currently trading near a strong long-term support zone around ₹440–₹450, where price has formed a stable base after a prolonged correction.
The chart shows a descending trendline breakout attempt along with consolidation near Fibonacci support (0–0.22 zone), indicating possible accumulation.
RSI is in the lower range and approaching oversold territory, which suggests selling pressure is weakening and a potential reversal setup is building.
If price sustains above ₹480–₹500, we may see gradual upside momentum toward:
🎯 Short-term: ₹520+
🎯 Medium-term: ₹600+
🎯 Long-term: ₹680+
This setup offers a favorable risk–reward for positional and swing traders.
📌 View: Bullish above ₹450
🛑 Stop-loss: Below ₹430 (daily close)
📈 Trend: Reversal / Recovery Phase
⚠️ Disclaimer: This is only a technical view for study and learning purposes. Not a recommendation to buy or sell. Please do your own research.

XAUUSD – Trade key zones with discipline, volatility up.XAUUSD – Volatility Expansion, Trade Key Zones With Discipline (H1)
Market Context
Gold is trading in a high-volatility recovery phase after a sharp sell-off, with price now rotating aggressively between key technical zones. This behavior reflects liquidity rebalancing under macro uncertainty, rather than a clean trend.
Ongoing uncertainty around Fed leadership changes, future monetary policy direction, and headline risk keeps gold highly sensitive to flows. In this environment, reaction at levels matters more than direction.
➡️ Market state: fast moves, deep pullbacks, strong reactions – avoid emotional entries.
Structure & Price Action (H1)
Price is holding inside a rising corrective channel, indicating a recovery structure.
Higher lows are forming, but bullish structure is still conditional, not fully confirmed.
Upper zones show hesitation and rejection, while lower zones attract strong demand.
Expect sharp swings and fake breaks during this phase.
Key insight:
This is a reaction-driven market. Trade the zones, not the noise.
🎯 Trading Plan – MMF Style
🔵 Primary Scenario – Buy the Pullback (Reaction-Based)
BUY Zone 1: 5,008 – 4,990
• Short-term demand
• 0.618 Fib retracement
• Channel support
BUY Zone 2: 4,670 – 4,650
• Major demand
• Prior liquidity sweep area
• Strong structural base
➡️ Only consider BUYs after:
Clear bullish rejection candles
Or a Higher Low confirmed on H1
🔴 Alternative Scenario – Sell at Upper Reaction Zones
SELL Zone 1: 5,250 – 5,275
• Prior resistance
• Mid-channel reaction zone
SELL Zone 2: 5,560 – 5,575
• Major extension / supply zone
• Fibonacci expansion resistance
➡️ Look for:
Rejection wicks
Loss of bullish momentum on H1
🎯 Targets (TP Zones)
Upside Targets (from BUY setups):
TP1: 5,253
TP2: 5,573
Downside Targets (if SELL scenario plays out):
TP1: 5,008
TP2: 4,670
❌ Invalidation
A confirmed H1 close below 4,650 invalidates the recovery structure
Requires a full reassessment of bias

Algo Trading Basics (Indian Regulations)1. What is Algorithmic Trading?
Algorithmic Trading (Algo Trading) refers to the use of computer programs and predefined logic to automatically place, modify, and cancel trades in financial markets. These algorithms execute trades based on rules such as price, time, volume, indicators, or mathematical models, without manual intervention.
In India, algo trading is widely used by institutions, proprietary traders, brokers, and increasingly by retail traders, especially in derivatives (F&O) and high-liquidity stocks.
2. How Algo Trading Works
An algo trading system generally has four components:
Market Data Feed – Live price, volume, order book data from exchanges (NSE/BSE).
Strategy Logic – Rules based on indicators (VWAP, RSI, moving averages), price action, arbitrage, or statistical models.
Order Execution Engine – Sends buy/sell orders automatically to the exchange.
Risk Management Module – Controls position size, stop-loss, max drawdown, and exposure.
Once activated, the algorithm continuously monitors the market and executes trades faster and more consistently than a human trader.
3. Types of Algo Trading Strategies in India
a) Execution-Based Algorithms
Used mainly by institutions to minimize market impact.
VWAP (Volume Weighted Average Price)
TWAP (Time Weighted Average Price)
Iceberg Orders
b) Trend-Following Strategies
Based on indicators and momentum:
Moving Average Crossover
Breakout strategies
Supertrend-based algos
c) Arbitrage Strategies
Very popular in Indian markets:
Cash–Futures Arbitrage
Index Arbitrage (Nifty/Bank Nifty)
Options Arbitrage
d) Mean Reversion Strategies
Assume price returns to average:
Bollinger Band strategies
RSI oversold/overbought strategies
e) Market Making
Providing buy and sell quotes simultaneously (mostly institutions due to regulatory and capital requirements).
4. Growth of Algo Trading in India
Algo trading in India has grown rapidly due to:
High liquidity in NSE derivatives
Faster internet and low latency APIs
Broker platforms offering API access
Retail participation post-COVID
Today, over 50–60% of trades on NSE are algorithmic, mostly driven by institutions, but retail algo participation is increasing.
5. Regulatory Framework in India
Algo trading in India is regulated by SEBI (Securities and Exchange Board of India) and implemented through NSE and BSE circulars.
Unlike some global markets, India has strict compliance and approval requirements.
6. SEBI Definition of Algorithmic Trading
According to SEBI:
Any order that is generated using automated execution logic, where parameters such as price, quantity, timing, or order type are decided by a computer program, is considered algorithmic trading.
This definition applies even to retail traders using APIs.
7. Approval and Registration Requirements
a) Exchange Approval
Every algorithm must be approved by the exchange (NSE/BSE).
Brokers submit algos on behalf of clients.
Any change in logic requires re-approval.
b) Broker Responsibility
Algo trading is permitted only through SEBI-registered brokers.
The broker is responsible for risk checks, order limits, and compliance.
c) Retail Trader Approval
Retail traders using APIs must:
Declare algo usage
Use exchange-approved strategies
Avoid self-designed unapproved algos (unless routed through approval)
8. API-Based Trading Rules for Retail Traders
SEBI allows retail traders to use APIs, but with restrictions:
APIs must be provided by the broker
Order rate limits are enforced
No uncontrolled high-frequency order placement
Kill switch must be available to stop algos instantly
Brokers must log and audit all algo orders
Unapproved or black-box algos are not allowed for retail traders.
9. Risk Management & Safety Measures (Mandatory)
SEBI mandates strict risk controls:
Price check limits
Quantity and value limits
Max order per second limits
Pre-trade risk checks
System audit trails
Algo testing in a sandbox environment
These measures aim to prevent:
Flash crashes
Runaway algorithms
Market manipulation
10. Prohibited Practices in Algo Trading
The following are strictly prohibited in India:
Quote stuffing
Layering and spoofing
Market manipulation using algos
Latency arbitrage using illegal infrastructure
Unauthorized co-location access
Violations can lead to heavy penalties, trading bans, or criminal action.
11. Co-Location (Colo) and High-Frequency Trading
Co-location (servers near exchange) is allowed only for institutions
Retail traders cannot access exchange co-location
HFT is permitted but closely monitored by SEBI
Equal access and fairness principles apply
12. Taxation of Algo Trading in India
Tax treatment depends on the instrument:
Equity Delivery – Capital Gains
Intraday & F&O – Business Income
Algo trading income usually falls under Business Income
Audit may be required if turnover exceeds limits
GST applies on brokerage, not profits
Proper accounting and compliance are essential.
13. Advantages of Algo Trading
Emotion-free trading
Faster execution
Backtesting and optimization
Scalability
Discipline and consistency
14. Risks and Limitations
Technical failures
Over-optimization
Regulatory restrictions
Latency disadvantages for retail traders
Strategy decay over time
Algo trading is not a guaranteed profit system.
15. Future of Algo Trading in India
SEBI is gradually moving toward:
Standardized retail algo frameworks
Broker-level strategy marketplaces
Better risk control systems
Increased transparency
India’s algo trading ecosystem is evolving but will remain highly regulated to protect market integrity.
16. Conclusion
Algo trading in India offers powerful opportunities but operates under strict regulatory supervision. Understanding SEBI rules, broker compliance, and risk management is non-negotiable. For retail traders, success lies in simple, well-tested strategies, proper approvals, and disciplined execution.
Algo trading is a tool—not a shortcut—and in the Indian market, compliance is as important as profitability.

News-Based Trading (Budget & RBI Policy)News-based trading is a market strategy where traders make decisions based on economic, political, and financial news events that can cause sudden changes in price, volume, and volatility. Unlike pure technical or long-term fundamental trading, news-based trading focuses on short-term price reactions driven by new information entering the market.
In India, two of the most powerful news events for traders are:
Union Budget
RBI Monetary Policy
Both events can move indices like NIFTY, BANK NIFTY, FINNIFTY, and individual stocks sharply within minutes.
1. Why News Moves Markets
Markets move because prices reflect expectations. When actual news differs from expectations, prices adjust rapidly.
Better than expected news → bullish reaction
Worse than expected news → bearish reaction
In-line with expectations → muted or volatile sideways move
News impacts markets through:
Liquidity changes
Interest rate expectations
Corporate earnings outlook
Investor confidence
For traders, news creates opportunity + risk.
2. Budget-Based Trading
What is the Union Budget?
The Union Budget is the annual financial statement of the Indian government, usually presented in February. It outlines:
Government spending
Taxation changes
Fiscal deficit targets
Sector-specific incentives
Why Budget Day is Important for Traders
High volatility across equity, currency, bond, and commodity markets
Sudden directional moves in indices
Sector-specific rallies or sell-offs
Key Budget Elements Traders Track
Fiscal Deficit – Higher deficit can pressure markets
Capital Expenditure (Capex) – Boosts infra, PSU, cement, steel
Tax Changes – Impacts FMCG, auto, real estate
Sector Allocations – Defence, railways, renewable energy, banking
Disinvestment Plans – Affects PSU stocks
Budget Trading Phases
1. Pre-Budget Phase
Markets often move on expectations and rumors
Certain sectors start outperforming early
Volatility gradually increases
Common trader approach:
Light positional trades
Avoid heavy leverage
Focus on sector rotation
2. Budget Day Trading
This is the most volatile phase.
Characteristics:
Sharp spikes in the first 30–60 minutes
Fake breakouts common
Option premiums expand rapidly
Index Behavior:
NIFTY & BANK NIFTY can move 2–4% intraday
Sudden trend reversals possible
Popular Budget Trading Strategies:
Option Straddle / Strangle (for volatility)
Post-speech breakout trading
Wait-and-trade strategy (after first hour)
⚠️ Many professional traders avoid trading during the speech and trade only after clarity emerges.
3. Post-Budget Phase
Real trend often emerges 1–3 days later
Markets digest data and reprice expectations
Best phase for positional trades
3. RBI Monetary Policy-Based Trading
What is RBI Monetary Policy?
RBI announces monetary policy every two months, focusing on:
Repo rate
Reverse repo
Liquidity measures
Inflation outlook
GDP growth projections
Why RBI Policy Impacts Markets
Interest rates influence:
Bank profitability
Loan demand
Corporate earnings
Currency valuation
Bond yields
Even a single word change in RBI commentary can move markets.
Key RBI Policy Components Traders Watch
Interest Rate Decision
Rate hike → bearish for equities, bullish for banks short term
Rate cut → bullish for equities
Policy Stance
Accommodative → growth-friendly
Neutral / Withdrawal → cautious sentiment
Inflation Outlook
Higher inflation → rate hike fears
Lower inflation → easing expectations
Liquidity Measures
Tight liquidity → market pressure
Easy liquidity → risk-on mood
RBI Policy Trading Phases
1. Pre-Policy
Markets move on expectations
Bond yields and banking stocks react early
Option IV rises
2. Policy Announcement (2:00 PM)
Immediate spike in volatility
Algo-driven moves dominate
Sharp whipsaws common
Common mistakes:
Market orders during announcement
Over-leveraged option buying
3. Governor’s Speech
Trend clarity often comes during speech
Commentary matters more than rate decision sometimes
4. Instruments Used in News-Based Trading
Cash Market
Suitable for experienced traders
Slippage risk high
Better post-event
Futures
High risk due to gap moves
Strict stop-loss required
Options (Most Popular)
Limited risk strategies
Best suited for volatility events
Common Option Strategies:
Long Straddle / Strangle (high volatility)
Iron Condor (if volatility expected to drop)
Directional option buying after confirmation
5. Risk Management in News Trading
News-based trading is high-risk, high-reward. Risk control is non-negotiable.
Key Rules:
Reduce position size
Avoid trading without a plan
Do not chase first move
Use defined-risk option strategies
Accept slippage as part of the game
Many traders lose money not because of wrong direction, but because of overconfidence and overtrading.
6. Psychology of News Trading
News trading tests emotional discipline.
Common psychological traps:
FOMO during fast moves
Panic exits
Revenge trading after loss
Successful news traders:
Stay calm during volatility
Trade reactions, not headlines
Accept that missing a trade is better than forcing one
7. Advantages of News-Based Trading
Large moves in short time
High liquidity
Clear catalysts
Opportunity across asset classes
8. Disadvantages
Extreme volatility
Algo dominance
Slippage and spread issues
Emotional pressure
Conclusion
News-based trading around the Union Budget and RBI Monetary Policy is one of the most exciting yet challenging styles of trading in the Indian market. These events can create massive opportunities, but only for traders who understand expectations, volatility, and risk management.
For beginners, it is better to observe first, trade later. For experienced traders, combining news understanding with technical levels and options strategies can be highly rewarding. Ultimately, success in news-based trading comes not from predicting the news, but from managing risk and trading market reactions intelligently.

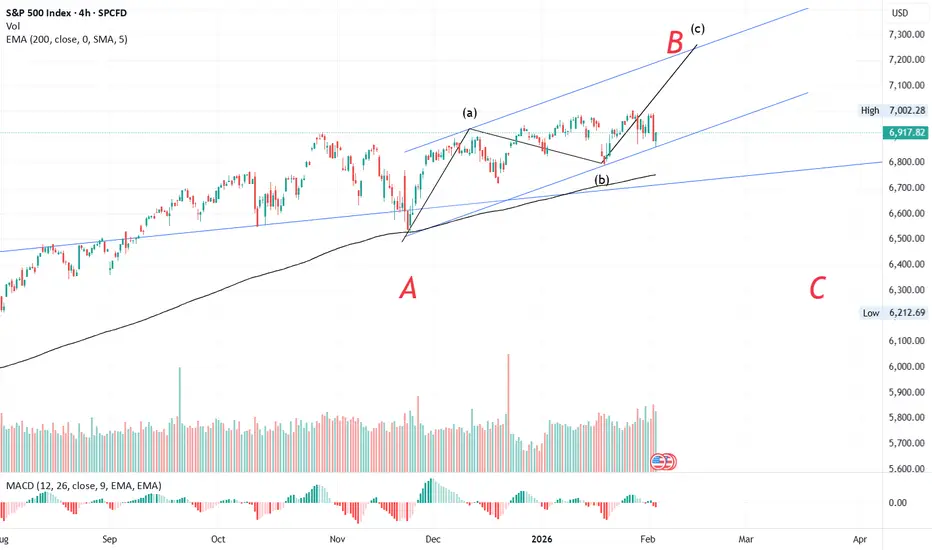
#S&P📊 S&P 500 Wave Analysis Update
The S&P began its corrective phase on 29 Oct 2025, forming its A wave by 21 Nov 2025. From there, the index rallied into its B wave, retracing more than 61.8%, which signals the development of a flat correction.
Breaking down the B wave:
- The a wave formed on 5 Dec 2025.
- The subsequent b wave retraced less than 61.8%, indicating a zig-zag structure.
- This sets the stage for the c wave, which has the potential to extend towards the 7200–7300 zone.
Trend Channel Explained | Base chart MAX Financial Services LtdTrend channels are one of the most practical tools in technical analysis, helping traders visualize price movement within parallel boundaries. Currently, Max Financial Services (NSE: MFSL) is trading around ₹1685, and its chart shows the stock moving in an uptrend channel, offering a real-time example of how traders can anticipate moves and manage risk.
📈 What is a Trend Channel?
A trend channel is formed by drawing two parallel lines:
Upper line (resistance): Connects swing highs.
Lower line (support): Connects swing lows.
Price tends to oscillate between these boundaries, creating a visual “channel” that reflects the prevailing trend direction.
Types of channels:
Uptrend channel: Prices move higher with rising support and resistance.
Downtrend channel: Prices move lower with declining support and resistance.
Sideways channel: Prices consolidate within horizontal boundaries.
🔑 Importance of Trend Channels
Trend identification: Quickly shows whether the market is bullish, bearish, or neutral.
Entry & exit points: Traders can buy near support and sell near resistance.
Anticipating breakouts: A breakout above resistance may signal strong bullish momentum, while a breakdown below support may indicate trend reversal.
Risk control: Channels provide clear invalidation levels for stop-loss placement.
📊 Example: Max Financial Services (MFSL)
Current price: ₹1685 (NSE).
Chart observation: The stock is moving within an ascending channel, with higher highs and higher lows.
Implication:
Buying near the lower boundary (~support zone) increases probability of success.
Profit-taking near the upper boundary (~resistance zone) helps lock gains.
A breakout above the channel could indicate acceleration in bullish momentum.
⚠️ Risk Management in Trend Channels
Stop-loss placement: Always place stops just outside the channel boundary to protect against false moves.
Position sizing: Avoid over-leveraging; channels can break unexpectedly.
Confirmation tools: Use indicators (RSI, MACD, volume) to confirm signals before acting.
Avoid chasing: Enter trades near support rather than at resistance to reduce risk.
📌 Traders’ Key Takeaways
Trend channels are visual guides that simplify decision-making.
They help traders anticipate moves by showing where price is likely to bounce or reverse.
In MFSL’s case, the uptrend channel suggests bullish sentiment, but traders should remain cautious of potential breakdowns.
Risk management is essential—channels are not foolproof, and false breakouts can occur.
Combining channels with other technical indicators enhances reliability.
✅ In summary: Trend channels provide traders with a structured framework to anticipate price movement, manage risk, and make disciplined trading decisions. With Max Financial Services trading at ₹1685 in an uptrend channel, traders can use this live example to understand how channels guide entries, exits, and risk control in real-world markets.

BTCUSD ready for an upmoveWe noticed an order block in BTC and if the price comes back in the marked fair value gap we can plan a good buy trade.
