Johnson & Johnson extends the uptrend,1 Price has been trending higher for months with repeated, orderly pauses
2 Each consolidation formed at a higher level and resolved to the upside
3 The latest push was steeper, increasing the chance of another pause
4 So far, pauses have looked constructive rather than distributive
5 Silent Flow is active and confirms the broader state, not the timing of the next leg
6 Scenario A is consolidation at higher levels before continuation
7 Scenario B is a clean drop back below the last breakout zone, forcing the market to re prove strength
X-indicator

NIFTY KEY LEVELS FOR 06.02.2026NIFTY KEY LEVELS FOR 06.02.2026
Timeframe: 3 Minutes
Sorry for the delayed post..
If the candle stays above the pivot point, it is considered a bullish bias; if it remains below, it indicates a bearish bias. Price may reverse near Resistance 1 or Support 1. If it moves further, the next potential reversal zone is near Resistance 2 or Support 2. If these levels are also broken, we can expect the trend.
When a support or resistance level is broken, it often reverses its role; a broken resistance becomes the new support, and a broken support becomes the new resistance.
If the range(R2-S2) is narrow, the market may become volatile or trend strongly. If the range is wide, the market is more likely to remain sideways
please like and share my idea if you find it helpful
📢 Disclaimer
I am not a SEBI-registered financial adviser.
The information, views, and ideas shared here are purely for educational and informational purposes only. They are not intended as investment advice or a recommendation to buy, sell, or hold any financial instruments.
Please consult with your SEBI-registered financial advisor before making any trading or investment decisions.
Trading and investing in the stock market involves risk, and you should do your own research and analysis. You are solely responsible for any decisions made based on this research.

Elliott Wave Analysis XAUUSD – February 6, 2026
Momentum
– Daily (D1) momentum is currently rising, indicating that the upward move may still continue for another 1–2 days, until D1 momentum reaches the overbought zone.
– H4 momentum has started to reverse to the upside, therefore we expect a bullish move over the next few H4 candles.
– H1 momentum is currently in the overbought zone and is showing early signs of a potential reversal. As a result, within the next few hours, a short-term pullback or momentum reversal on H1 is expected.
Wave Structure
Daily (D1) Wave Structure
On the D1 timeframe, momentum continues to rise while price has not yet expanded strongly. This suggests that the corrective rebound of wave B is still in progress.
We expect wave B to complete once D1 momentum reaches the overbought zone, preparing the market for the next phase.
H4 Wave Structure
On the H4 chart, momentum is reversing to the upside, which supports a short-term bullish move of approximately 4–5 H4 candles.
This advance is still considered part of wave B. Once wave B is completed, price is expected to continue into wave C (black) as previously outlined.
H1 Wave Structure
Within black wave B, we are observing a red ABC corrective structure, with price currently trading inside red wave B.
Unfortunately, price did not trigger our intended entry from yesterday’s setup.
For now, we wait for H1 momentum to reverse lower and move into the oversold zone. At that point, if both H4 and H1 momentum align and reverse upward, we will have a strong momentum confluence to consider new entries.
– If price holds above 4658: this will confirm that an H4 bottom has formed at 4658, and price is likely to continue higher in line with H4 momentum.
– If price breaks below 4658: this would indicate that wave B may still be unfolding, and we will then focus on the 4640 – 4597 zone. This area represents high liquidity, combined with the Fibonacci zone identified in yesterday’s analysis, making it a key region to look for buy opportunities.
Risk Management Notes
At this stage, price volatility remains very wide. The potential trading range spans more than 500 pips, which makes placing limit orders extremely difficult.
Therefore, the preferred approach is direct execution, based on:
– Momentum behavior
– Key price target zones
– Clear reversal candlestick patterns
Strict risk management is critical in the current market environment:
– Small accounts: risk no more than 5% per trade
– Large accounts: risk no more than 3% per trade
Proper position sizing at this time is essential to protect trading capital during periods of elevated volatility.

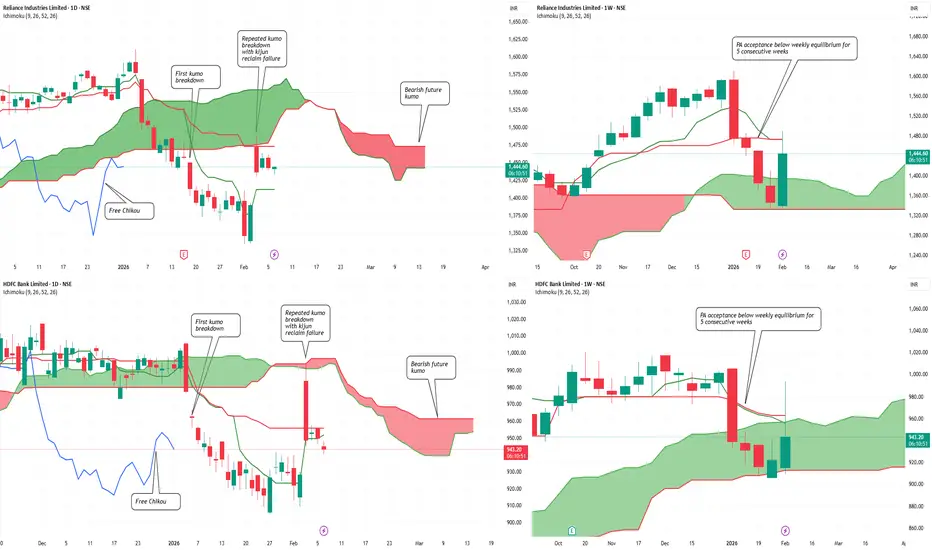
Dead Cat Bounce in Nifty? Heavyweights to Deliver The VerdictDead Cat Bounce in Nifty? Index Heavyweights to Deliver the Verdict Soon…
Both index heavyweights remain structurally weak despite the recent bounce.
On the daily timeframe, Reliance Industries and HDFC Bank have transitioned out of bullish Ichimoku regimes. Crucially, the second daily Kumo breakdown in both stocks overlaps with a failed Kijun-sen reclaim , reinforcing bearish continuation rather than base formation.
The weekly picture strengthens this caution. Price has shown multi-week acceptance below weekly equilibrium across both names, signaling institutional comfort at lower levels . Until price can reclaim and sustain above the weekly mean, the ongoing bounce risks remaining a dead cat rather than evolving into a sustainable trend reversal.
Verdict pending — and it rests squarely with these heavyweights
Vinati Organics at strong supportVinati Organis is at its support. Also, gapup because of traiif relief has been filled. One can enter with the SL as support line.

Nifty50 analysis(6/2/2026).CPR: narrow + decending cpr: trending
FII: 2,150.51 sold.
DII: 1,129.82 bought.
Highest OI:
CALL OI: 25700 to 26000
PUT OI: 25500
Resistance: - 26000
Support : - 25500
conclusion:.
My pov:
1.market gap down and continue with trend because of narrow cpr.
2.still support at 25400 and above first resistance is 25650.
3. Price must find a clear support until then bearish
What IF:
resistance 25650 on the upside
And support 25400 on the down side .
psychology:
Confidence. Discipline . Proper focus gives consistence result
note:
8moving average ling is blue colour.
20moving average line is green colour
50moving average line is red colour.
200moving average line is black colour.
cpr is for trend analysis.
MA line is for support and resistance.
Disclaimer:
Iam not Sebi registered so i started this as a hobby, please do your own analysis, any profit/loss you gained is not my concern. I can be wrong please do not take it seriously thank you

OCTOBER 18: I CALLED $107K CRASH. TODAY: BITCOIN -44% AT $60K.OCTOBER 18: I CALLED $107K CRASH. TODAY: BITCOIN -44% AT $60K. RECEIPTS INSIDE.
They Called Me "FUD Spreader" When I Warned You On October 18, 2025.
Bitcoin Was At $107K.
Everyone Screamed "BUY THE DIP"
I Showed You The Bearish Divergence And Said: "Protect Your Capital."
THE NUMBERS DON'T LIE:
Bitcoin: $107,000 → $60,000
Total Drop: -44%
Short Profit: $47,000 Per BTC
IF YOU FOLLOWED THIS ANALYSIS:
✅ You Saved Your Portfolio From -44% Destruction
✅ You Made Massive Profits On The Short
✅ You're Now Positioned To Buy At 44% Discount
✅ You Ignored The Noise And Followed The Chart
WHAT HAPPENED:
Weekly Bearish Divergence ✓ CONFIRMED
$104K Support Breakdown ✓ BROKE
$73K Support Level ✓ SMASHED
$66K Zone ✓ CRUSHED
Now At $60K Testing Critical Support
WHAT'S NEXT:
$48K-$49K Zone Still In Play If $60K Breaks.
This Is NOT About Being Bearish.
This Is About PROTECTING CAPITAL And Buying Smart.
Bull Market Will Continue.
But Corrections Are PART Of The Journey.
Now You Can Start Accumulation Bitcoin From $60K Level Slowly
THE DIFFERENCE:
❌ Moonboys: "Buy At $107K, HODL Forever"
✅ Real Analysis: Save 44%, Re-Enter Lower
This Is Why Technical Analysis Matters.
This Is Why You Don't Follow Blind Hopium.
Drop Comment If You Followed This Call.
More Updates Coming. The Opportunity Isn't Over.

NIFTY 50 INTRADAY 🧭 Key Levels (Golden Part)
🟢 Supports
S1: 25,620 ⚠️ (abhi yahin fight chal rahi)
S2: 25,465 (strong)
S3: 25,365 (last defence)
👉 25,620 ke neeche sustain = aur weakness
🔴 Resistances
Pivot: 25,719
R1: 25,875
R2: 25,974
👉 25,720 ke upar hold = relief rally

Market Outlook & Trade Setup – Friday, 6th Feb 2026
Today is RBI'S policy announcement wherein we are expecting no change in the repo rate.
🔹 NIFTY: Gift Nifty (25,626: -22)
* Previous Close: 25,642
* Expected Range: 25,500 - 25,700
🔹 SENSEX
* Previous Close: 83,313
* Expected Range: 83,300 - 83,400
🌍 Global & Market Sentiment
* DJIA: -592| S&P: -84
💰 Institutional Activity (Cash Market)
* FII: Net Buyers: - ₹ 2151 Cr
* DII: Net Buyers: + ₹ 1130 Cr
🔥 Events this Week:
India - RBI Interest Rate Decision
📌 Sectoral Focus (Positive)
Bank, NBFC, Auto, Realty
👉 Commodities in Focus: Copper, Gold, Silver, Crude
✌️Important Quarterly Results: Bosch, CESC, Crompton, SUNTV, Whirlpool
📈 Trade smart. Manage risk. Stay disciplined.

#BANKNIFTY PE & CE Levels(06/02/2026)Bank Nifty is expected to open flat, indicating a continuation of the ongoing consolidation phase. Price action over the last few sessions shows that the index is trading within a tight range, reflecting indecision among participants. There is no strong gap or momentum bias visible at the open, so the first half of the session may remain range-bound with false breakouts possible around key levels.
On the upside, the 60050–60100 zone is the immediate resistance and trigger area. A sustained move above this zone with acceptance can open the door for upside targets at 60250, 60350, and 60450+. This level has acted as a supply zone earlier, so only a clean breakout with volume should be considered for fresh long positions. Until that happens, upside moves may face selling pressure near resistance.
On the downside, 59950 is the key support to watch. If Bank Nifty breaks and sustains below 59950, selling pressure can increase, leading to downside targets at 59750, 59650, and 59550, where the next demand zone is placed. This lower zone is expected to attract buyers, so aggressive shorts should be cautious near those levels and consider booking profits.
Overall, the structure clearly favors a range-trading approach for the day. Traders should avoid positional bias and focus on trading confirmation at levels rather than predicting direction. Scalping or short-term trades near support and resistance with strict stop-losses will be more effective until Bank Nifty gives a decisive breakout or breakdown from this consolidation range.

Force Motor - fundamental + Momentum stockFundamental is good.
PRICE above - 20, 50 and 200 SMA.
MACD - Positive in weekly and daily.
RSI > 60 IN WEEKLY AND DAILY.
Performance > Nifty50
Along with P shape volume profile.
Long consolidation.

XAUUSDGreetings!
Welcome traders.
By choosing to "Follow", you can stay updated with the latest information promptly. Kindly consider clicking "Boost" as well.
Wishing you a pleasant day.

XAUUSD Short Idea XAUUSD short idea, sell below harmonic level (below B) with a confirmation. target till the FVG or Ride it with a trailing SL.

MOMENTUM STOCK- HIGH VOLUME ACTION AT TOP OF CONSOLIDATIONPrice above 20, 50 & 200 SMA.
RSI > 60 in Weekly and daily.
MACD - positive crossover
ADX (5) > 20

Bearish Pullback From Key Resistance, Targets Below
Overall structure
Gold is in a short-term bearish correction after a strong impulsive sell-off. The left side of the chart shows a distribution → breakdown → liquidity sweep, followed by a corrective bounce that is now losing steam.
Key zones & story the chart tells
Major Resistance Zone (≈ 5,105 – 5,213)
This blue zone previously acted as support, then flipped to resistance. Price has revisited it and failed to reclaim, confirming a classic support → resistance flip.
Entry Area (around 5,100)
The pullback into resistance aligns with:
Lower-high structure
Bearish reaction after a corrective rally
Rejection near prior consolidation
This is the logical short entry zone, as marked.
Fair Value Gap (FVG)
The rally partially filled the FVG but failed to continue higher — another sign of weak bullish intent.
Notice the white projected path: price is respecting a corrective wave rather than impulsive buying.
Targets
1st Target: ~4,750
Prior reaction level and mid-range liquidity. Likely pause or partial take-profit zone.
2nd Target / Support: ~4,586
Strong demand zone and previous base. This is the main downside objective if bearish momentum continues.
Bias summary
Bias: Bearish below 5,105
Invalidation: Clean break and hold above 5,213
Market logic:
Distribution → breakdown → pullback into resistance → continuation lower
Big picture takeaway
This is a textbook pullback-short setup after a strong bearish impulse. As long as gold remains capped below the resistance band, the path of least resistance points down toward 4,750 and potentially 4,586.

Senores Pharma cmp 823.40 by Daily Chart view since it listedSenores Pharma cmp 823.40 by Daily Chart view since it listed
- Support Zone 765 to 805 Price Band
- Resistance Zone 835 to ATH 876.50 Price Band
- Stock Price trending upside within Rising Price Channel
- Volumes are running well in sync under avg traded quantity
- Majority Technical Indicators EMA, BB, MACD, RSI trending positively

ITC 4H Kijun Failure: Is the Downtrend Louder Than the Dividend?The dividend adjustment is complete — price action now carries the final verdict .
On the 4H chart, ITC attempted a Kijun reclaim but failed to gain acceptance. The probe above equilibrium was sold into, followed by compression and a delayed but decisive close back below Kijun. Weekly price action remains under the Kumo , keeping HTF bias firmly bearish.
As long as price fails to close above 324.75 on a 4H basis (high of the reclaim attempt), the bearish structure remains intact.
Downside reference zones: 307.6 → 303.6 → 298.5 → 293.0
Bottom line:
The dividend narrative has faded. The structure hasn’t.

Silver future heading towards 100 MA Silver future is heading towards it's 100 mA of 2,15,000 almost. But one can consider 199,282 as the pivot level and 1,71508 as the major support, because that was the last major leg of this rally.

TRADE CATALYST SERIES - Episode 1 // PARADEEP PHOSPHATES LTDMajor trade deals don’t just influence diplomacy -- they create real opportunities in the stock market.
This series explores how the evolving India-US and India-EU trade partnerships could act as catalysts for select Indian companies. Each episode highlights carefully researched stocks that may benefit from these global economic shifts.
NSE:PARADEEP
1. Macro Catalyst Overview
These india's trade deals brings in two major developments:
India-EU FTA : A deal eliminating tariffs on Indian industrial goods and agricultural exports to Europe, while slashing import duties on European machinery.
US-India Trade : A strategic agreement focusing on technology transfer and supply chains, but reducing reliance on cheap/discounted Russian oil .
Global supply chains are decoupling from single-source dependencies. India is positioning itself as a manufacturing hub, while the West seeks to align India’s energy and tech standards with its own.
Market Impact:
Positive: Cheaper capital goods (machinery) for Indian manufacturers and opened gates for Indian agri-exports.
Negative: Potential spike in energy costs due to the shift away from discounted Russian feedstock.
2. Sector Impact - Fertilizers & Agro-chemicals
The "Agri-Export" angle : The EU has removed tariffs on Indian commodities. helps increase demand of NPK fert and nutrients.
The "Capex" advantage: Fert plants are capital intensive. removal of duties on European machinery will significantly lowers the cost of capacity expansion and maintenance.
The "Feedstock" squeeze: The sector requires high energy. The US-India pact’s pressure to move away from cheap Russian gas/ammonia could increase input costs, compressing margins.
3. Stock Spotlight
PPL is India’s second-largest private phosphatic fertilizer player. It distinguishes itself through backward integration (making its own acids) and a "parentage moat"—it is a joint venture with the OCP Group (Morocco), which controls 70%+ of the world's phosphate reserves.
Why This Company Benefits:
-Direct Beneficiary of Agri-Boom: PPL has a stronghold in Eastern and Southern India—key regions for tea and spice plantations. As the India-EU FTA boosts these plantations' income, PPL’s high-margin NPK fertilizer sales are poised to surge.
-Capex Efficiency: PPL is aggressively expanding capacity to 3.7 MMT. The zero-duty import of European technology will directly reduce the project cost of this expansion, improving ROCE.
- Raw Material Shield: While the sector faces energy cost risks (US Deal fallout), PPL’s partnership with OCP ensures a steady supply of Rock Phosphate, insulating it from the worst of the supply chain disruptions.
4. Fundamental Strength Check
Revenue Growth +48%yoy (Q3 2026)
Operating Margin ~9.5% ( compressed)
P/E ~ 14x
D/E 0.8x
order book is showing high visibility
5. Technicals
On Weekly chart the price is in a very sweet support zone. also the volume on red candles weekly is shrinking below VA of 10 - indicating sellers are loosing the control and bulls might now take over soon.
On Fib within price range between a year period the next targets would be at 0.5, 0.618 and 0.786 levels.
6. Risk Factors
->Energy Cost Inflation: If the US-India deal forces a switch to expensive LNG/Ammonia, PPL’s raw material bill could rise, squeezing margins further.
->Regulatory Hiccups: The recent seizure of 25,000 MT of Urea (Jan 2026) over quality disputes ("Biuret content") highlights operational and regulatory risks.
->Subsidy Dependence: Like all fertilizer stocks, PPL’s cash flow is heavily dependent on the timely release of government NBS (Nutrient Based Subsidy) payments.
->Monsoon Sensitivity: A sub-par monsoon could dampen the expected demand boom from the agri-export sector.
7. Final Verdict
I am Long on the weekly period with the following values.
Entry : 120-130
T1 : 160
T2 : 177
SL : 115
Future episodes will explore additional sectors and companies that could emerge as beneficiaries of evolving global trade partnerships. If your eye catches on to some particular stock reflecting on the same let me know in the comments below I will do a episode on it too.

ABINFRA – Trade AlertCMP: 20.99
Breakout Context: Trendline + consolidation breakout confirmed today with strong volume, adding conviction.
- Target: 26.64 (+26.9%)
- Stop Loss: 19.30 (-8.0%)
- Risk/Reward Ratio: ~1 : 3.4
🔑 Key Notes
- Strong volume breakout suggests genuine momentum; monitor for retests.
- Healthy retest zone: 20.41 – 20.50 (as long as price holds above stop loss).
- Trail stop loss upward as price advances to secure gains.

BTCUSD (1H) – Bearish Continuation | Trendline Breakdown IdeaMarket Structure
Bitcoin remains in a clear descending channel on the 1H timeframe. Price has consistently respected the downward sloping trendline, confirming a strong bearish structure with lower highs and lower lows.
Technical Confluence
Trendline Resistance (Red): Multiple rejections validate seller dominance.
Auto Pitchfork: Price is trading below the median line, indicating continuation toward the lower parallel.
Dynamic Support (Green): The recent breakdown below channel support signals bearish continuation rather than a reversal.
Balance of Power (BoP): Reading around -0.38 reflects sustained selling pressure with no bullish divergence.
Price Action
A brief consolidation failed to hold, followed by a strong bearish impulse that broke key intraday support. The current move suggests momentum-driven continuation, not exhaustion.
Trade Idea
Bias: Bearish
Sell Zone: Pullback toward broken support / descending trendline
Targets:
First target: Previous minor low
Extended target: Lower pitchfork boundary / demand zone
Invalidation: Sustained close above the descending trendline
Conclusion
As long as BTC remains below the descending trendline and pitchfork median, the path of least resistance is downward. Any retracement into resistance is likely to be a selling opportunity unless market structure shifts.
Always manage risk and wait for confirmation.

EVEREADY | Trade SetupCurrent Market Price (CMP): 345.40
Breakout Context:
A trendline plus consolidation breakout has been confirmed today with strong volume, adding conviction to the move.
Target: 440 (approx. +27.4% from CMP)
Stop Loss: 316 (risk of about -8.5% from CMP)
Key Notes
- Breakouts accompanied by volume often indicate genuine momentum, but be prepared for possible retests of the breakout zone.
- If price dips toward 341.00–340.50 but holds above the stop loss, consider it a healthy retest.
- Trail your stop loss upward as price advances toward the target to secure gains and reduce risk.

Bearish Rejection From Supply, Targets Below
Market Structure
Price previously made a blow-off top (sharp impulsive high, marked by the red arrow), followed by a strong bearish reversal, breaking short-term structure.
The subsequent bounce formed a lower high, confirming a bearish market structure shift on the intraday timeframe.
Key Zones
Gray zone (≈ 4,880–4,950): Former demand → now supply / resistance.
Price retested this area and rejected, which is classic bearish continuation behavior.
Blue zone (≈ 4,520–4,600): Major support / demand zone from the prior swing low.
Trade Idea Logic (as drawn)
Entry: Short on rejection from the gray supply zone after weak bullish retracement.
1st Target: Around 4,714 — interim support / liquidity pool.
2nd Target: The blue support zone — completion of the bearish leg and likely reaction area.
Price Action Clues
Retracement into resistance was corrective (overlapping candles), not impulsive → favors sellers.
Failure to reclaim the gray zone = sellers still in control.
Momentum points downward, aligning with the projected path.
Invalidation
A clean 45-min close and hold above the gray supply zone would weaken the bearish bias and suggest deeper consolidation or reversal.
