USDCAD – 15M | Breakout → Retest → Continuation SetupStrong impulsive move delivered a clean break in market structure to the upside.
Price pushed into buy-side liquidity, then paused at prior highs.
Key read:
Bullish displacement confirmed ✔️
Old resistance now acting as support ✔️
Pullback unfolding inside premium with inefficiency below
X-indicator

WAAREE ENERGIES has 50% upside potential in 10-12 MonthsWAAREE ENERGIES has 50% upside potential in 8-10 Months
Fundamentals:
Waaree Energies is India’s largest manufacturer and exporter of solar modules. As of FY24, they hold 21% share of the domestic market for solar modules and 44% share in India's solar module exports. Its installed capacity surged from 2GW in FY21 to 13.3GW by FY24.
Company has delivered good profit growth of 113% CAGR over last 5 years.
Technicals:
After hitting lows of 2410 recently stock has given weekly breakout on upside & targets can be 5000+ in 1-1.5 Years.
LTP - 3155
Targets - 5000+
Timeframe - 1 Year
Happy Investing.

RUBICON | Hourly Close Above 688 Could Fuel RUBICON Rally to 770Key Levels
Current Price: 675.65
Immediate Resistance: 688 (hourly close confirmation needed)
Upside Target: 770
Logic Behind the Trade
- 688 as Trigger: This level likely represents a supply zone or recent swing high. A candle close above it signals strength and potential continuation.
- 770 as Target: That’s a ~12% move from breakout, which suggests it’s either a prior resistance zone or a measured move projection.
Risk Management:
- Stop-loss could be placed just below 670–672 (recent support).
- Risk-to-reward ratio looks favorable if aiming for 770.
Probability Factors
- Volume: Breakouts with strong volume have higher reliability.
- Market Context: If broader indices are bullish, breakout chances improve.
- False Breakout Risk: Watch for wicks above 688 without a strong close.

Buy above 85 with stop below 78Buy above 85 with stop below 78 TARGET 100+
After a pull back this zone seems to be a good entry

ADANI POWER: Cup & Handle Breakout Setup | Upside TargetsADANI POWER is currently forming a well-structured Cup & Handle pattern on the higher timeframe, indicating a potential bullish continuation.
The stock has respected the rounded base formation and is now consolidating in the handle zone near a key resistance around 179. A sustained breakout with strong volume above this level can confirm the pattern and open the gates for a fresh upside move.
Technical Highlights:
📈 Pattern: Cup & Handle (Bullish Continuation)
🔑 Breakout Level: 179–180 (Strong resistance zone)
🎯 Target 1: 230
🎯 Target 2: 272
🛑 Invalidation: Sustained close below handle low
Trade Insight:
Aggressive traders can look for entries on a confirmed breakout.
Conservative traders may wait for a retest of the breakout zone.
Volume expansion will be a key confirmation factor.
⚠️ Disclaimer: This analysis is for educational purposes only. Please manage risk and trade according to your own strategy.

IREDA 1 Week Time Frame 📌 Current Price Snapshot
👉 Latest available price data shows IREDA trading around ~₹130–₹135 on the NSE (end of January 2026) — this serves as the baseline for weekly levels.
📈 Weekly Technical Levels (Key Zones)
🚧 Weekly Resistance Levels (Upside)
Level Significance
₹136–₹138 Near‑term resistance — first obstacle for bulls this week.
₹138–₹140 Secondary resistance — key short‑term range top.
₹145–₹150 Major weekly resistance zone — breakout above this signals strength.
🛑 Weekly Support Levels (Downside)
Level Significance
₹130–₹131 Immediate weekly support area — crucial for holding near current price.
₹126–₹127 Secondary support — next cushion if price slips.
₹122–₹123 Strong support zone below — potential downside limit this week.
📉 Weekly Outlook Structure
Bullish Scenario
✅ If price closes above ~₹138–₹140 on the weekly chart → next upside target becomes ₹145–₹150. Continued strength above ₹150 would target even higher levels.
Bearish Scenario
❌ A weekly close below ~₹130–₹127 → opens the door to deeper support at ₹122–₹123.
📊 Momentum & Indicators
RSI near lower area suggests mild bearish momentum (not oversold yet).
The stock remains below key medium/long‑term EMAs, indicating ongoing downward bias unless a strong breakout occurs.
📌 Summary – Weekly Levels to Watch
Bullish Break Points
🔹 First Resist: ₹136–₹138
🔹 Next Resist: ₹138–₹140
🔹 Major Resist: ₹145–₹150
Bearish Support Points
🔸 First Support: ₹130–₹131
🔸 Next Support: ₹126–₹127
🔸 Strong Support: ₹122–₹123

natural gas update after melted like icenatural gas update--- hurdle 303--305 if market sustain above or close above than only looks up side 320--335++ where below 300 looks down fall 276--265+++ strong laxman rekha 245 if market close below than u will see 222--202 soon ---

XAUUSD – High volatility, monitor key reaction zones.📌 Market Context
Gold is currently trading in a high-volatility environment after a sharp drop below the $5,000 level, reflecting aggressive repricing ahead of major macro uncertainty. The market has shifted away from smooth trend behavior into a liquidity-driven, fast-reaction phase, where price moves sharply between key technical zones.
With ongoing changes in Fed leadership and uncertainty around future monetary policy direction, gold remains extremely sensitive to expectations, flows, and headlines.
➡️ Current state: Volatile conditions – wait for confirmation, avoid emotional trades.
📊 Structure & Price Action (M30)
The prior bearish impulse is losing momentum, with short-term higher lows starting to form.
Price is currently in a technical recovery phase, not a confirmed trend reversal yet.
Market continues to respect Demand and Key Levels, producing sharp reactions.
No confirmed bullish CHoCH at this stage — further validation is required.
🔎 Key insight:
Gold is trading inside a decision zone, where each key level can trigger strong directional moves.
🎯 Trading Plan – MMF Style
🔵 Primary Scenario – Buy the Technical Pullback
Focus on reaction-based execution, not anticipation.
BUY Zone 1: 4,667 – 4,650
(Near-term demand + first recovery base)
BUY Zone 2: 4,496 – 4,480
(Deep demand + prior liquidity sweep low)
➡️ Execute BUYs only if:
Clear bullish candle reaction appears
Or a Higher Low structure forms on M30
Upside Targets:
TP1: 4,932
TP2: 5,124 (Major recovery resistance/supply zone)
🔴 Alternative Scenario – Sell at Resistance Reaction
If price retraces into supply and fails to hold bullish momentum:
SELL Zone: 5,120 – 5,140
→ Look for short-term rejection following M30 structure
❌ Invalidation
A confirmed M30 close below 4,480 invalidates the recovery structure and requires a full reassessment.
🧠 Summary
Gold is in a high-volatility, structure-building phase, not an environment for emotional or aggressive positioning. The edge lies in:
Trading key levels, not impulses
Waiting for price confirmation
Prioritizing risk management over prediction
📌 In volatile markets, discipline outperforms frequency.

Technology & AI Sector Trading: An OverviewKey Sub-Sectors in Technology & AI Trading
Software & Services
Includes companies offering software applications, SaaS (Software as a Service), enterprise solutions, cybersecurity, and IT consulting.
Example: Microsoft, Adobe, Salesforce.
Drivers: Cloud adoption, digital transformation, subscription-based revenue models.
Hardware & Devices
Encompasses manufacturers of computers, servers, networking devices, and consumer electronics.
Example: Apple, Intel, Cisco.
Drivers: Product launches, innovation cycles, semiconductor demand.
Semiconductors & Chips
Focused on designing and producing microchips essential for AI, computing, and electronics.
Example: NVIDIA, AMD, TSMC.
Drivers: AI adoption, global chip shortages, production innovations.
Artificial Intelligence & Robotics
Companies developing AI models, machine learning tools, robotics, autonomous vehicles, and automation solutions.
Example: OpenAI-backed enterprises, Boston Dynamics, Alphabet’s AI division.
Drivers: Advancements in deep learning, automation adoption, AI integration across industries.
Cloud Computing & Data Centers
Firms providing cloud infrastructure, platforms, and storage services.
Example: Amazon Web Services (AWS), Google Cloud, Oracle Cloud.
Drivers: Digitalization of businesses, demand for scalable computing, subscription renewals.
Factors Driving Technology & AI Sector Trading
Innovation Cycles and Product Launches
New technology products, AI models, or software releases can create strong market reactions. For example, announcements of breakthroughs in AI chips or cloud platforms often lead to immediate price surges.
Earnings Growth and Revenue Models
Technology firms, especially SaaS and AI companies, often have recurring revenue models that provide predictable cash flows. Analysts focus on revenue growth, subscription metrics, and margins, which heavily influence stock valuations.
Global Trends & Macro Influences
Increased digitalization, AI adoption, 5G rollout, and government incentives for tech innovation fuel sector growth.
Geopolitical tensions (e.g., US-China trade wars) or regulatory scrutiny on data and AI ethics can affect stock prices dramatically.
Market Sentiment & Speculation
Technology stocks are often driven by investor sentiment. Media hype, analyst upgrades, or social media trends can lead to exaggerated moves, creating opportunities for short-term traders.
Interest Rates & Valuation Impact
Many tech companies, particularly growth-oriented ones, are sensitive to interest rate changes. Higher rates reduce the present value of future earnings, impacting valuations. Conversely, low rates often lead to bullish momentum.
Trading Instruments in Technology & AI
Stocks & Equities
Direct trading of tech stocks is the most common approach. Traders evaluate fundamentals, growth potential, technical patterns, and market news.
Exchange-Traded Funds (ETFs)
ETFs provide diversified exposure to the tech and AI sector. Examples include:
Technology Select Sector SPDR Fund (XLK)
Global X Robotics & AI ETF (BOTZ)
Invesco QQQ ETF (tracking Nasdaq 100)
ETFs reduce company-specific risk and allow exposure to the broader tech ecosystem.
Options & Derivatives
Options allow traders to leverage positions, hedge risks, or speculate on price movements.
Calls are popular during bullish AI trends, while puts are used for downside protection in volatile tech markets.
Futures & CFDs
Technology indices futures or contract-for-difference (CFD) instruments enable trading on broader sector movements without holding individual stocks.
Trading Strategies in Technology & AI
Growth-Based Trading
Focus on companies with high revenue and earnings growth, even if valuations are premium.
Key indicators: Revenue growth rate, earnings per share (EPS) trajectory, AI product adoption metrics.
Momentum Trading
Leveraging price trends and market sentiment.
Traders track daily volume spikes, price breakouts, or sector-wide rallies. Momentum trading is common in AI-related hype cycles.
Swing Trading
Capitalizes on short- to medium-term price swings.
Technical analysis tools like moving averages, RSI (Relative Strength Index), and MACD (Moving Average Convergence Divergence) are widely used.
Event-Driven Trading
Trades based on corporate events such as product launches, AI breakthroughs, quarterly earnings, or regulatory approvals.
Example: Buying NVIDIA before AI chip announcements or Tesla during autonomous driving news.
Sector Rotation
Traders shift capital into technology when it is expected to outperform broader markets and exit when other sectors (like industrials or energy) show better potential.
Requires careful monitoring of macroeconomic indicators, Fed policies, and innovation trends.
Technical Analysis in Technology & AI Trading
Technical analysis plays a crucial role due to sector volatility:
Support & Resistance Levels: Used to identify entry and exit points.
Moving Averages (MA): 50-day and 200-day MAs highlight trend direction.
Relative Strength Index (RSI): Identifies overbought or oversold conditions, useful for momentum trades.
Volume Analysis: Spikes in volume can indicate strong buying or selling pressure.
Chart Patterns: Flags, pennants, and head-and-shoulders patterns often precede rapid price movements in tech stocks.
Risk Management in Tech & AI Trading
Given the sector’s high volatility, robust risk management is critical:
Position Sizing
Avoid overexposure to any single stock. AI and tech stocks can swing 5–10% in a day.
Stop-Loss Orders
Protects against sudden negative moves, especially during earnings reports or regulatory news.
Diversification
Combining sub-sectors like cloud, semiconductors, and AI reduces idiosyncratic risk.
Hedging with Options
Traders can use protective puts or covered calls to hedge against downside risk.
Monitoring Global Events
AI regulations, chip shortages, and interest rate changes can cause rapid shifts. Staying informed is essential.
Behavioral Considerations
Trading technology and AI stocks often tests psychological resilience:
FOMO (Fear of Missing Out): AI hype cycles can lead traders to chase prices without analysis.
Overconfidence Bias: Traders may overestimate their ability to predict technological breakthroughs.
Herd Behavior: Tech rallies often attract mass attention, creating bubbles in certain stocks.
Disciplined strategies and strict adherence to risk management help avoid these pitfalls.
Future Trends in Technology & AI Trading
AI-Driven Market Analysis
Algorithmic and AI-powered tools can analyze market sentiment, predict earnings surprises, and optimize trade timing.
ESG & Ethical AI Investing
Investors increasingly favor companies adhering to ethical AI standards, data privacy, and environmental sustainability.
Global Expansion & Emerging Markets
Emerging markets adopting AI and cloud technology provide new investment opportunities.
Quantum Computing and Next-Gen Technologies
As AI merges with quantum computing, investors may see exponential growth opportunities in specialized tech companies.
Conclusion
Technology and AI sector trading offers immense opportunities due to rapid innovation, high growth potential, and transformative impact on multiple industries. However, it comes with elevated volatility, regulatory risks, and market sentiment-driven price swings. Successful trading requires a combination of:
Fundamental analysis (growth metrics, AI adoption, product pipelines)
Technical analysis (trend, momentum, and pattern recognition)
Risk management (position sizing, hedging, diversification)
Behavioral discipline (avoiding hype-driven decisions)
Traders who integrate these elements while staying informed about technological advancements and global macro trends can potentially generate substantial returns, while minimizing risk in this fast-paced sector.

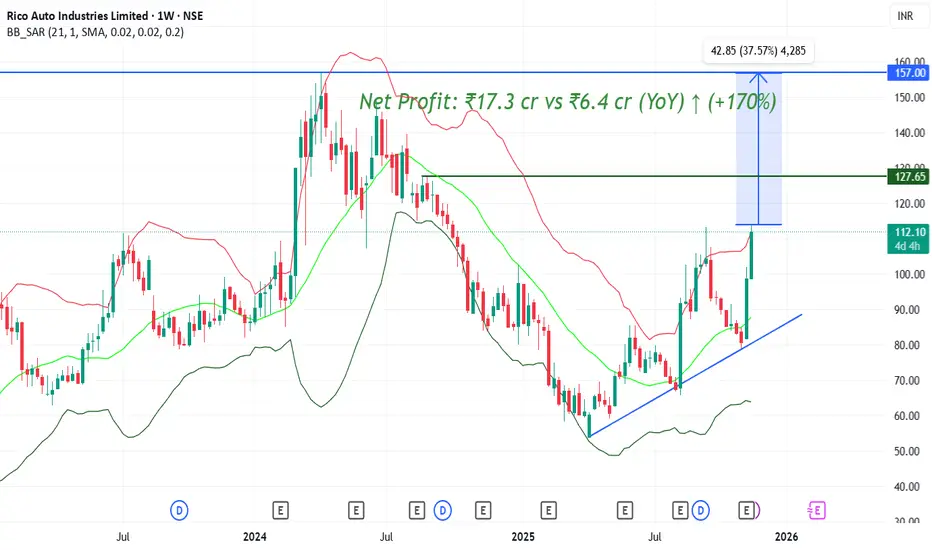
#RICOAUTO Expecting Big Result awesome expecting Big ..next level 127 after that long term 150+++
Net Profit: ₹17.3 cr vs ₹6.4 cr (YoY) ↑ (+170%)
Revenue: ₹627 cr vs ₹575 cr (YoY) ↑ (+9%)
US100 (Nasdaq) – Structure & BiasPrice is currently trading inside a well-defined consolidation range, capped by a major resistance zone near 25,850–25,900 and supported around 25,230–25,250, which has acted as a strong demand flip multiple times.
The recent price action shows:
A liquidity sweep to the downside, followed by a sharp bullish reaction, indicating smart money absorption.
Price reclaiming the mid-range level, suggesting buyers are regaining short-term control.
Compression near support, often a precursor to expansion.
The projected path indicates a minor pullback or sideways consolidation, followed by a bullish continuation toward the upper resistance band. Structure favors upside as long as price holds above the marked support zone.
Key Levels
Support: 25,230 – 25,250
Mid-range equilibrium: ~25,300
Target / Resistance: 25,850 – 25,900
Bias
🟢 Bullish continuation, provided price maintains above the demand zone.
A clean breakout above consolidation could trigger momentum-driven expansion toward the highs.

AAPLAAPL | 1D | Aggressive BUY Setup
📌 Buy only above blue line (262.17) on strong close.
🛑 Stop Loss below red line (255.50) to control risk.
🎯 Minimum Target: Green line (275.38); further upside possible if momentum sustains.
📊 Price attempting base formation after decline
📈 RSI near oversold zone, bounce setup forming
Trade confirmation is mandatory. Strict risk management advised.

Swing trading opportunity in Lenskart!!Rationale and Trade Plan:
- Price broke out of a triangle inviting breakout traders who are now trapped
- Unfilled gap sitting in discount which needs to be filled before the leg up
- Rising support channel
- One can plan to buy between 440 to 450 range during pullback with a strict SL of an hourly close below 425 levels

Indicators & Oscillators (Technical Analysis) – Complete GuideIntroduction
In technical analysis, Indicators and Oscillators are mathematical tools derived from price, volume, or open interest data. Traders use them to analyze market behavior, identify trends, measure momentum, spot reversals, and improve trade timing.
While price action shows what the market is doing, indicators help explain how strong, how fast, and how sustainable that move is. They do not predict the future but increase probability when used correctly with price structure and risk management.
What Are Indicators?
Indicators are tools that follow price and help traders understand market direction, strength, and trend continuation.
Key Characteristics of Indicators
Usually trend-following
Work best in trending markets
Often lag price (because they are calculated from past data)
Help with trend identification and confirmation
What Are Oscillators?
Oscillators are indicators that move between fixed ranges (usually 0–100 or -100 to +100). They are mainly used to identify overbought and oversold conditions.
Key Characteristics of Oscillators
Work best in range-bound or sideways markets
Help identify potential reversals
Can give early signals but also produce false signals in strong trends
Difference Between Indicators and Oscillators
Aspect Indicators Oscillators
Market Type Trending Sideways / Range
Purpose Trend confirmation Reversal & momentum
Nature Lagging Leading or coincident
Examples Moving Average, ADX RSI, Stochastic
Commonly Used Trend Indicators
1. Moving Averages (MA)
Moving averages smooth price data to identify trend direction.
Types
Simple Moving Average (SMA)
Exponential Moving Average (EMA)
Usage
Price above MA → Uptrend
Price below MA → Downtrend
MA crossover → Trend change signal
Popular Periods
20 EMA – short-term
50 EMA – medium-term
200 EMA – long-term trend
2. Moving Average Convergence Divergence (MACD)
MACD measures the relationship between two EMAs.
Components
MACD Line
Signal Line
Histogram
Signals
MACD crossover → Buy/Sell
Histogram expansion → Momentum strength
Divergence → Possible reversal
3. Average Directional Index (ADX)
ADX measures trend strength, not direction.
Interpretation
ADX below 20 → Weak or no trend
ADX above 25 → Strong trend
ADX above 40 → Very strong trend
Used with +DI and -DI to identify direction.
4. Parabolic SAR
Used to determine trend direction and trailing stop loss.
Usage
Dots below price → Uptrend
Dots above price → Downtrend
Dot flip → Trend reversal
Best in strong trends, weak in sideways markets.
Popular Oscillators
1. Relative Strength Index (RSI)
RSI measures momentum and overbought/oversold conditions.
Range: 0–100
Key Levels
Above 70 → Overbought
Below 30 → Oversold
50 → Trend strength level
Advanced Usage
RSI above 60 = bullish trend
RSI below 40 = bearish trend
RSI divergence → Reversal signal
2. Stochastic Oscillator
Compares closing price with price range over a period.
Range: 0–100
Key Levels
Above 80 → Overbought
Below 20 → Oversold
Signals
%K and %D crossover
Divergence with price
Works best in range-bound markets.
3. Commodity Channel Index (CCI)
Measures price deviation from average price.
Range: No fixed limit
Levels
Above +100 → Strong bullish momentum
Below -100 → Strong bearish momentum
Used for early trend and reversal signals.
4. Williams %R
Similar to Stochastic but inverted.
Range: -100 to 0
Above -20 → Overbought
Below -80 → Oversold
Useful for short-term trading and scalping.
Volume-Based Indicators
1. On-Balance Volume (OBV)
Measures buying and selling pressure using volume.
Concept
Rising OBV → Accumulation
Falling OBV → Distribution
Volume leads price; OBV helps confirm breakouts.
2. Volume Oscillator
Shows difference between short-term and long-term volume averages.
Helps identify breakout strength and fake moves.
Momentum Indicators
1. Rate of Change (ROC)
Measures speed of price movement.
Positive ROC → Bullish momentum
Negative ROC → Bearish momentum
Used for momentum-based entries.
2. Momentum Indicator
Simple calculation of price change over time.
Good for spotting trend acceleration and exhaustion.
Divergence – A Powerful Concept
Divergence occurs when price and indicator move in opposite directions.
Types of Divergence
Bullish Divergence: Price makes lower low, indicator makes higher low
Bearish Divergence: Price makes higher high, indicator makes lower high
Divergence often signals trend exhaustion or reversal, especially near support/resistance zones.
How to Use Indicators Effectively
Best Practices
Never use too many indicators
Combine one trend indicator + one oscillator
Confirm signals with price action
Always use stop loss
Understand market context (trend vs range)
Common Mistakes
Blindly following signals
Using oscillators in strong trends
Ignoring risk management
Over-optimization
Ideal Indicator Combinations
EMA + RSI
MACD + Support/Resistance
ADX + Moving Average
RSI + Divergence + Price Action
Conclusion
Indicators and Oscillators are decision-support tools, not decision-makers. They help traders understand trend direction, momentum strength, market conditions, and potential reversals. When combined with price action, volume, and risk management, they significantly improve trading accuracy.
Successful traders focus on simplicity, consistency, and discipline, not on finding the “perfect” indicator. Master a few tools, understand their behavior in different market conditions, and apply them with patience.

CONSOFINVT || Breakout with VolumeTrade Setup:
- CMP: 183
- Entry Zone: Around 183
- Target: 295
- Stop Loss: 159
Breakout Context
A decisive breakout from the daily trendline and resistance was confirmed yesterday on strong volume, adding conviction to the move.
Key Guidelines
- Breakouts backed by volume often indicate genuine momentum. Stay alert for possible retests of the breakout zone.
- As price advances toward the target, trail your stop loss upward to protect profits and lock in gains.

Part 3 Institutional Option Trading Vs. Techncal AnalysisOption Buyer vs Option Seller
Buyer pays premium, limited risk, unlimited profit.
Seller collects premium, limited profit, unlimited risk.
In real market volume, 80–90% of time sellers (institutions) dominate.
Expiry
Every option has a deadline (weekly, monthly).
On expiry day, option either:
ITM: Has value.
OTM: Becomes zero.

NIFTY KEY LEVELS FOR 03.02.2026NIFTY KEY LEVELS FOR 03.02.2026
Timeframe: 3 Minutes
If the candle stays above the pivot point, it is considered a bullish bias; if it remains below, it indicates a bearish bias. Price may reverse near Resistance 1 or Support 1. If it moves further, the next potential reversal zone is near Resistance 2 or Support 2. If these levels are also broken, we can expect the trend.
When a support or resistance level is broken, it often reverses its role; a broken resistance becomes the new support, and a broken support becomes the new resistance.
If the range(R2-S2) is narrow, the market may become volatile or trend strongly. If the range is wide, the market is more likely to remain sideways
please like and share my idea if you find it helpful
📢 Disclaimer
I am not a SEBI-registered financial adviser.
The information, views, and ideas shared here are purely for educational and informational purposes only. They are not intended as investment advice or a recommendation to buy, sell, or hold any financial instruments.
Please consult with your SEBI-registered financial advisor before making any trading or investment decisions.
Trading and investing in the stock market involves risk, and you should do your own research and analysis. You are solely responsible for any decisions made based on this research.

Analysis on GoldI see a W Structure with double top at 5010-5000 levels with OB at 5025-5010 pushing gold back to 4850-4750 levels. I see a sell from these levels for the NY session
Gold sell 5000-4980
Safe Sell 5020-500
Tp levels on the chart
Happy Trading

BTC 1D UpdateThe Hook: Is the floor finally in? $70k is the new battleground. 🩸📉
If you’re looking at your portfolio today, take a deep breath. Bitcoin has officially plunged below $71,000, hitting lows we haven't seen since early November 2024. We’ve wiped out over $500 billion in market cap this week alone, and nearly $1.7 billion in leveraged positions have been vaporized in the last 24 hours.
Why the panic? It’s a "perfect storm" of macro uncertainty. The market is reeling from $272 million in ETF outflows, a partial U.S. government shutdown causing delays in key economic data, and the nomination of Kevin Warsh as Fed Chair, which has investors scrambling to safe-havens like gold.
The Technical Roadmap:
The Critical Support: We are currently battling to hold the $70,129 – $70,900 zone. Losing this could trigger an accelerated slide toward the next major demand level at $68,000 or even $65,000.
The Recovery Trigger: To flip the narrative, we need to reclaim $74,434 on the daily chart. Once we flip that level back into support, the path back to $80k and beyond reopens.
Sentiment Check: The Fear & Greed Index has tanked to 11 (Extreme Fear). Historically, this level of "blood in the streets" is exactly where long-term wealth is built while the "paper hands" exit.
The Play: The smart money isn't panic-selling; they are waiting for the 4H candle to confirm buyer absorption at these levels. Don't be the exit liquidity—be the one who understands the math behind the move.
#Bitcoin #BTC #CryptoTrading #TechnicalAnalysis #TradingView #Web3 #BTCDump #MarketPanic

Part 2 Ride The Big MovesLot Size
Options trade in lots, not single units.
Lot size varies by instrument.
Why Are Options Popular?
Low upfront premium.
Leverage.
Sophisticated hedging.
High liquidity.
European vs American Options
Indian index options are European — can only be exercised on expiry.
Stock options are American — can be exercised any time (but rarely done).

The Global Inflation Surge: A New Era of High PricesUnderstanding Inflation and Its Return
Inflation refers to the sustained increase in the general price level of goods and services over time, reducing the purchasing power of money. For nearly two decades before 2020, many advanced economies struggled more with low inflation or even deflation than with rising prices. Central banks frequently worried about stimulating demand rather than containing it.
However, this pattern changed dramatically after the COVID-19 pandemic. What began as a temporary spike driven by supply disruptions quickly evolved into a broad-based and persistent inflationary cycle, affecting food, energy, housing, transportation, and services across the globe.
Key Drivers of the Global Inflation Surge
1. Post-Pandemic Supply Chain Disruptions
The pandemic severely disrupted global supply chains. Factory shutdowns, port congestion, labor shortages, and transportation bottlenecks reduced the availability of goods. When demand rebounded faster than supply, prices surged. Key industries such as semiconductors, automobiles, electronics, and pharmaceuticals faced prolonged shortages, pushing costs higher worldwide.
2. Massive Fiscal and Monetary Stimulus
Governments and central banks injected trillions of dollars into the global economy to prevent economic collapse during the pandemic. While these measures were necessary, they also significantly increased money supply. Ultra-low interest rates and direct cash transfers boosted consumer spending, creating excess demand that outpaced supply, fueling inflation.
3. Energy and Commodity Price Shocks
Energy prices became a major contributor to inflation. Crude oil, natural gas, and coal prices rose sharply due to recovering demand, underinvestment in energy infrastructure, and geopolitical tensions. Rising energy costs increased production and transportation expenses, which were passed on to consumers. Similarly, prices of metals, fertilizers, and agricultural commodities surged, affecting food inflation globally.
4. Geopolitical Conflicts and Trade Fragmentation
Geopolitical instability has played a crucial role in sustaining inflation. Conflicts, sanctions, and trade restrictions have disrupted commodity flows, especially in energy and food markets. Increased protectionism and the reshoring of supply chains have raised production costs, reversing decades of globalization that once helped keep prices low.
5. Labor Market Pressures
In many countries, labor shortages emerged as workers reassessed employment conditions after the pandemic. Wage growth accelerated, particularly in services, logistics, and healthcare. While higher wages support consumption, they also increase costs for businesses, contributing to a wage-price spiral in some economies.
Inflation Across Regions
Advanced Economies
The United States, Europe, and parts of East Asia experienced inflation levels not seen in 30–40 years. Housing rents, healthcare, education, and services became major inflation drivers. Central banks responded aggressively by raising interest rates at the fastest pace in decades, aiming to cool demand and restore price stability.
Emerging and Developing Economies
Emerging markets faced a double burden: rising domestic inflation and currency depreciation against the US dollar. Higher import costs for fuel, food, and raw materials intensified inflationary pressures. For low-income countries, inflation translated into food insecurity and increased poverty, highlighting the unequal global impact of rising prices.
Impact on Households and Businesses
Cost of Living Crisis
For households, inflation has significantly reduced purchasing power. Essentials such as food, fuel, housing, and utilities have become more expensive, forcing consumers to cut discretionary spending. Middle- and lower-income families are disproportionately affected, as they spend a larger share of income on basic necessities.
Business Challenges
Businesses face rising input costs, higher borrowing expenses, and uncertain demand. Profit margins are under pressure, particularly for small and medium enterprises that lack pricing power. Companies are increasingly focusing on cost efficiency, automation, and pricing strategies to survive in an inflationary environment.
Central Bank Response and Policy Dilemmas
Central banks around the world have responded by tightening monetary policy through interest rate hikes and balance sheet reductions. While higher rates help curb inflation, they also slow economic growth and increase the risk of recession.
Policymakers face difficult trade-offs:
Raise rates aggressively and risk economic slowdown.
Ease too early and allow inflation to become entrenched.
Manage public debt, which becomes more expensive as interest rates rise.
This delicate balance has made inflation control one of the most complex economic challenges in recent history.
Is This a New Era of High Prices?
Many economists believe the world may be entering a period of structurally higher inflation compared to the pre-pandemic era. Several long-term factors support this view:
De-globalization and supply chain diversification
Energy transition costs
Aging populations and labor shortages
Increased defense and climate-related spending
Persistent geopolitical uncertainty
However, others argue that inflation will moderate once supply chains normalize and monetary tightening takes full effect. The future likely lies somewhere in between—lower than peak levels, but higher and more volatile than in the past decade.
Opportunities in an Inflationary World
Despite its challenges, inflation also reshapes economic opportunities:
Investors turn toward real assets like commodities, real estate, and inflation-linked bonds.
Businesses that can pass on costs or innovate gain competitive advantages.
Governments prioritize domestic manufacturing and strategic industries.
Financial markets evolve with new hedging and risk-management strategies.
Conclusion
The global inflation surge marks a turning point in the world economy. What began as a temporary post-pandemic shock has evolved into a complex and persistent challenge shaped by structural, geopolitical, and demographic forces. Whether inflation settles at moderate levels or defines a new era of high prices will depend on policy responses, global cooperation, and economic adaptation.
For households, businesses, investors, and policymakers alike, understanding inflation is no longer optional—it is essential. The world is adjusting to a reality where price stability can no longer be taken for granted, signaling a profound shift in the global economic landscape.
Alpha Capture Through Earnings SurprisesUnderstanding Alpha and Earnings Surprises
Alpha represents returns above a benchmark (like the Nifty 50 or S&P 500) after adjusting for risk. If the index gives 12% and your strategy gives 18% with similar risk, that extra 6% is alpha.
An earnings surprise occurs when a company’s reported earnings (EPS or profits) differ materially from analyst expectations. These expectations are not casual guesses—they’re baked into prices through forecasts, models, options pricing, and institutional positioning.
Positive earnings surprise: Actual earnings > Expected earnings
Negative earnings surprise: Actual earnings < Expected earnings
The key insight: markets often underreact or overreact to earnings surprises, and that behavioral inefficiency creates tradable opportunities.
Why Earnings Surprises Move Markets
Stock prices are forward-looking. By the time earnings are announced, much of the “known” information is already priced in. What moves the stock is new information.
Earnings surprises deliver exactly that:
New data on profitability
Updated signals about demand, margins, and costs
Management commentary on future guidance
A strong earnings beat doesn’t just say “this quarter was good”—it often forces analysts to revise future estimates upward. That repricing process takes time, which is where alpha lives.
The Post-Earnings Announcement Drift (PEAD)
One of the most well-documented anomalies in finance is Post-Earnings Announcement Drift (PEAD).
What it means:
Stocks with positive earnings surprises tend to continue rising for weeks or months
Stocks with negative surprises tend to continue falling
This directly contradicts the Efficient Market Hypothesis, which assumes prices instantly reflect all information.
Why does PEAD exist?
Institutional investors adjust positions gradually
Analysts revise forecasts slowly
Behavioral biases delay full price discovery
Risk managers scale exposure over time, not instantly
This slow digestion of information allows traders and investors to ride the trend.
Types of Earnings Surprise Strategies
1. Earnings Momentum Strategy
This strategy focuses on stocks that consistently beat earnings expectations.
Core logic:
Companies that beat once are more likely to beat again
Strong operational momentum persists
Traders rank stocks based on:
Size of earnings surprise
Frequency of past beats
Strength of guidance
Positions are taken long in strong beaters and short in consistent underperformers.
2. Short-Term Earnings Reaction Trades
This is more tactical and event-driven.
Approach:
Trade immediately after earnings announcement
Capture sharp price movement over 1–5 days
Key signals:
Gap-up with high volume after a beat
Gap-down breakdown after a miss
The trick here is not the earnings number alone, but how the market reacts to it.
3. Earnings Surprise + Valuation Filter
Not all earnings beats are equal.
A company trading at:
Reasonable valuation + earnings beat = sustainable upside
Extremely high valuation + small beat = risk of sell-off
Combining surprise data with valuation metrics (P/E, EV/EBITDA) improves risk-adjusted returns.
4. Earnings Surprise with Guidance Analysis
Often, guidance matters more than reported earnings.
Scenarios:
Earnings beat + raised guidance → very bullish
Earnings beat + cautious guidance → mixed reaction
Earnings miss + strong guidance → potential reversal
Sophisticated traders focus on forward-looking statements, not just historical numbers.
Measuring Earnings Surprises
Professionals don’t rely on headlines. They use precise metrics:
Standardized Unexpected Earnings (SUE)
(Actual EPS – Expected EPS) / Standard deviation of EPS estimates
Revenue Surprise
Often more important in growth stocks
Margin Surprise
Indicates pricing power and cost control
Large positive SUE values tend to produce stronger post-earnings drift.
Behavioral Finance Angle
Earnings surprise strategies work because humans are involved.
Common biases:
Anchoring: Investors stick to old price targets
Confirmation bias: Ignoring bad news for favorite stocks
Overconfidence: Analysts slow to admit forecast errors
Herd behavior: Institutions wait for consensus before acting
These biases delay price adjustment, allowing alpha to persist.
Role of Options and Volatility
Earnings announcements are volatility events.
Before earnings:
Implied volatility rises
Options become expensive
After earnings:
Volatility collapses (IV crush)
Advanced alpha strategies:
Buy stock + sell expensive options
Trade post-earnings directional moves once uncertainty clears
Use straddles/strangles when surprise magnitude is expected to be large
Options markets often reveal expectations, helping traders anticipate surprise risk.
Risks in Earnings Surprise Trading
This strategy is powerful—but not easy money.
Key risks:
False breakouts after earnings
One-time gains masking weak core business
Market-wide risk-off events overpowering company results
Liquidity traps in small-cap stocks
Earnings surprises work best when:
Market trend supports the trade
Liquidity is strong
Risk management is strict
Stop losses and position sizing are non-negotiable.
Earnings Surprises in Emerging Markets (India Context)
In markets like India:
Information asymmetry is higher
Analyst coverage varies widely
Retail participation increases volatility
This actually enhances earnings surprise alpha, especially in mid-cap and small-cap stocks.
However:
Corporate governance risk must be filtered
One-off accounting gains should be excluded
Promoter commentary carries outsized influence
Smart traders combine earnings data with balance-sheet quality and cash-flow analysis.
Building a Sustainable Alpha Model
A robust earnings surprise alpha framework includes:
Clean earnings data
Analyst expectation tracking
Surprise magnitude ranking
Volume and price confirmation
Risk filters (market trend, sector strength)
Alpha is not captured from one trade—it’s harvested over many disciplined repetitions.
Final Thoughts
Alpha capture through earnings surprises works because markets are human systems, not perfect machines. Even with advanced algorithms and instant news, information takes time to be fully absorbed, interpreted, and acted upon.
Earnings surprises sit at the intersection of:
Fundamental truth
Market expectations
Human psychology
For traders and investors who respect data, manage risk, and understand behavior, earnings season is not chaos—it’s opportunity.

Financial Freedom Through Euro–Dollar DynamicsThe Euro–Dollar Relationship: A Global Financial Barometer
The EUR/USD pair represents the exchange rate between the euro (used by the Eurozone) and the U.S. dollar (the world’s primary reserve currency). Together, these two economies account for a significant share of global GDP, trade, and investment flows. As a result, EUR/USD reflects more than currency strength—it mirrors global economic confidence, monetary policy divergence, and geopolitical stability.
When the U.S. economy outperforms Europe, capital flows toward dollar-denominated assets, strengthening the USD and pushing EUR/USD lower. Conversely, when the Eurozone shows resilience or the Federal Reserve adopts a dovish stance, the euro strengthens. For individuals seeking financial freedom, understanding these shifts helps identify where money is moving—and how to position alongside it.
Interest Rates: The Core Driver of Currency Wealth
At the heart of Euro–Dollar dynamics lie interest rates, set by the European Central Bank (ECB) and the U.S. Federal Reserve (Fed). Interest rate differentials determine where global investors park their money.
Higher U.S. rates attract capital into U.S. bonds and equities, strengthening the dollar.
Higher European rates improve euro demand and reduce dollar dominance.
For traders, this creates long-term trends that can last months or even years. Riding these trends—rather than chasing short-term noise—can generate consistent returns. For investors, understanding rate cycles helps in allocating capital between U.S. stocks, European equities, bonds, and currency-hedged instruments.
Financial freedom is rarely built through random trades; it is built by aligning with long-duration macro trends, and interest rate policy is one of the most reliable trend drivers.
Inflation, Purchasing Power, and Real Wealth
Inflation erodes purchasing power, silently damaging long-term financial security. The Euro–Dollar dynamic reflects how well each region controls inflation relative to growth.
If U.S. inflation is high and the Fed lags in response, the dollar may weaken.
If Europe faces energy-driven inflation shocks, the euro may depreciate.
For individuals, this matters because currency value affects real wealth. Income earned in a weakening currency loses global purchasing power, while assets held in a stronger currency preserve or enhance wealth.
Many financially independent individuals diversify income streams across currencies—earning in one currency while investing in another. Understanding EUR/USD trends helps protect savings from inflation and currency depreciation, a crucial but often overlooked step toward financial freedom.
Trading EUR/USD as a Tool for Income Independence
The Euro–Dollar pair is the most liquid currency pair in the world. High liquidity means tighter spreads, lower transaction costs, and smoother price action—ideal conditions for traders aiming to build consistent income streams.
From a financial freedom perspective:
Day traders benefit from predictable volatility during London–New York overlap.
Swing traders exploit macro themes like rate hikes, inflation data, and policy guidance.
Position traders ride multi-month trends driven by monetary cycles.
Unlike equities, forex markets operate nearly 24 hours a day, allowing flexibility for those balancing trading with jobs or businesses. While trading carries risk, disciplined EUR/USD trading—supported by macro understanding—can evolve into a scalable income source, supporting location-independent lifestyles.
Euro–Dollar Dynamics and Global Asset Allocation
Financial freedom is not only about earning more—it’s about allocating capital wisely. EUR/USD movements influence global asset performance:
A strong dollar often pressures emerging markets and commodities.
A weak dollar supports risk assets, global equities, and alternative investments.
Euro strength benefits European exporters and regional stock indices.
By tracking Euro–Dollar trends, investors can adjust portfolios proactively—reducing drawdowns and enhancing long-term returns. This macro-aware allocation reduces reliance on any single market or economy, making wealth more resilient.
Psychological Freedom Through Macro Understanding
One underrated aspect of financial freedom is psychological stability. Many retail investors panic during volatility because they lack context. Understanding Euro–Dollar dynamics provides that context.
When markets move sharply after central bank meetings, inflation reports, or geopolitical events, informed individuals recognize these moves as part of larger cycles—not random chaos. This clarity reduces emotional decision-making, improves discipline, and builds confidence—key traits of financially independent thinkers.
Business, Remittances, and Cross-Border Opportunities
For entrepreneurs, freelancers, and international workers, EUR/USD impacts:
Export and import costs
Overseas earnings
Profit margins on global contracts
Those who understand currency dynamics can time conversions, hedge exposure, or price services strategically. Over time, these small optimizations compound into significant financial advantages—another pathway to independence beyond traditional employment.
Risks and Responsible Use of Currency Dynamics
While Euro–Dollar dynamics offer opportunities, financial freedom requires risk awareness. Leverage misuse, overtrading, and ignoring macro shifts can quickly destroy capital. True freedom comes from risk-adjusted growth, not reckless speculation.
Successful participants treat EUR/USD as a strategic tool—not a gamble—combining technical analysis, macro data, and strict risk management.
Conclusion: Aligning With Global Money Flow
Financial freedom in the modern world is no longer confined to saving salaries or investing locally. It is about understanding how global money moves—and positioning oneself accordingly. The Euro–Dollar dynamic stands at the center of this global system, reflecting interest rates, inflation, economic confidence, and political stability.
By mastering EUR/USD dynamics, individuals gain more than trading profits or investment returns. They gain insight, flexibility, and control over their financial destiny. Whether through trading, investing, currency diversification, or global business, aligning with Euro–Dollar trends can transform money from a source of stress into a tool for long-term independence.
In essence, financial freedom is not about predicting every market move—it is about understanding the forces that shape them. And few forces are as powerful, persistent, and revealing as the Euro–Dollar relationship.
