Nifty possible roadmap for today & tomorrowIn 30 mins timeframe, Nifty 50 making irregular flat correction.
Wave B crosses starting point on upside and fall today. This fall possibly will come in impulse and finish below 24919 level. and then possible upmove again for 24450+.
X-indicator

Elliott Wave Analysis XAUUSD – January 30, 2025
1. Momentum
Weekly timeframe (W1)
Weekly momentum is currently rising. With this condition, the market is likely to continue moving higher or remain sideways for at least the next 1–2 weeks.
Daily timeframe (D1)
Daily momentum is currently declining. This suggests that over the next 1–2 days, price may continue to fall or move sideways until D1 momentum reaches the oversold zone.
H4 timeframe
H4 momentum is compressed and overlapping in the oversold area. This indicates that the current bearish or sideways phase may continue, however, the probability of a bullish reversal on H4 is relatively high.
2. Wave Structure
Weekly Wave Structure (W1)
On the weekly chart, the five-wave structure (1–2–3–4–5) in blue is still forming.
Yesterday, price experienced a strong decline. However, to confirm that blue wave 5 has completed, price needs to produce a bearish close below the 4282 level.
At the moment, since W1 momentum remains bullish, this decline is more likely a corrective move within blue wave 5, rather than a completed top.
Daily Wave Structure (D1)
Daily momentum is declining, therefore price may continue to move lower or sideways for another 1–2 days until D1 momentum reaches oversold conditions.
Within the context of blue wave 5, price is likely forming yellow wave 4, which belongs to the internal 1–2–3–4–5 yellow structure of blue wave 5.
Once yellow wave 4 is completed, price is expected to resume its advance to form yellow wave 5, thereby completing blue wave 5.
From the RSI perspective, the previous rally reached extremely overbought conditions. This suggests that buying pressure remains strong enough to support at least one more push to a new high, potentially accompanied by bearish divergence at the top. This further supports the scenario that yellow wave 5 will form, and that the market is currently in yellow wave 4.
H4 Wave Structure
The current decline has already reached the 0.382 Fibonacci retracement of yellow wave 3.
From a momentum standpoint, D1 momentum is still declining, so in the near term, another 1–2 days of decline or sideways movement remain possible. Meanwhile, H4 momentum is compressed in the oversold zone, indicating a high probability of a bullish reversal on H4.
Therefore, the most likely scenario is continued sideways movement on H4, or a minor continuation lower before a bullish reaction develops.
RSI from the prior bullish leg remains in a strongly overbought condition, reinforcing the idea that the current decline is corrective in nature, and that the market may still form a new high afterward.
3. Trading Plan
Swing setups:
At this stage, there are no attractive swing positions, as the market is currently in the late phase of an extended wave, where price behavior becomes difficult to predict.
Additionally, today is Friday and also the monthly candle close, which significantly increases volatility risk. The appropriate approach is to remain patient and observe, waiting for D1 momentum to reach the oversold zone, at which point higher-probability swing setups can be considered.

NIFTY 25000 PE GOOD TO BUY“Expecting Nifty to fall.”
SAFE TO ENTER ONLY ABOEV THIS ZONE
“Nifty is expected to move down.”
“Bearish view on Nifty.”
NLong

Premium Chart Pattern Limitations
No Guarantees: Patterns only indicate probabilities, not certainties.
False Signals: Markets can generate fake breakouts or pattern failures.
Subjectivity: Interpretation can vary among traders.
Context Matters: Patterns work best with trend confirmation and other technical indicators like RSI, MACD, and moving averages.

XAUUSD – H1 volatility surge | liquidity reset ongoingMarket Context
Gold is entering a high-volatility phase after an extended bullish run. The recent sharp impulse down from the upper zone is not random — it reflects liquidity distribution and aggressive profit-taking near highs, amplified by fast USD flows and event-driven positioning.
In this environment, Gold is no longer trending smoothly. Instead, it is rotating between liquidity zones, creating two-way risk intraday.
➡️ Key mindset: trade reactions at levels, not direction.
Structure & Price Action (H1)
The prior bullish structure has been temporarily broken by a strong bearish impulse.
Price failed to hold above 5,427 – 5,532, confirming this area as active supply / distribution.
The move down shows range expansion, typical after ATH phases.
Current price action suggests rebalancing and liquidity search, not a confirmed macro reversal yet.
Key read:
👉 Above supply = rejection
👉 Below supply = corrective / bearish bias until proven otherwise
Trading Plan – MMF Style
🔴 Primary Scenario – SELL on Pullback (Volatility Play)
While price remains below key supply, selling reactions is favored.
SELL Zone 1: 5,427 – 5,432
(Former demand → supply flip + trendline rejection)
SELL Zone 2: 5,301 – 5,315
(Mid-range supply / corrective retest)
Targets:
TP1: 5,215
TP2: 5,111
TP3: 5,060
Extension: 4,919 (major liquidity pool)
➡️ Only SELL after clear rejection / bearish confirmation.
➡️ No chasing breakdowns.
🟢 Alternative Scenario – BUY at Deep Liquidity
If price sweeps lower liquidity and shows absorption:
BUY Zone: 4,920 – 4,900
(Major demand + liquidity sweep zone)
Reaction targets:
5,060 → 5,215 → 5,300+
➡️ BUY only if structure stabilizes and bullish reaction appears.
Invalidation
A clean H1 close back above 5,432 invalidates the short-term bearish bias and shifts focus back to bullish continuation.
Summary
Gold is transitioning from trend extension to volatility expansion.
This is a market for discipline and level-based execution, not prediction.
MMF principle:
Volatility = opportunity, but only for those who wait for reaction.
Trade the levels. Control risk. Let price confirm.

XAUUSD Full Technical Analysis (Multi-Timeframe View)Market Structure:
Gold has shifted from a strong bullish impulse into a corrective bearish phase on the lower timeframes. After rejecting from the 5600–5580 supply zone, price formed a clear Change of Character (ChoCH) followed by multiple Bearish Breaks of Structure (BOS), confirming short-term trend weakness. The impulsive selloff toward 5110 indicates aggressive profit booking and institutional distribution from higher levels.
Trend & Momentum:
On the 5-minute chart, price remains below key dynamic resistances (EMA cluster & VWAP), which keeps the intraday bias bearish. Momentum has slowed near 5230–5240, where price is consolidating inside a demand zone with visible volume support, suggesting short-term stabilization but not yet a confirmed reversal. Any bullish move from here is currently corrective unless structure changes.
Key Levels:
Immediate Resistance: 5280 → 5320 → 5415
Major Supply Zone: 5450–5500
Immediate Support: 5230 → 5200
Major Demand: 5110–5050
Scenarios:
Bullish Case: A sustained break and acceptance above 5280–5300, followed by a BOS, could open a recovery toward 5415 and possibly 5450. This would signal buyers regaining short-term control.
Bearish Case (Preferred): Failure to reclaim 5280 keeps price vulnerable to another selloff toward 5200, and a breakdown below 5110 would expose 5050–5000 next.
Conclusion:
Overall bias remains bearish to neutral in the short term, with current price action suggesting a pause or corrective bounce rather than trend reversal. Traders should wait for structure confirmation—either a bullish BOS above resistance for longs or rejection from resistance to continue selling rallies. Patience is key until the market shows clear intent.

PIRAMALFIN 1 Day View 📌 Current Price (Live NSE)
• ~₹1,750.30 (down ~‑2.16%)
• Day Low ~₹1,741.00
• Day High ~₹1,779.90
📊 Daily Pivot Levels (Classic)
(calculated from previous trading session price range)
Level Value
Pivot Point (PP) ₹1,776.93
Resistance 1 (R1) ₹1,838.37
Resistance 2 (R2) ₹1,882.83
Resistance 3 (R3) ₹1,944.27
Support 1 (S1) ₹1,732.47
Support 2 (S2) ₹1,671.03
Support 3 (S3) ₹1,626.57
📌 Intraday Interpretation (1D TF)
Bullish if:
✔ Price holds above Pivot ~₹1,777
✔ Break above R1 ~₹1,838 signals stronger upside bias
Bearish if:
🔻 Price stays below Pivot ~₹1,777
🔻 Break below S1 ~₹1,732 could open slide toward S2/S3 levels
Today’s trading bias (current):
• Price below pivot — short‑term bearish/neutral tone intraday
• Key support to watch: ₹1,732 → ₹1,671 zone
📈 Other Intraday Technicals (from recent session)
• RSI (short‑term) around ~58 (neutral/upper range)
• EMA/SMA 20 day near ~1,772–1,783 — acting as dynamic resistance area
• Volume & range suggest typical NBFC trading volatility today.

GROWWGROWW
bullish trend is Showing on the chart.
buy signals in
technical indicators and
cup with handle & ascending triangle chart pattern.
BUYING RANGE 165/170
Watch for a breakout above 170/175 to sustain the bullish trend. If the resistance holds, there could be a retest towards 150/155and an uptrend from here.


TATASTEELTATASTEEL
bullish trend is Showing on the chart.
buy signals in
technical indicators and
cup with handle chart pattern.
BUYING RANGE 180/185
Watch for a breakout above 180/185 to sustain the bullish trend. If the resistance holds, there could be a retest towards 160/165 and an uptrend from here.

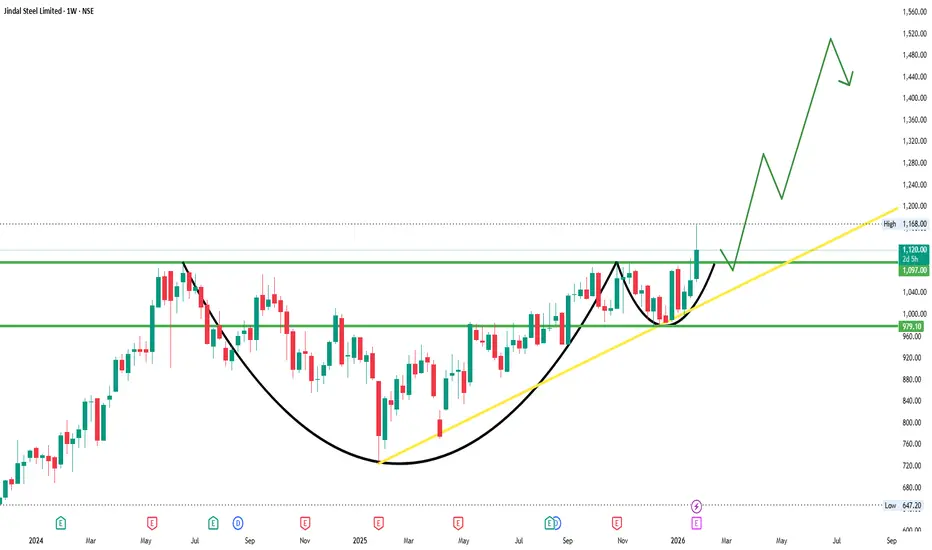
JINDALSTELJINDALSTEL
bullish trend is Showing on the chart.
buy signals in
technical indicators and
cup with handle & ascending triangle chart pattern.
BUYING RANGE 1090/1100
Watch for a breakout above 1090/1100 to sustain the bullish trend. If the resistance holds, there could be a retest towards 975/980 and an uptrend from here.
ALKEMALKEM
bullish trend is Showing on the chart.
buy signals in
technical indicators and
cup with handle & ascending triangle chart pattern.
BUYING RANGE 5860/5870
Watch for a breakout above 5860/5870 to sustain the bullish trend. If the resistance holds, there could be a retest towards 5380/5400 and an uptrend from here.

MAZDOCKMAZDOCK
bullish trend is Showing on the chart.
Descending Triangle chart pattern.
INVESTORS MAY ACCUMULATE AT CURRENT LEVELS
100 WEMA SUPPORT
BUYING RANGE 2500/2525
Watch for a breakout above 2630/2650 to sustain the bullish trend. If the resistance holds, there could be a retest towards 2200/2250 and an uptrend from here.

NIFTY KEY LEVELS FOR 30.01.2026NIFTY KEY LEVELS FOR 30.01.2026
Timeframe: 3 Minutes
If the candle stays above the pivot point, it is considered a bullish bias; if it remains below, it indicates a bearish bias. Price may reverse near Resistance 1 or Support 1. If it moves further, the next potential reversal zone is near Resistance 2 or Support 2. If these levels are also broken, we can expect the trend.
When a support or resistance level is broken, it often reverses its role; a broken resistance becomes the new support, and a broken support becomes the new resistance.
If the range(R2-S2) is narrow, the market may become volatile or trend strongly. If the range is wide, the market is more likely to remain sideways
please like and share my idea if you find it helpful
📢 Disclaimer
I am not a SEBI-registered financial adviser.
The information, views, and ideas shared here are purely for educational and informational purposes only. They are not intended as investment advice or a recommendation to buy, sell, or hold any financial instruments.
Please consult with your SEBI-registered financial advisor before making any trading or investment decisions.
Trading and investing in the stock market involves risk, and you should do your own research and analysis. You are solely responsible for any decisions made based on this research.

Nifty50 analysis(30/1/2026).CPR: wide + overlapping cpr: range day.
FII: -393.97 sold
DII: 2,638.76 bought.
Highest OI: 25500 put oi. and 25300 and 25200 call oi.
P.C.R: 1 bearish.
Resistance:25500.
Support : 25200
Event: Budget on Feb. 1
conclusion: bullish but retest is highly possible.
My pov:
1.market opens with gap down almost 100 points.
2.until 25200 is crossed below down only bullish pov.
3.IN one hour candle if it takes support at 50ma (red line ) from there the bullish trend continues.
4. budget is highly a anticipated event so uncertanity highly present trade accodingly. anything can happen on monday. wait until event is closed.
What IF:
1.if price breaks 25200 and 25450 closed in day candle then overall trend bearish
psychology fact:
Fight like you deserve to win, but don’t focus on the outcome.
note:
8moving average ling is blue colour.
20moving average line is green colour
50moving average line is red colour.
200moving average line is black colour.
cpr is for trend analysis.
MA line is for support and resistance.
Disclaimer:
Iam not Sebi registered so i started this as a hobby, please do your own analysis, any profit/loss you gained is not my concern. I can be wrong please do not take it seriously thank you.

#NIFTY Intraday Support and Resistance Levels - 30/01/2026Nifty is expected to open on a flat note, indicating indecision after the recent recovery from lower levels. The index is currently trading around the 25420–25450 zone, which has emerged as an immediate resistance area. A flat opening near this region suggests that the market is entering a consolidation phase, where buyers and sellers are evenly matched. Early session movement may remain choppy as participants wait for a clear directional trigger.
Technically, the broader structure of Nifty has improved after holding strong support near 25000–25200 and bouncing back sharply. This recovery has shifted the short-term trend from bearish to neutral-to-positive. However, the zone between 25450 and 25550 remains a crucial supply area. Until Nifty gives a decisive breakout above this range, upside momentum may stay limited and profit booking can appear near higher levels.
On the upside, a sustained move above 25250–25300 keeps the bullish bias intact for intraday trades. If the index manages to break and hold above 25550, it can trigger fresh long positions with upside targets of 25650, 25700, and potentially 25750+ in extension. Such a breakout would indicate strength and continuation of the recovery move, especially if supported by good volume and broader market participation.
On the downside, failure to sustain above 25400–25450 can lead to a short-term reversal. A rejection from this resistance zone may drag Nifty back toward 25350 and 25300 initially. If selling pressure increases and the index slips below 25200, the downside may extend toward 25100, 25050, and even the psychological 25000 level. The 25000–25050 zone remains a strong demand area where buyers are expected to defend aggressively.
Overall, Nifty is currently placed in a consolidation range with clearly defined support and resistance levels. Traders should avoid aggressive positions during the opening phase and wait for a confirmed breakout or breakdown. Range-bound strategies with strict stop-losses can work better in such conditions, while trend trades should only be taken after a clear move beyond the key levels. Discipline and patience will be crucial as volatility may expand once the consolidation resolves.

#BANKNIFTY PE & CE Levels(30/01/2026)Bank Nifty is expected to open on a flat note, indicating a pause after the recent sharp upside move. The index is currently hovering near the 59950–60000 zone, which is acting as an important decision-making area. A flat opening around this range suggests that the market is digesting recent gains and waiting for confirmation before choosing the next direction. Early session price action may remain range-bound, with whipsaws possible near key intraday levels.
From a technical perspective, Bank Nifty has shown strong bullish momentum over the last few sessions, recovering sharply from lower support zones near 59000–59200. This bounce reflects aggressive buying interest and short covering, which has helped the index reclaim crucial resistance levels. However, the zone around 60000–60050 remains a major supply area. Unless the index sustains above this level with strong volumes, upside continuation may face temporary hurdles.
On the bullish side, if Bank Nifty manages to hold above 59550–59600 and shows strength above 60050, fresh long positions can be considered. A sustained move above 60050 may open the path for upside targets of 60250, 60350, and potentially 60450+ in extension. Traders should look for a strong 15-minute close above resistance to avoid false breakouts. Partial profit booking near each target is advisable, given the recent sharp rally.
On the bearish or corrective side, rejection near the 60000–60050 zone can lead to profit booking. If Bank Nifty slips below 59950–59900, short-term weakness may emerge, dragging the index toward 59750 and 59650. Further breakdown below 59450 would indicate a deeper correction, with downside targets around 59250, 59150, and 59050. The 59000–59050 zone remains a strong support area, where buyers are expected to re-enter if the decline is gradual.
Overall, the structure remains bullish as long as Bank Nifty holds above 59500, but the current flat opening hints at consolidation rather than an immediate trending move. Traders should remain patient in the opening hour, avoid chasing prices, and focus on clear break-and-sustain setups. Strict stop-loss management and disciplined execution will be crucial, as volatility may increase once the range resolves in either direction.

NIFTY 50 30/01/2026 IDEA INTRADAYKey Observations:
PCR: 0.98 → Neutral to slightly bullish, no extreme positioning
ATM IV: 15.43 → Low volatility, favoring range or breakout trades
Max Pain: 25,350 → Index likely to stay above this zone
Expiry: 4 days → Expect time decay and range compression
Support & Resistance Levels:
Immediate Resistance: 25,414 → 25,485 (R1–R2 zone)
Major Resistance: 25,598 (R3 – supply zone)
Immediate Support: 25,300 (Pivot)
Strong Support: 25,229 → 25,116
Trade Plan (Index View):
Bullish above 25,420: Targets 25,485 / 25,550
Rejection near 25,480–25,500: Expect pullback to 25,300
Break below 25,300: Weakness towards 25,230–25,120

Market Outlook & Trade Setup – Friday, 30th January 2025Major indices showed a sharp recovery yesterday and even crossed the opening day high. Silver and Gold has corrected by more than 6% overnight so some selling pressure could be seen.
We have the Budget on Sunday, 1st Feb, 2026, so heavy positions might not be build in the market today.
🔹 NIFTY
* Previous Close: 25,418
* Expected Range: 25,000 – 25,500
🔹 SENSEX
* Previous Close: 82,566
* Expected Range: 82,500 - 82,600
🌍 Global & Market Sentiment
* DJIA: +55 | S&P: -9
💰 Institutional Activity (Cash Market)
* FII: Net Sellers: - ₹ 394 Cr
* DII: Net Buyers: + ₹ 2639 Cr
🔥 Events this Week: US --- Trump Speech & FED Rate announcement
📌 Sectoral Focus
Metal, Energy
👉 Commodities in Focus: Gold, Silver, Copper, Crude, Natural Gas
💯 Important Quarterly Results: Cupid, GHCL, HUDCO, IEX, ITC,REC, Voltas
📈 Trade smart. Manage risk. Stay disciplined.

#ETH ON THE EDGE DELTAIN:ETHUSD.P
ETH is on the edge of the cliff. If it breaks below this level, we can see a significant downward move to $2200 easily and worst case of $1500 & $1400.
Long term investors can accumulate on the supports. Follow me for more.
This indicator is provided for educational and informational purposes only.
It does not constitute financial advice, investment recommendations, or trade signals.
The creator and Systematic Traders Club are not responsible for any financial losses resulting from the use of this indicator.
Trading and investing involve risk. Always do your own analysis and use proper risk management.

GOLD respecting 200EMA on 45MIN chart + strong support of 5100 GOLD respecting 200EMA on 45MIN chart + strong support of 5100 DOUBLE Confirmation !

MPWR: Break above a key zone, the retest decides if it’s realMPWR still shows an upward structure: pullbacks look more like pauses than a broken trend.
The area around ~1,111 is the visible decision zone. Above it, price recently accelerated.
Key detail: the breakout has already been retested. This is where the market proves acceptance.
As long as price stays above that zone, this reads like continuation after consolidation, not a random spike.
If price drops back below the zone and holds there, the logic shifts toward a failed breakout and a return into the prior range.
Chartnes Silent Flow is active here. I treat that as “continuation is favored,” not a promise.
This remains a probability setup: retests can hold, but they can also be the last test before a deeper pullback.

Silver respecting 200 EMA on 45MIN chartSilver respecting 200 EMA on 45MIN chart perfect example of Bullmarket corrections are fast & furious.
