Gold Trend and Scalping Strategy for 26th January 2026🟡 GOLD TRADING PLAN (Intraday)
📈 TREND TRADING STRATEGY
🔔 BUY SETUP
💲 Buy Above: High of 30-minute candle
📌 Condition: Candle must close above 5019
🎯 Targets:
Target 1: 5029
Target 2: 5039
Target 3: 5049
🛑 Stop Loss:
Below the 30-minute candle low or as per your risk management
📊 Logic:
Sustained price action above 5019 confirms bullish momentum
Suitable for trend-following traders
🔔 SELL SETUP
💲 Sell Below: Low of 1-hour candle
📌 Condition: Candle must close below 4963
🎯 Targets:
Target 1: 4953
Target 2: 4943
Target 3: 4933
🛑 Stop Loss:
Above the 1-hour candle high
📊 Logic:
Breakdown below 4963 confirms bearish continuation
Ideal for positional intraday trend trades
⚡ SCALPING STRATEGY
🔻 SCALPING SELL
📌 Area: Around 5019 resistance zone
🔔 Entry Rule:
Price moves near 5019,
15-minute candle gets rejected (wick / strong selling pressure),
Sell below the low of the rejected 15-min candle
🛑 Stop Loss:
Above the high of the rejected candle
🎯 Profit Booking:
5 to 10 points, OR
Trail stop loss for extended move
📊 Logic:
5019 acts as a strong supply zone
Best for quick momentum scalps
🔺 SCALPING BUY
📌 Area: Around 4963 support zone
🔔 Entry Rule:
Price approaches 4963,
15-minute candle shows rejection / buying support,
Buy above the high of the rejected candle
🛑 Stop Loss:
Below the low of the rejected candle
🎯 Profit Booking:
5 to 10 points, OR
Trail stop loss
📊 Logic:
4963 acts as a demand zone
Suitable for support-based scalping
⚠️ DISCLAIMER
🚫 This content is only for educational purposes
🚫 Not a buy/sell recommendation
🚫 Trading involves high risk
🚫 Please consult your financial advisor before trading
🚫 Trade strictly with proper risk management
X-indicator

inverser head and shoulder stock is showing inver head and sholder
prise closed above vwap
rsi is crosing 20 ema good position

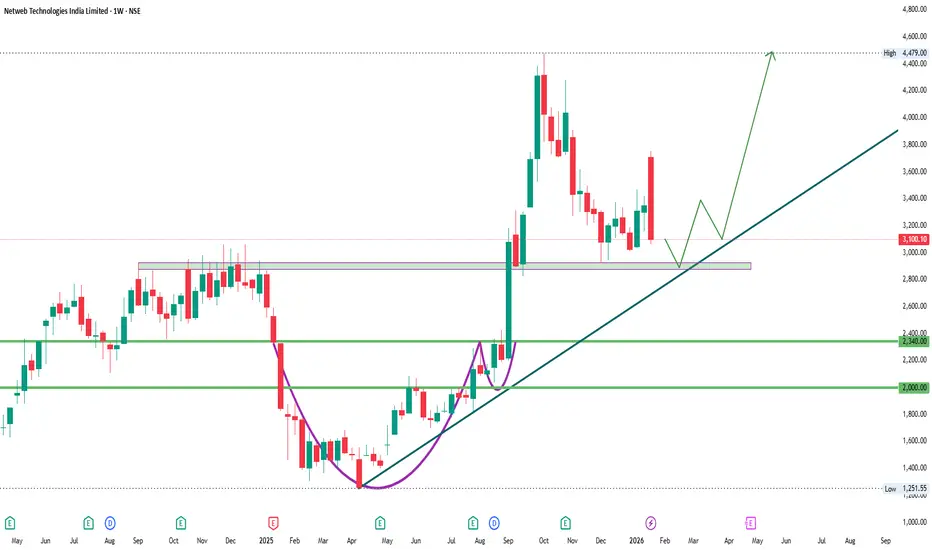
V2 Retail - Multibagger Stock not to miss for 5x ROIV2 Retail - Multibagger Stock not to miss for 5x ROI in coming 7-8 Years.
Fundamentals:
Company has delivered good profit growth of 84% CAGR over last 5 years
Company has delivered good profit growth of 40% CAGR over last 10 years
Median sales growth is 33.3% of last 10 years
Technical:
Stock has recently broken from Monthly CUP Pattern. Stock is in continuous uptrend.
LTP - 1826
Targets - 9000+
Timeframe - 7-8 Years
Happy Investing.

Minda Corp | Post-Rally Consolidation | Caution ZoneMinda Corp has delivered a massive long-term uptrend, but price is now showing loss of momentum near the highs, forming a contracting / volatile structure.
This phase typically indicates distribution or extended consolidation, not fresh trend initiation.
🔍 Technical Read:
• Strong multi-year rally already played out
• Price struggling near overhead supply zone
• Lower highs forming inside a volatile range
• Increased volatility → risk expanding
📈 What This Means:
• Not an ideal fresh long zone
• Suitable for partial / full profit booking
• Fresh entries only after clear range breakout with volume
• Breakdown may lead to deeper mean reversion
📌 Status: ⚠️ Extended & Deciding Zone
👉 Protect profits. Wait for clarity.
⚠️ Educational view only. Not a recommendation.
#MindaCorp #ProfitBooking #DistributionPhase #StockMarketIndia #TechnicalAnalysis #SwingTrading #RiskManagement #PriceAction

BEL | Range-Bound Structure | Deciding ZoneBharat Electronics is currently trading inside a rising consolidation pattern, with price respecting both ascending trendline support and overhead supply zone.
Momentum has cooled after the prior rally, indicating a pause phase rather than trend reversal.
🔍 Technical Observations:
• Higher-low structure intact
• Price compressing between trendline support & declining resistance
• Volatility contraction → expansion likely next
• Volume neutral – waiting for trigger
📈 What to Watch:
• Break & close above range → Trend continuation
• Break below trendline → Deeper pullback / retest zone
📌 Current Status: ⚖️ Deciding Zone
👉 Patience > Prediction
⚠️ Educational view only. Not a buy/sell recommendation.
#BEL #BharatElectronics #DecidingZone #RangeBound #StockMarketIndia #TechnicalAnalysis #PriceAction #SwingTrading

USDJPY 4HR T/F ANALYSIS -----
usdjpy 4hr t/f ----- breakdown of curve support which name is black mind curve after breakdown we can measure previous pattern now current scenario previous supply can measure so we can go with trend into down side until supply will not complete /
after supply complete we can see any positive candle on retesting area then we can see demand on retesting then we can go with trend _ remember trend are over all bullish ok ----

Cummins India cmp 3930.40 by Daily Chart viewCummins India cmp 3930.40 by Daily Chart view
- Support Zone 3885 to 3965 Price Band
- Resistance Zone 4165 to 4250 Price Band
- Support Zone reversal observed for stock price
- Volumes need to increase to push price on upside trend
- Price consolidation seen within 3885 to 4110 since mid Jan 2026

Dhampur Bio Organics cmp 95.76 by Daily Chart viewDhampur Bio Organics cmp 95.76 by Daily Chart view
- Support Zone 75 to 85 Price Band
- Resistance Zone 95 to 105 Price Band
- Resistance Zone holding strong since a year from January 2025
- Head & Shoulders around Support Zone and last Rounding Bottom
- Heavy Volumes surge seen last week Friday by demand based buying
- Bullish Rounding Bottoms with good consolidation around Support Zone
- Falling Resistance Trendlines Breakout with Rising Support Trendline been respected

NIFTY at a Turning Point? Monthly Chart SpeaksOn the monthly chart, NIFTY is showing a critical market structure shift.
Key observations:
Supply range has been swept
A clear M-pattern is forming on the higher timeframe
The last fake / trapping monthly fall setup (marked on the chart) is now complete
Price is trading at ~5.7 ATR away from the 100 EMA, signalling extension
From a risk–reward perspective, the structure offers a ~1:5 R:R setup on the monthly timeframe.
At this stage, confirmation matters more than bias.
If the February monthly candle starts turning red, it could activate a sell-side move and potentially shift NIFTY into a bearish regime, not just a short-term pullback.
This is not a prediction — it’s price action, market structure, and probability on a higher timeframe.

XAUUSD Gold BuyGold is very bullish, currently one should look to buy it, it is making its new ATH level every day, and currently we are seeing a zone from where buying can be done, definitely take LTF confirmation, with this you can reduce your risk to a great extent.

Dalal Street Shaken Ahead of Monthly Expiry — What’s Next?Indian equity markets witnessed a sharp corrective move last week, with the Nifty sliding nearly 2.5% to close around 25,050. The sell-off came at a sensitive juncture—just ahead of monthly expiry.
Adding to the nervousness, India VIX jumped sharply by 24.8% to 14.19, signaling a sudden rise in uncertainty and trader caution.
A combination of geopolitical tensions, pre-Union Budget 2026 jitters, and mixed Q3 earnings weighed heavily on market sentiment, prompting profit booking across sectors.
◉ Technical Setup
Nifty is currently testing the lower end of its rising channel, a technically important area. A mild relief bounce is possible from these levels.
However, a decisive breakdown below the channel support could trigger another leg of sharp selling in the coming sessions, making this zone extremely crucial for near-term direction.
◉ Key Levels to Watch
Support Zones
25,000 – 24,900: Immediate psychological and technical support
24,500 – 24,400: Strong base with heavy put writer concentration
Resistance Zones
25,400 – 25,500: Immediate hurdle with significant call writing
26,000 – 26,100: Major supply zone and strong resistance
◉ Near-Term View
Volatility is likely to remain elevated in the coming week. While the broader structure has weakened, a short-term bounce from the 25,000 zone cannot be ruled out, given oversold conditions and strong psychological support.
That said, any recovery should be viewed with caution and may face stiff resistance at higher levels.
◉ Suggested Strategy
A cautious, stock-specific strategy is preferred for the week ahead. Short-term oversold signals may support a bounce, but the broader trend has weakened. Avoid aggressive longs and focus on protecting gains.

XAUUSD – Monday Focus: Buy the Dip Toward 5,020–5,043 Market Context
Gold remains firmly supported by a bullish risk environment. The recent impulse leg confirms that buyers are still in control, while pullbacks are being absorbed rather than extended.
This is continuation behavior, not distribution.
The question for Monday is not if Gold is bullish —
but where the dip becomes opportunity.
Technical Structure (H1)
Market has already confirmed bullish BOS
Strong impulsive leg created multiple stacked FVGs below
Current price is consolidating above structure, not breaking it
Pullback is corrective in nature
This is a classic impulse → retracement → continuation setup.
Key Zones to Watch
Immediate resistance / BOS level: 4,969 – 4,970
Intraday BUY zone: 4,933 – 4,940
Upper FVG support: 4,920 – 4,899
Deeper demand (HTF): 4,860 – 4,880
As long as price holds above the upper FVG, bullish bias remains intact.
Scenarios (If – Then)
Scenario 1 – Bullish Continuation (Primary)
If price pulls back into 4,933 – 4,940 and holds
Buyers step in → continuation toward:
5,020
5,043 (1.618 extension)
Scenario 2 – Deeper Pullback (Alternative)
If price loses 4,933
Expect mitigation toward 4,920 – 4,899
Only a sustained H1 close below 4,899 would weaken the bullish structure
Summary
Gold is not overextended — it is rebalancing within a bullish trend.
The structure favors buying pullbacks, not chasing highs.
This is a dip-buying market until structure says otherwise.

BTC 1D UpdatePrice has been grinding lower since the early Jan peak near $95K, forming a clear descending wedge (yellow lines). Recent rejection at the upper trendline (~$92K) led to a pullback, with today's close at $88,720 (-0.52%). Support holding at $88K (bottom of wedge), but volume's thinning—watch for a breakdown targeting $84K (next fib level) or a bullish breakout above $90K aiming for $95K retest.
Key levels:
Resistance: $90K (horizontal), $92K (wedge top)
Support: $88K (wedge bottom), $84K (prior low)
Macro backdrop: BTC's lagging gold's surge amid inflation hedges, with ETF outflows pressuring the week (-4.89%). Bulls eye $92K-$98K if Jan closes green, but BoJ risks and global rallies aren't lifting it yet.
NFA, DYOR. What's your bias? Bullish reversal or more downside? #BTC #Bitcoin #CryptoTrading

BSEBSE
bullish trend is Showing on the chart.
technical indicators and
cup with handle & ascending triangle chart pattern.


Vedanta 13000+ Targets in next 10 Years suggest Quarterly ChartsVedanta 13000+ Targets in next 10 Years suggest Quarterly Charts.
LTP - 685
Targets - 13000+
Timeframe - 10 Years
Technically Vedanta is following its channel since Inception in 1994. It has move from 0.25 to 143 ... 550x ROI from 2000 till 2010. Post this phase it went in sideway consolidation till 2020 making lows of 27.
Post consolidation Stock is again in uptrend & making New Highs on Monthly basis.
This Rally would continue till 2030 ... Vedanta can be Multibagger for long term Investment.
Happy Investing.


#CHENNPETRO#CHENNPETRO
bullish trend is Showing on the chart.
buy signals in
technical indicators and
Retest cup with handle chart pattern.
Buying Range 830/840
Watch for a breakout above 770/780 to sustain the bullish trend. If the resistance holds, there could be a retest towards 640/650 and an uptrend from here.

Weekly analysis of XAUUS/Gold with buy and sell scenarios...Gold has reached to Level 2 as we analysed few weeks back.
Gold has created a strong weekly momentum candle showing positive sentiment. But there is divergence with volume. Candle is strongest amongst last four weekly candles while volume is lowest. On daily time frame there are consecutive 5 buy candles. RSI is also over 80 and oversold All these brings a caution
So, price may take a pause or pull back to adjust pricing. Now we need to be cautious and plan for rangebound pull back.
1. Price has created higher highs in lower time frames and created micro structures.
2. Now price may pull back with some delivery change in lower time frames.
3. Still, we should be positive till delivery changes at 4H/1H TF.
4. Most probably price will take liquidity of FVG/RDRB level and create MSS/CISD/TS/iFVG in LTF.
5. Price should show rejection/reversal in respective LTF (4H/1h/15m) at FVG zone.
6. Take the trade only once clear entry model i.e. turtle soup. iFVG break, CDS or MSS happens on LTF
All these combinations are signalling a high probability and high RnR trade scenario.
Note – if you liked this analysis, please boost the idea so that other can also get benefit of it.
Also follow me for notification for incoming ideas.
Also Feel free to comment if you have any input to share.
Disclaimer: This analysis is for educational purposes only and does not constitute investment advice. Please do your own research (DYOR) and check with your financial advisor before making any trading decisions.

Multiple time frame RSI bearish diversion Tata steelMultiple time frame RSI bearish diversion Tata steel. This content is for educational and informational purposes only and does not constitute financial, investment, or trading advice. Trading financial markets involves significant risk of loss, and past performance does not guarantee future results. Users are responsible for their own investment decisions and should consult a certified financial advisor.

MRPLMRPL
bullish trend is Showing on the chart.
buy signals in
technical indicators and
Ascending Channel chart pattern.
cup and handle pattern
BUYING RANGE 150/155
Watch for a retest 150/155 to sustain the bullish trend. If the resistance holds, there could be a retest towards 120/125 and an uptrend from here.

XAUUSD – Brian | H3 Technical AnalysisGold continues to trade within a well-defined bullish structure on the H3 timeframe, supported by strong technical momentum. Price action remains orderly, with impulsive advances followed by controlled pullbacks — a characteristic of a healthy trending market.
From a macro standpoint, geopolitical uncertainty remains elevated after recent comments from President Trump regarding increased U.S. control over strategic military areas in Greenland. While not implying direct occupation, the development adds to broader risk sensitivity and continues to support gold’s role as a defensive asset.
Market Structure & Technical Context (H3)
On the H3 chart, XAUUSD remains firmly above its rising trendline, with market structure defined by higher highs and higher lows. A prior break of structure (BOS) confirmed bullish continuation and opened the door for further expansion.
Key technical areas highlighted on the chart:
A strong impulsive leg followed by corrective pullbacks, consistent with trend continuation.
Fibonacci expansion with the 2.618 extension near the 5005 zone, acting as a major reaction area.
A liquidity pullback zone around 4825, aligned with trendline support and suitable for continuation scenarios.
A lower POC / value area acting as deeper support if volatility increases.
As long as price holds above these demand zones, the broader bullish structure remains intact.
Liquidity & Forward Expectations
Upside liquidity remains available above recent highs, while short-term pullbacks are likely driven by profit-taking rather than structural weakness. The 5000–5005 area represents a key decision zone where price may pause or consolidate before the next directional move.
Trading Bias
Primary bias: Bullish continuation while structure holds
Key zones to monitor:
4825 – liquidity pullback / trend continuation
5000–5005 – major extension & reaction zone
Preferred timeframe: H1–H4
Risk management remains essential, particularly in a market sensitive to sudden news flows.
Refer to the accompanying chart for a detailed view of market structure, liquidity zones, and Fibonacci extensions.
Follow the TradingView channel to receive early updates and join the discussion on market structure and price action.
