Blue Star Limited 1 Week Time Frame 📈 Weekly Support & Resistance Levels (Approximate)
These are levels traders watch for price reactions over a 1-week horizon (weekly pivot/swing areas):
Major Resistance Zones (Upside)
• ~₹1,950 – ₹1,990 — key upper range resistance where price faces sellers if trend weakens
• ~₹2,000+ — psychological resistance above short-term range (R2/R3 in some pivot models)
Pivot / Intermediate Level
• ~₹1,920 – ₹1,930 — near pivot and recent trading midpoint zone
Support Zones (Downside)
• ~₹1,940 – ₹1,922 — short-term support region (recent pivot S1/S2)
• ~₹1,900 – ₹1,890 — next support if market weakens
• ~₹1,850 – ₹1,820 — broader support below the week’s consolidation low
These levels are typically derived from pivot calculations, recent swing highs/lows, and moving average clusters on weekly charts.
📊 Weekly Chart Context
✔ The stock has shown moderate upside momentum over past weeks (one-week gains reported in some data)
✔ On a weekly timeframe, closing above ~₹1,950 – ₹1,990 could signal continuation toward higher resistance zones.
✔ Weekly support near ~₹1,900 / ₹1,880 acts as a key pivot for bull/bear decision.
📌 Interpretation (Weekly)
🔹 Bullish scenario: Sustained closes above resistance pivots (₹1,950+) with volume can push toward ₹2,000+ levels.
🔹 Neutral / consolidation: Price bouncing between ₹1,900 and ₹1,950 indicates sideways action.
🔹 Bearish scenario: Break below ₹1,880-₹1,870 opens broader downside toward short-term support around ₹1,820 area.
X-indicator

Tech Bubble vs Value Rotation DebatesThe Tech Bubble Argument
The term “tech bubble” immediately evokes memories of the late 1990s and the collapse of the dot-com boom. During that period, companies with little revenue and no profits achieved astronomical valuations. The Nasdaq Composite rose nearly fivefold between 1995 and early 2000 before crashing dramatically. Many firms disappeared entirely.
In current debates, those warning of a new tech bubble point to:
1. Elevated Valuations
Technology companies often trade at high price-to-earnings (P/E) and price-to-sales ratios. Critics argue that expectations for perpetual high growth are unrealistic. When valuations stretch far beyond historical norms, even small disappointments in earnings can trigger sharp corrections.
2. Concentration Risk
Modern indices are heavily weighted toward a handful of mega-cap tech firms. For example, companies like Apple Inc., Microsoft, and NVIDIA have, at times, accounted for an unusually large portion of index performance. Skeptics argue this narrow leadership resembles past speculative periods.
3. Narrative-Driven Investing
Technological revolutions—cloud computing, artificial intelligence, electric vehicles—generate powerful stories. Investors may extrapolate long-term disruption too aggressively, bidding up stocks based on future dominance rather than current cash flows.
4. Monetary Policy Tailwinds
Periods of low interest rates tend to boost growth stocks because their future earnings are discounted at lower rates. When central banks such as the Federal Reserve maintain accommodative policy, capital flows more freely into higher-risk, high-growth assets. Bubble theorists argue that ultra-low rates artificially inflate tech valuations.
In short, the tech bubble thesis claims that excessive optimism, easy money, and crowd psychology have pushed valuations beyond sustainable levels.
The Value Rotation Argument
In contrast, the “value rotation” narrative focuses on cyclical market dynamics. Instead of viewing tech as irrationally inflated, proponents argue markets move in multi-year cycles between growth and value leadership.
1. Growth vs. Value Defined
Growth stocks: Companies expected to grow earnings faster than the broader market, often reinvesting profits.
Value stocks: Companies perceived as undervalued relative to fundamentals, often with stable cash flows and dividends (e.g., banks, energy firms, industrials).
Historically, these styles alternate in performance dominance.
2. Interest Rate Sensitivity
Growth stocks are more sensitive to interest rates because their valuations depend heavily on future earnings. When rates rise, the present value of distant cash flows falls, often hurting tech stocks. Conversely, value sectors such as financials may benefit from higher rates.
For example, when U.S. Treasury yields climb, sectors like banking often outperform because higher rates can widen lending margins. Thus, a rise in rates can trigger capital flows from growth into value—what investors call a “rotation.”
3. Economic Cycles
During early recoveries from recession, cyclical sectors (industrials, materials, energy) often outperform as demand rebounds. In contrast, during slow-growth or low-rate environments, investors favor scalable, asset-light tech firms.
The value rotation argument suggests that market leadership changes are not necessarily bubbles bursting but rational reallocations in response to macro conditions.
4. Post-Pandemic Dynamics
After the 2020 pandemic shock, massive fiscal stimulus and ultra-low interest rates fueled tech outperformance. However, as inflation rose and the Federal Reserve tightened policy, value stocks temporarily gained relative strength. Some analysts framed this not as a tech collapse, but as a cyclical shift.
Structural Differences from the Dot-Com Era
A key dimension of the debate centers on whether today’s tech giants resemble speculative startups of the late 1990s.
Profitability and Cash Flow
Unlike many dot-com companies, modern technology leaders are highly profitable, generate enormous free cash flow, and hold significant balance sheet strength.
Infrastructure and Adoption
Technologies like cloud computing and AI are deeply embedded in global business operations. This contrasts with the earlier internet era, when adoption rates were uncertain.
Market Dominance
Large firms such as Alphabet Inc. and Amazon operate diversified ecosystems with recurring revenue streams. Supporters argue this makes them fundamentally stronger than speculative dot-com ventures.
Thus, value rotation proponents contend that while valuations may fluctuate, labeling the sector a “bubble” ignores structural profitability and economic centrality.
Behavioral Finance and Market Psychology
The debate also reflects behavioral biases:
Recency Bias: Investors extrapolate recent performance trends.
Herding Behavior: Capital clusters around recent winners.
Overconfidence: Belief in technological inevitability may overshadow risks.
At the same time, pessimism can overshoot. During sharp corrections, tech valuations sometimes fall below historical averages, contradicting bubble claims.
Markets often oscillate between enthusiasm and caution. The bubble narrative gains traction during rapid price appreciation, while rotation narratives dominate when leadership broadens.
The Role of Inflation and Policy Regimes
Inflation and monetary policy are central to this debate. Low inflation and stable growth tend to favor technology stocks due to predictable discount rates. High inflation and aggressive rate hikes compress valuations of long-duration assets (like growth stocks).
For instance, during tightening cycles led by the Federal Reserve, investors may shift capital toward sectors with near-term cash flows and pricing power. Energy and commodities often benefit in such regimes.
Thus, the tech bubble vs value rotation debate often reduces to differing expectations about:
Long-term interest rates
Inflation persistence
Economic growth trajectories
Concentration and Systemic Risk
Another layer involves market structure. Passive investing and index funds amplify flows into mega-cap stocks. If a few companies dominate benchmarks, inflows mechanically push their prices higher, reinforcing momentum.
Critics argue this dynamic can inflate valuations regardless of fundamentals. Supporters counter that dominance reflects superior business models and network effects.
The question becomes: Is concentration a symptom of bubble behavior or of economic winner-take-most dynamics?
Long-Term Perspective
Historically, style leadership has rotated over decades. In the 1970s, energy dominated. In the 1980s and 1990s, technology surged. In the early 2000s, value outperformed growth for several years after the dot-com crash. In the 2010s, growth regained dominance.
Neither growth nor value permanently wins.
Investors who frame the debate as binary—bubble or rotation—may overlook that both dynamics can coexist. Valuations can be stretched in certain subsectors while broader performance shifts reflect macro cycles.
Conclusion
The tech bubble vs value rotation debate is fundamentally about interpretation:
Bubble thesis: Prices reflect speculative excess, driven by easy money and over-optimistic narratives.
Rotation thesis: Performance shifts reflect rational adjustments to interest rates, inflation, and economic cycles.
Reality often lies between extremes. Some segments of the market may experience speculative fervor, while broader movements represent structural change or macro-driven reallocations.
For investors, the key questions are less about labeling the environment and more about assessing valuation discipline, earnings durability, macro sensitivity, and risk tolerance. Whether one views tech as overheated or structurally dominant depends largely on assumptions about future growth, policy regimes, and innovation trajectories.
Ultimately, markets are cyclical, narratives evolve, and leadership changes. Understanding both perspectives equips investors to navigate uncertainty rather than react to headlines.

Cybersecurity Growth TradeWhy Cybersecurity Is a Structural Growth Theme
Cybersecurity is not a short-term trend—it is a foundational requirement of the digital economy. Several forces drive its expansion:
Digital Transformation
Businesses are migrating workloads to the cloud, automating operations, and adopting AI-driven tools. Each new digital system expands the “attack surface,” creating new vulnerabilities.
Remote and Hybrid Work
The global shift toward distributed workforces accelerated after the COVID-19 pandemic. Employees accessing corporate networks from home or public networks increased the need for endpoint and identity protection.
Cloud and SaaS Adoption
Companies rely heavily on cloud providers like Amazon Web Services, Microsoft Azure, and Google Cloud. Securing cloud infrastructure requires new architectures and specialized cybersecurity tools.
Regulatory Pressure
Governments worldwide impose stricter data privacy and breach disclosure laws, increasing corporate spending on security compliance.
Escalating Cyber Threats
Ransomware, phishing, data breaches, and state-sponsored attacks continue to rise in sophistication and scale.
Because cyber risk never disappears—and often intensifies—security spending is considered “non-discretionary.” Companies may cut marketing or expansion budgets during downturns, but they rarely cut cybersecurity significantly.
Major Cybersecurity Growth Companies
The growth trade in cybersecurity is largely centered around innovative, cloud-native security firms and large platform providers expanding security capabilities.
Crowd Strike
Crowd Strike is known for its cloud-native endpoint security platform, Falcon. It uses AI and machine learning to detect and prevent threats in real time. Investors view Crowd Strike as a high-growth SaaS security leader with strong recurring revenue and expanding margins.
Palo Alto Networks
Palo Alto Networks evolved from traditional firewalls into a broad cybersecurity platform covering network security, cloud security, and AI-driven threat detection. It is often viewed as a blend of growth and profitability.
Fortinet
Fortinet specializes in network security appliances and secure networking solutions. It is known for strong operating margins and hardware-software integration.
Zscaler
Zscaler pioneered secure web gateways and zero-trust network access. Its cloud-based model aligns with enterprise migration away from traditional VPNs toward zero-trust frameworks.
Key Themes Within the Growth Trade
1. Zero Trust Architecture
Zero trust assumes no device or user should be trusted by default—even inside corporate networks. This model has become a dominant security philosophy. Companies like Zscaler and CrowdStrike benefit from this paradigm shift.
2. AI-Powered Threat Detection
Machine learning models analyze enormous volumes of data to identify anomalies and suspicious behavior. As attackers also leverage AI, defensive systems must evolve rapidly. AI-enhanced detection systems increase switching costs and long-term platform value.
3. Platform Consolidation
Enterprises prefer fewer vendors with broader capabilities. Many cybersecurity firms are expanding into adjacent areas—identity, cloud security, SIEM, and threat intelligence—creating platform-based ecosystems.
4. Recurring Revenue (SaaS Model)
Most growth-focused cybersecurity firms operate subscription models with high gross margins and predictable recurring revenue. Investors favor:
High annual recurring revenue (ARR)
Strong net retention rates
Expanding operating leverage
Financial Characteristics of the Cybersecurity Growth Trade
Cybersecurity growth stocks typically display:
Revenue growth above 20–30% annually (during expansion phases)
High gross margins (70%+ for SaaS firms)
Significant R&D investment
Stock price volatility due to valuation sensitivity
Because these companies reinvest heavily in growth, many historically prioritized expansion over short-term profitability. However, in higher interest rate environments, markets often demand improved free cash flow and operating discipline.
Risks to the Growth Trade
Although cybersecurity has strong structural demand, the trade carries risks:
Valuation Risk
Growth stocks often trade at high revenue multiples. Rising interest rates can compress valuations.
Competition and Commoditization
The sector is crowded. Large technology firms integrate security features into broader platforms, potentially pressuring standalone vendors.
Technological Disruption
Rapid innovation means today’s leading technology may become outdated quickly.
Customer Consolidation
Enterprises may reduce vendors to streamline costs, impacting smaller players.
Macroeconomic Sensitivity
Cybersecurity is considered more defensive than many technology sectors because security is mission-critical. However, growth stocks remain sensitive to:
Interest rate movements
Equity market risk appetite
Venture capital funding cycles
In low-rate environments, high-growth cybersecurity firms often outperform due to favorable discount rates on future earnings. In tightening cycles, more profitable or diversified security firms may outperform high-multiple names.
Global Market Outlook
The global cybersecurity market is projected to continue expanding for the next decade. Drivers include:
Expansion of IoT devices
5G infrastructure
Critical infrastructure protection
National defense modernization
Increased ransomware frequency
Government contracts and defense-related cybersecurity spending add another layer of durable demand.
Investment Approaches
Investors can gain exposure to the cybersecurity growth trade through:
Individual stocks (e.g., CrowdStrike, Palo Alto Networks)
Exchange-traded funds (ETFs) focused on cybersecurity
Broader technology growth funds with security exposure
Venture capital/private equity for early-stage firms
Diversification is important due to competitive risks and rapid technological evolution.
Long-Term Thesis
The cybersecurity growth trade rests on a simple but powerful premise: digital systems will continue expanding faster than the ability to secure them. As long as digital infrastructure grows—and cyber threats evolve—spending on protection must increase.
Unlike many technology fads, cybersecurity spending is not optional. It is insurance against existential business risk. Data breaches can destroy brand reputation, trigger regulatory fines, and halt operations. This necessity makes cybersecurity a core component of modern enterprise budgets.
Over time, the sector may consolidate around dominant platform providers, similar to what occurred in cloud computing. Firms that combine strong technology, scalable cloud-native architecture, and disciplined financial management are likely to capture the majority of economic value.
Conclusion
The cybersecurity growth trade represents a long-duration investment theme driven by structural digital expansion, escalating threats, regulatory pressure, and cloud transformation. Leading companies like CrowdStrike, Palo Alto Networks, Fortinet, and Zscaler exemplify how security providers are evolving from point solutions into comprehensive, AI-powered platforms.
While valuations can be volatile and competition intense, the fundamental demand for cybersecurity appears durable and expanding. For investors seeking exposure to secular digital infrastructure growth, cybersecurity remains one of the most compelling and strategically important sectors in the global economy.
The AI Revolution & Tech Sector Leadership: Impact on EquitiesThe Rise of AI-Centric Market Leadership
The AI boom has accelerated leadership concentration within mega-cap technology companies. Firms such as NVIDIA, Microsoft, Alphabet, and Amazon have become central pillars of equity index performance due to their direct exposure to AI infrastructure, cloud computing, and large language models.
NVIDIA, in particular, represents the clearest example of AI-driven equity repricing. Its dominance in high-performance GPUs—the backbone of AI model training—has led to explosive revenue growth and margin expansion. Investors have rewarded this with premium valuation multiples, reflecting expectations of sustained demand for AI infrastructure.
Meanwhile, Microsoft and Alphabet have embedded AI across cloud services and enterprise applications, monetizing AI through subscription-based productivity tools and cloud consumption models. Amazon’s AWS division similarly benefits from increased compute demand as corporations build AI capabilities.
This concentration of gains in a handful of mega-cap firms has significantly influenced major equity indices such as the S&P 500 and Nasdaq, where performance has been disproportionately driven by AI-linked leaders.
Semiconductors: The Picks-and-Shovels Trade
Beyond headline companies, the semiconductor ecosystem has become the “picks-and-shovels” beneficiary of AI investment. Firms like ASML and Taiwan Semiconductor Manufacturing Company play critical roles in advanced chip fabrication. ASML’s extreme ultraviolet (EUV) lithography machines are essential for producing cutting-edge AI chips, while TSMC manufactures chips for many leading AI designers.
This segment has experienced strong earnings momentum as data centers expand capacity to accommodate AI workloads. Capital expenditure cycles are lengthening and deepening, benefiting equipment suppliers and foundries alike.
However, cyclicality remains a risk. Historically, semiconductor equities have experienced boom-bust patterns. The AI cycle may prove more durable than previous hardware waves, but overcapacity and geopolitical tensions (especially surrounding Taiwan) present structural risks to valuations.
Software & Platform Monetization
AI’s next phase extends beyond infrastructure into application-layer monetization. Enterprise software firms such as Salesforce and Adobe are integrating generative AI features into existing platforms to enhance productivity, personalization, and workflow automation.
The monetization debate centers on pricing power: Can companies charge meaningful premiums for AI enhancements, or will AI become a commoditized feature? Investors reward firms that demonstrate measurable productivity gains translating into subscription growth or reduced churn.
Meanwhile, AI-native companies like OpenAI (though privately held) influence competitive dynamics across the public equity landscape by accelerating innovation cycles and pressuring incumbents to adapt quickly.
Equity valuations in this segment increasingly depend on clarity around incremental revenue generation rather than speculative AI narratives. Companies that fail to demonstrate tangible returns risk valuation compression.
Capital Expenditure & Margin Dynamics
One defining feature of the AI revolution is unprecedented capital expenditure (capex) intensity. Hyperscalers are investing tens of billions annually in data centers, advanced chips, and energy infrastructure. While this fuels growth for hardware suppliers, it temporarily compresses free cash flow for the buyers themselves.
This creates a dynamic tension in equities:
Infrastructure suppliers benefit from capex expansion.
Cloud providers face short-term margin pressure but long-term revenue acceleration.
Utilities and energy firms may gain from increased electricity demand.
Investors must therefore distinguish between near-term earnings dilution and long-term strategic positioning. Companies that manage AI investment efficiently—balancing innovation with cost control—are rewarded with multiple expansion.
Broad Market Spillovers
AI’s influence extends beyond technology. Sectors such as healthcare, financial services, manufacturing, and consumer goods are integrating AI to improve diagnostics, fraud detection, supply chain optimization, and marketing efficiency.
If AI meaningfully boosts productivity, broader corporate margins could expand. This would justify higher equity valuations across multiple sectors, not just technology. Conversely, if AI primarily reallocates profits toward infrastructure providers, concentration risk in equity indices may deepen.
Labor market implications also matter. Automation could suppress wage inflation in certain sectors, supporting corporate margins. However, regulatory scrutiny and societal pushback may introduce policy risks that affect valuations.
Valuation Framework Shifts
Traditional valuation metrics are being stress-tested. Price-to-earnings (P/E) multiples for AI leaders often appear elevated relative to historical norms. Yet investors argue that AI represents a structural shift akin to the cloud transition or mobile internet revolution, justifying premium growth multiples.
The key question: Are current valuations discounting decades of growth, or merely the early innings?
If earnings growth materializes as projected, multiples may normalize organically as profits catch up. If growth disappoints, however, equities could experience sharp corrections similar to prior tech bubbles.
Market leadership concentration increases systemic sensitivity. When a small group of AI-linked firms accounts for a large percentage of index gains, broader market resilience depends heavily on their continued performance.
Geopolitics & Regulation
AI leadership is increasingly tied to national competitiveness. U.S.-China tensions around semiconductor exports and advanced computing hardware introduce supply chain uncertainties. Export restrictions on high-performance chips can materially affect revenue streams for major semiconductor firms.
Regulation also looms. Governments worldwide are evaluating AI safety frameworks, data privacy standards, and antitrust measures. Stricter regulation could slow deployment or increase compliance costs, impacting profitability.
At the same time, government incentives for domestic chip production—such as industrial policy initiatives—may benefit certain firms through subsidies and tax credits.
The Productivity Thesis
The long-term bullish case for equities rests on productivity gains. Historically, transformative technologies—from electricity to the internet—eventually led to higher economic growth and corporate profitability.
If AI meaningfully enhances knowledge worker productivity, automates routine tasks, and accelerates innovation cycles, GDP growth could improve. Higher productivity supports:
Stronger corporate earnings
Improved return on equity (ROE)
Sustained equity market appreciation
However, productivity gains often take years to materialize in macroeconomic data. In the interim, markets may oscillate between enthusiasm and skepticism.
Risks & Market Cyclicality
Despite structural promise, risks remain:
Overvaluation Risk: Excessive optimism could inflate speculative bubbles.
Execution Risk: Companies may overinvest without achieving expected returns.
Technological Disruption: Rapid innovation can dethrone current leaders.
Energy Constraints: AI data centers require vast electricity resources.
Macro Sensitivity: High-growth tech stocks are sensitive to interest rate changes.
Historically, transformative tech waves generate both enormous wealth and painful corrections. Investors must balance long-term conviction with disciplined risk management.
Conclusion
The AI revolution represents one of the most consequential technological shifts in modern economic history. Its impact on equities is already profound—driving sector leadership, reshaping valuation frameworks, and concentrating index performance in AI-aligned firms.
Mega-cap technology companies, semiconductor manufacturers, and enterprise software providers stand at the forefront of this transformation. Yet broader market implications—ranging from productivity gains to regulatory challenges—will determine whether AI becomes a sustained earnings catalyst or a cyclical boom.
Ultimately, the equity market’s trajectory will depend on whether AI delivers durable, scalable profitability rather than speculative excitement. If the productivity thesis proves valid, AI may not only define this decade’s market leadership—but also reshape the structural foundations of global equity markets for years to come.

Bond Yield Volatility & Fixed-Income Trading StrategiesPart I: Bond Yield Volatility
1. What Is Bond Yield Volatility?
Bond yield volatility refers to fluctuations in interest rates (yields) over time. Since bond prices move inversely to yields, volatility in yields translates into price volatility.
When yields rise:
Bond prices fall
Longer-duration bonds fall more
When yields fall:
Bond prices rise
Longer-duration bonds gain more
Yield volatility is typically measured using:
Standard deviation of yield changes
Implied volatility from interest rate options
MOVE Index (bond market’s “VIX”)
2. Why Bond Yields Become Volatile
A. Monetary Policy Changes
Central banks strongly influence yields. For example, actions by the Federal Reserve, European Central Bank, or Bank of Japan affect expectations about future interest rates.
Rate hikes → yields rise
Rate cuts → yields fall
Unexpected policy signals create sharp volatility.
B. Inflation Expectations
Inflation erodes bond purchasing power. If inflation expectations increase, investors demand higher yields. Data releases like CPI and PPI often trigger intraday yield spikes.
C. Economic Growth Surprises
Stronger-than-expected growth:
Increases inflation fears
Pushes yields higher
Recession fears:
Trigger “flight to safety”
Push yields lower
D. Supply and Demand
Government borrowing levels, foreign investor demand, pension fund flows, and quantitative easing (QE) all affect yield dynamics.
Large bond issuance → upward yield pressure
Central bank bond buying → downward yield pressure
3. The Price-Yield Relationship
Key concepts:
Duration
Measures price sensitivity to yield changes
Longer duration = higher volatility
Example:
2-year bond: small price change
30-year bond: large price change
Convexity
Measures curvature of price-yield relationship
Higher convexity improves performance in volatile markets
4. Yield Curve Volatility
The yield curve represents yields across maturities.
Three key movements:
Parallel shift – All yields move equally
Steepening – Long yields rise faster than short yields
Flattening – Short yields rise faster than long yields
Inverted yield curves often signal recession risk.
Part II: Fixed-Income Trading Strategies
Professional traders use multiple strategies to profit from yield volatility.
1. Duration-Based Strategies
A. Duration Positioning
If expecting rate cuts:
Increase duration
Buy long-term bonds
If expecting rate hikes:
Reduce duration
Hold short-duration instruments
This is directional interest rate trading.
2. Yield Curve Strategies
A. Steepener Trade
Buy long-term bonds
Sell short-term bonds
Profit if curve steepens.
B. Flattener Trade
Buy short-term bonds
Sell long-term bonds
Profit if curve flattens.
These are often implemented using government bonds or futures.
3. Relative Value (RV) Trading
Traders exploit mispricing between similar instruments.
Examples:
On-the-run vs off-the-run Treasuries
Swap spreads
Cash vs futures basis
These strategies rely on pricing convergence rather than directional yield moves.
4. Carry and Roll-Down Strategy
This strategy earns return from:
Coupon income
Positive yield curve slope
If the yield curve is upward sloping, bonds “roll down” to lower yields as they age, generating price gains.
Works best in stable, low-volatility environments.
5. Inflation-Linked Strategies
Use Treasury Inflation-Protected Securities (TIPS).
Trade the “breakeven inflation” rate:
If inflation rises above expectation → TIPS outperform
If inflation falls → nominal bonds outperform
6. Volatility Trading (Options on Rates)
Sophisticated traders use:
Swaptions
Interest rate caps/floors
Bond futures options
Strategies include:
A. Long Volatility
Buy options before major events (Fed meetings, CPI release)
B. Short Volatility
Sell options when volatility is overpriced
Volatility trading is common among hedge funds and dealer desks.
7. Credit Spread Strategies
Corporate bonds have yield spreads over government bonds.
Credit spread widens during:
Economic stress
Recession fears
Tightens during:
Growth expansion
Risk-on markets
Traders use:
Long credit (buy corporates)
Short credit (CDS protection)
8. Global Macro Fixed-Income Trading
Macro traders analyze:
Global inflation cycles
Central bank divergence
Currency impacts
Example:
If the Federal Reserve hikes faster than the European Central Bank:
US yields may rise relative to Europe
Traders position in cross-market spread trades
Part III: Risk Management in Fixed-Income Trading
Yield volatility can produce rapid losses. Key risk tools include:
1. DV01 (Dollar Value of 1 Basis Point)
Measures dollar impact of a 1bp yield move.
Essential for:
Position sizing
Hedging
2. Value at Risk (VaR)
Estimates potential loss under normal conditions.
3. Scenario Analysis
Simulate:
Parallel rate shocks
Curve steepening
Liquidity freeze
4. Liquidity Risk
Bond markets can become illiquid during stress (e.g., 2008, 2020 pandemic shock).
Liquidity premiums increase yield volatility.
Part IV: Market Participants
Different players behave differently:
Central banks: policy-driven
Commercial banks: asset-liability management
Pension funds: long-duration buyers
Hedge funds: relative value & volatility
Asset managers: total return focus
Understanding flows helps anticipate volatility.
Part V: Modern Trends in Yield Volatility
Algorithmic trading increases speed of rate moves
Passive bond ETFs influence liquidity
Large fiscal deficits increase supply volatility
Quantitative tightening (QT) raises structural yield uncertainty
Bond markets have shifted from low-volatility (2010–2020 QE era) to structurally higher volatility environments.
Conclusion
Bond yield volatility is central to modern financial markets. It influences asset allocation, derivative pricing, currency markets, and macroeconomic stability.
Fixed-income trading strategies range from:
Directional duration trades
Yield curve positioning
Relative value arbitrage
Inflation trading
Volatility strategies
Credit spread positioning
Successful fixed-income trading requires:
Deep macroeconomic understanding
Quantitative risk management
Liquidity awareness
Policy sensitivity
While bonds are traditionally seen as “safe,” yield volatility can generate both substantial risk and opportunity. In today’s environment of shifting monetary regimes and persistent inflation uncertainty, understanding bond yield dynamics is more important than ever for investors, traders, and policymakers alike.

Nifty spot 25471.10 by Daily Chart view - Weekly UpdateNifty spot 25471.10 by Daily Chart view - Weekly Update
- Support Zone 25325 to 25625 holding ground for Nifty Index
- Resistance Zone 25850 to 26105 then upwards at ATH 26373.20 for Nifty Index
- Nifty Gap Up Opening of 533 pts on 03-Feb-2026 would need be filled, sooner or later

BTC/USDT STRUCTUREBTC is bullish short term.
But we don’t buy at highs.
If price dips near 68k and shows strong bounce, we look for longs targeting 69.5k and possibly 70.5k+
Buy from discount — not from the top.

Gold Late-Session Trading Strategy | February 13✅ 4H Trend Analysis
● Price previously broke below the 5000 level and dropped to a low of 4878, forming a structural breakdown.
● It then rebounded quickly and has now moved back above 5000.
● Currently, price is trading below MA10 and near MA20, with the moving averages beginning to converge.
● The Bollinger middle band (around 5030–5050) is acting as a key resistance zone.
📌 4H Conclusion:
● This is not a trend reversal, but rather a technical recovery following the breakdown.
● As long as price fails to hold firmly above 5050, the current move should still be viewed as a rebound within a corrective structure.
✅ 1H Trend Analysis
● On the 1-hour timeframe, price has formed a continuous rebound from the 4878 low, with both higher highs and higher lows developing.
● The moving averages have realigned into a bullish structure, indicating stronger short-term momentum.
● Price is currently approaching the 5010–5030 resistance zone.
● If price breaks above 5030, it may continue higher to test the 5050–5070 region.
📌 1H Conclusion:
The short-term rebound is continuing, but it is approaching strong resistance from the 4-hour timeframe.
🔴 Resistance
● 5030–5050 (4H middle band resistance)
● 5070–5100 (stronger resistance zone)
🟢 Support
● 4950–4970 (short-term support)
● 4870–4880 (key defensive support)
✅ Trading Strategy Reference
🔰 Long Strategy (Short-term trend-following longs)
👉 Entry: 4950–4980
🎯 Target 1: 5030
🎯 Target 2: 5070
📍 Logic: The 1H rebound is continuing, but it remains part of a corrective recovery phase.
🔰 Short Strategy (Primary approach: sell at resistance)
👉 Entry: 5030–5050 (scale in positions)
🎯 Target 1: 4970
🎯 Target 2: 4880
📍 Logic: The 4H structure remains corrective, making short positions at resistance more favorable.
✅ Risk Control
● Current phase: rebound testing resistance.
● If price firmly holds above 5050 on the 4H timeframe → short bias becomes invalid.
● If price breaks below 4950 → rebound likely ends.
● A rebound after a breakdown does not equal a trend reversal.

XAUUSD – Bearish Continuation Outlook (1H)Price has failed to sustain above the key supply zone around 5050–5080, which also aligns with:
Previous structure resistance
Descending trendline resistance
Fib retracement confluence (Day TF 0.382 area)
After the rejection, the price broke down and is now retesting the breakdown zone, forming a lower high structure. This indicates sellers are still in control.
The trendline cross + horizontal resistance acting together is a strong bearish confluence. As long as the price stays below this zone, upside looks limited.
Key Levels
Sell Zone: 5000 – 5030
Immediate Resistance: 5050 – 5080
Targets:
TP1: 4920
TP2: 4750 (Day TF 0.5 Fib)
TP3: 4550 (Day TF 0.618 Fib)
Invalidation
A strong 2H close above 5100 will invalidate this bearish setup and may shift bias to bullish continuation.
Bias
📉 Overall bias remains bearish, expecting another leg down after this pullback unless invalidated.

Gold prices fall - awaiting CPI fluctuations.Related Information:!!! ( XAU / USD )
Data released by the US Department of Labor showed that initial unemployment claims declined to 227,000 for the week ending February 7. While the figure came in slightly above market expectations of 222,000, it marked an improvement from the prior week’s revised reading of 232,000. At the same time, continuing claims increased to 1.862 million for the week ending January 31, underscoring persistent structural softness in the US labor market observed over the past year.
These mixed labor signals have helped underpin the US Dollar while simultaneously renewing investor interest in gold, as lingering employment fragilities continue to support demand for safe-haven assets.
personal opinion:!!!
Gold prices are consolidating below 4985, awaiting CPI news which is under selling pressure at the end of the week, and CPI and DXY data are recovering.
Important price zone to consider : !!!
Resistance zone point: 4985, 5040 zone
Support zone point : 4944 , 4890 zone
Follow us for the most accurate gold price trends.

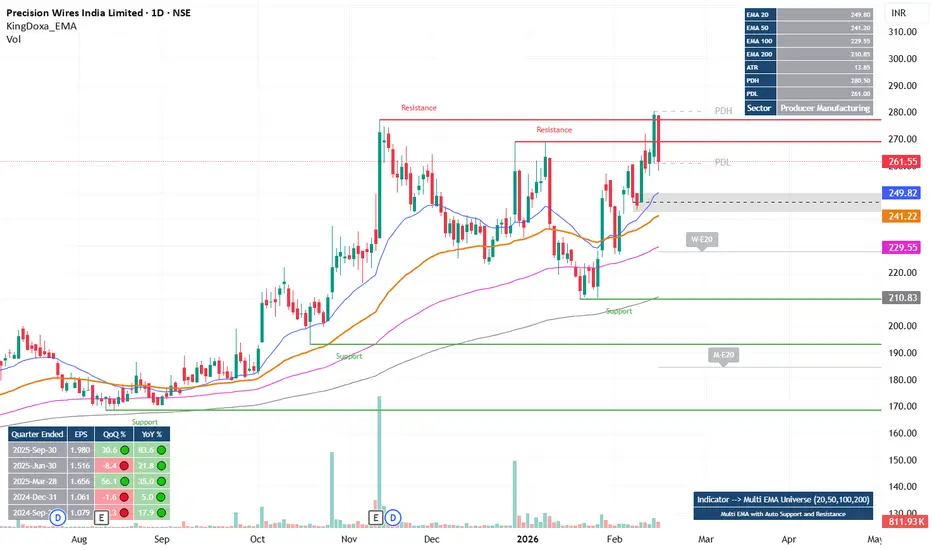
PRICWIREPRECWIRE
Price above all major EMA/s
Nice Buying pressure is observed
Failed B/o attempt followed by shake out. Resistance area Liquidity utilized.
Shake out move failed to close below PDL.
Price can get reverse either current level or from 250 (gray box), from where possible break out move can be observed.
AUDJPY – Bullish Reversal From Trendline SupportAUDJPY is reacting strongly from a major ascending trendline support on the 1H timeframe. Price swept liquidity below the structure, tapped into the demand zone, and immediately rejected — signaling buyer strength.
we entered long around 108.180, which aligns perfectly with the technicals.
📈 Why This Is a Bullish Setup
Price tapped the HTF trendline and respected it
Multiple liquidity sweeps beneath the zone, trapping sellers
Formation of a bullish rejection wick right at support
Price is still inside a discount area, ideal for longs
Recent bearish attempts failde to close below the trendline
Strong probability of a bullish push toward 109.20 – 109.50 liquidity zones
This is a classic trendline + demand + liquidity sweep confluence setup.
📋 Trade Parameters
Entry: 108.180 (executed)
Stop-Loss: ~55 pips (below liquidity sweep + structure low)
Take-Profit: ~110 pips (towards upper liquidity & imbalance zones)
Risk-to-Reward: ~1:2

Part 2 Intraday Institutional Trading Strategies Basic Strategies
- Long Call: Buying a call option, bet on price ↑.
- Long Put: Buying a put option, bet on price ↓.
- Covered Call: Selling a call on stock you own, generate income.
- Protective Put: Buying a put on stock you own, hedge downside risk.
Advanced Strategies
- Straddle: Buying a call and put at the same strike, profit from big moves.
- Strangle: Buying a call and put at different strikes, profit from big moves.
- Iron Condor: Selling a call and put, buying further OTM call and put, profit from low volatility.
- Butterfly Spread: Buying and selling calls/puts at different strikes, profit from price staying within range.

Part 5 Option Trading Strategies Key Components of Option Trading
- Underlying Asset: The security (stock, index, commodity, etc.) the option is based on.
- Strike Price: Fixed price to buy/sell the asset.
- Expiry Date: Last day the option can be exercised.
- Premium: Price paid for the option contract.
- Lot Size: Number of shares/contracts per lot.
- Option Type: Call (buy) or Put (sell).

XAUUSD H1 – Pullback Into Discount Before Bullish Continuation?🧠 Market Structure Overview
Gold recently shifted structure after forming multiple Break of Structure (BOS) to the upside, confirming a short-term bullish phase.
However, price printed a Change of Character (CHOCH) at the recent high — signaling a temporary bearish retracement rather than a full trend reversal.
Current movement appears to be a corrective displacement targeting inefficiencies below.
🔎 Key Technical Observations
📉 Strong bearish impulse from range high suggests liquidity sweep + mitigation move
📦 Price reacting near minor supply / mitigation zone (~4,900 area)
🟢 Major Discount POI + FVG confluence below current price
🔴 Higher timeframe Premium FVG remains untouched above (~5,200–5,300)
Structure Context:
Previous BOS sequence = bullish bias intact
Current CHOCH = internal correction phase
Expectation = seek liquidity in discount before continuation
🎯 Trading Scenarios
🟢 Primary Bullish Scenario
Price retraces into Discount FVG / POI zone (~4,780–4,820)
Liquidity sweep + bullish confirmation (LTF BOS / CHOCH)
Continuation toward:
5,000 psychological resistance
5,100 internal highs
5,250–5,300 Premium FVG target
🔴 Alternative Bearish Scenario
Failure to hold Discount zone
H1 close below major demand
Structure shifts bearish → continuation toward lower liquidity pools
📍 Key Levels
Resistance: 5,050 – 5,100
Premium Target: 5,250 – 5,300
Mitigation Zone: ~4,900
Discount POI / FVG: 4,780 – 4,820
Invalidation: Sustained break below discount demand
🧭 Trading Bias
➡️ Short-term: Bearish retracement
➡️ Mid-term: Bullish continuation bias while structure holds
⚠️ Notes
Wait for confirmation inside POI — don’t chase mid-range entries
Combine with sessions + news volatility
Manage risk — this is structural analysis, not financial advice


HEGHEG - The structure remains bullish.
The stock recently broke above a year-long resistance around 617 and then pulled back for a healthy retest. It found support near the 550 zone and around the 50 EMA, followed by a clear reversal.
Price has also respected the 0.618 Fibonacci (golden ratio) level, which adds strength to the setup. A breakout from the current range could lead to a fresh upside move.
Keep it on your watchlist.
✅ If you like my analysis, please follow me here as a token of appreciation :)
in.tradingview.com/u/SatpalS/
📌 For learning and educational purposes only, not a recommendation. Please consult your financial advisor before investing.

Part 4 Technical Analysis Vs. Institutional Option TradingScalping with Deep ITM Options
For ultra short-term trades (1–5 min).
Why deep ITM?
High delta (0.8–1.0)
Move almost like futures
Lower theta impact
Ideal for
Bank Nifty / Nifty scalpers who want quick moves.

INFYINFY
bearish trend is Showing on the chart.
sell signals in
technical indicators and double top chart pattern.
strong support 1200/1250
Disclaimer : The Above shared Content is for information and education purposes only and should not be treated as investment or trading advice. Im not SEBI registered, Contact your financial advisor before any investment.

BankIndia : Ready for ~169%+ Ride !Hi friends,
Target & Stoploss are mentioned on the self explanatory chart .
please don`t go with the buzz around you regarding the stocks and stock market .
Please follow what Technical chart & analysis is conveying .
Bank Of India is a central government backed bank and currently it is reversal phase in terms of chart pattern.
Higher-High & Higher-Low getting formed in longer time-frame like Weekly & monthly chart .
Please feel free to comment or share your views on my analysis .
Note : I am not SEBI registered advisor . Please consider my analysis for education purpose only .

A-Book vs B-Book: What Every Retail Trader Needs to KnowMost retail CFD traders have never even heard the terms “A-Book” and “B-Book,” yet almost all of them are directly affected by how these models work. Your broker’s choice between the two can change the prices you see, how your orders are filled, and even whether your stop loss gets hit. Let’s break it down so you know exactly what’s going on behind the scenes.
█ What is A-Book?
An A-Book broker routes your orders straight to external liquidity providers, such as banks, market makers, or directly to an exchange in the case of futures or spot markets. Your broker is essentially the middleman, passing your trade along and matching it with a real counterparty.
⚪ How they make money:
Spreads (the difference between the bid and ask prices).
Commissions on each trade.
Occasionally a small markup on the feed.
Because they don’t profit when you lose, an A-Book broker’s ideal client is a trader who trades frequently and consistently, your activity is their revenue stream.
█ What is B-Book?
A B-Book broker keeps your trades “in-house,” meaning they take the other side of your position. If you buy, they sell; if you sell, they buy, but all within their own system. Your trades don’t reach the real market at all.
⚪ How they make money:
Your losses are their profits.
They may still earn on spreads and commissions, but the main income is the net loss of their client base.

BUY TODAY SELL TOMORROW for 5%DON’T HAVE TIME TO MANAGE YOUR TRADES?
- Take BTST trades at 3:25 pm every day
- Try to exit by taking 4-7% profit of each trade
- SL can also be maintained as closing below the low of the breakout candle
Now, why do I prefer BTST over swing trades? The primary reason is that I have observed that 90% of the stocks give most of the movement in just 1-2 days and the rest of the time they either consolidate or fall
Resistance Breakout in LINCOLN
BUY TODAY SELL TOMORROW for 5%

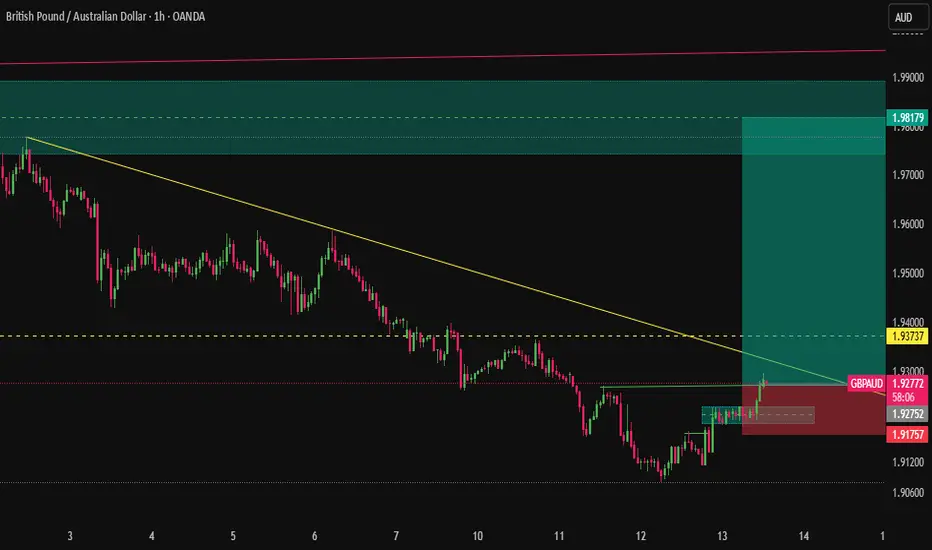
The "High R:R" Power PlayThe tides are turning for GBPAUD. After a prolonged bearish slide, we are witnessing a textbook structural shift on the 1H timeframe.