Tech Mahindra - Weekly Long On the weekly chart of Tech Mahindra, the recent candles show strong bullish behavior. After spending many months in a wide range, price has formed a rounded base and is now printing higher highs with solid green candles near the earlier resistance zone around 1,750. The latest candle closes near the high, showing that buyers are in control and sellers are not able to push price down. This kind of structure often appears at the start of a new medium-term uptrend.
The trend is clearly shifting upward. From the April 2025 low, the stock has made a series of higher lows and is now moving in a smooth rising arc. The previous supply zone from December 2024 has been tested again and price is holding above it. This change from resistance to support is a classic sign of trend reversal. As long as price stays above the rising trend path, the bias remains positive.
RSI is above 70 and has crossed and sustained above 60, which signals strong momentum. This shows that the stock has moved from a neutral phase into a bullish phase. In trending markets, RSI can stay in the upper zone for a long time, so this strength supports continuation rather than immediate weakness.
Volumes are rising during the recent upward move. The breakout candles are accompanied by higher volume compared to the previous weeks, which confirms genuine participation. When price rises with expanding volume, it reflects accumulation by stronger hands and improves the reliability of the move.
A safer entry can be on a weekly close above 1,770–1,780, or on a pullback towards 1,680–1,700 if price respects this zone as support. This allows better risk control. The stop loss can be placed below 1,600 on a closing basis, which lies below the recent swing low and trend support. The first target comes near 1,950, which is the next major supply area. If the trend remains strong, a higher target in the 2,200–2,280 zone is possible over the medium term.
This analysis is for educational purposes only. It is not a buy or sell recommendation. Stock market investments involve risk, and prices can move unpredictably. Always do your own research and consult a qualified financial advisor before making any trading or investment decision.
X-indicator


XAUUSD (H2) - Liam Plan (Jan 28)XAUUSD (H2) – Liam Plan (Jan 28)
New ATH, strong safe-haven flow | Follow trend, buy FVG pullbacks only
Quick summary
Gold continues to print new all-time highs as global capital rotates into safe-haven assets amid persistent economic and geopolitical uncertainty tied to recent US policy decisions. Additional support comes from concerns around Fed independence and expectations of lower US rates, keeping real yields capped.
Despite the bullish backdrop, price is now extended above equilibrium. The edge is not in chasing strength, but in waiting for pullbacks into imbalance and liquidity zones.
➡️ Bias stays bullish, execution stays patient.
Macro context (why gold stays bid, but volatile)
Ongoing geopolitical uncertainty keeps structural demand for gold intact.
Rate-cut expectations and doubts around Fed autonomy weaken the USD’s long-term appeal.
USD is attempting a technical bounce, but this has not shifted gold’s underlying bid.
➡️ Conclusion: macro supports higher prices, but short-term moves will likely rotate to rebalance inefficiencies.
Technical view (H2 – based on the chart)
Price is trending cleanly higher after multiple bullish BOS, riding an ascending structure and expanding into premium.
Key levels from the chart:
✅ Major extension / sell-side target: 5280 – 5320 (2.618 fib expansion)
✅ FVG / continuation buy zone: 5155 – 5170
✅ Structure support: 5000 – 5050
✅ Trend invalidation (deeper): below 4950
Current price action suggests a likely path of push → pullback → continuation, rather than straight-line expansion.
Trading scenarios (Liam style: trade the level)
1️⃣ BUY scenarios (priority – trend continuation)
A. BUY the FVG pullback (cleanest setup)
✅ Buy zone: 5155 – 5170
Condition: price taps FVG and shows bullish reaction (reclaim / HL / displacement on M15–H1)
SL (guide): below 5125 or below reaction low
TP1: recent high
TP2: 5280
TP3: 5320+ if momentum expands
Logic: This FVG aligns with prior buy-side liquidity and structure — a high-probability continuation zone.
B. BUY deeper structure support (only if volatility spikes)
✅ Buy zone: 5000 – 5050
Condition: liquidity sweep + strong rejection
TP: 5170 → 5280
Logic: This is value within trend. No interest in longs above premium if this level breaks.
2️⃣ SELL scenarios (secondary – reaction only)
SELL at extension (scalp / tactical only)
✅ Sell zone: 5280 – 5320
Condition: clear rejection / failure to hold highs on lower TF
TP: 5200 → 5170
Logic: Extension zones are for profit-taking and short-term mean rotation, not trend reversal calls.
Key notes
New ATHs invite FOMO — don’t be that liquidity.
Best trades come after pullbacks, not during impulse candles.
Reduce size around Fed headlines.
What’s your plan: buying the 5155–5170 FVG pullback, or waiting for a stretch into 5280–5320 to fade the reaction?
— Liam

Gold retraces after surge – trend remains intact.Quick Context
Recent geopolitical uncertainty continues to support safe-haven flows. Gold has already delivered a strong bullish impulse, and the current move looks like a healthy correction, not a reversal.
Technical Snapshot (H1–H4)
Strong bullish impulse already completed
Current price action = controlled retracement
No bearish CHoCH, no structural breakdown
Market is resetting momentum after expansion
This is typical impulse → retrace → continuation behavior.
Key Levels to Watch
Buy Zone: 5,180 – 5,160
Invalidation: H1 close below 5,120
Upside continuation targets:
5,300
5,360
Extension toward 5,440+
If – Then Logic
If price holds above 5,160 → expect continuation higher
If price sweeps into 5,180–5,160 and reacts → buy-the-dip opportunity
Only if H1 closes below 5,120 → bullish bias weakens
Bottom Line
Gold is not reversing — it is reloading.
Pullbacks are part of trend strength.
Wait for reaction, not confirmation at the highs.

XAUUSD – M45 Tech AnalysisXAUUSD – M45 Technical Outlook: Strong Momentum, Now Watch Liquidity Reactions | Lana ✨
Gold has surged above $5,250, extending its buying position with strong momentum. Price action remains constructive, but as the market pushes deeper into premium territory, liquidity reactions become more important than raw momentum.
📈 Market Structure & Price Action
Gold continues to trade inside a well-defined ascending channel, confirming a strong bullish structure.
Multiple BOS (Break of Structure) points on the chart highlight persistent buyer control.
The recent leg higher was aggressive, indicating momentum-driven buying, but also increasing the likelihood of short-term reactions.
At current levels, the market is extended above value, which often precedes either consolidation or a controlled pullback.
🔍 Key Technical Zones on M45
Upper Supply / Reaction Zone: 5280 – 5310
This area represents a premium zone where price may face profit-taking or liquidity sweeps before choosing direction.
Immediate Support (Channel Mid / Retest Zone): 5200 – 5220
A key area where price could pull back and attempt to hold structure.
Strong Sell-Side Liquidity Zone: around 5050
Marked clearly on the chart, this is a deeper level where liquidity is resting and where stronger buyer reactions could emerge if the pullback extends.
As long as price remains inside the channel, the broader bullish bias stays intact.
🎯 Trading Scenarios
Scenario 1 – Extension With Caution:
If price continues higher into the 5280–5310 zone, expect increased volatility and potential short-term rejection. This area is better suited for risk management and observation, not aggressive chasing.
Scenario 2 – Healthy Pullback (Preferred):
A pullback toward 5200–5220 would allow price to rebalance liquidity while maintaining structure. Holding this zone supports continuation within the channel.
Scenario 3 – Deeper Liquidity Sweep:
If volatility expands, a move toward the ~5050 sell-side liquidity zone could occur before a stronger continuation leg develops.
🌍 Market Context (Brief)
Gold’s sharp move above $5,250 reflects ongoing demand for safe-haven assets amid persistent macro and geopolitical uncertainty. Strong daily gains reinforce bullish sentiment, but such vertical moves also tend to attract short-term profit-taking, making structure and liquidity levels critical.
🧠 Lana’s View
The trend is bullish, but not every bullish move is a buy.
At extended levels, Lana focuses on how price reacts at liquidity zones, not on chasing momentum.
✨ Respect the structure, stay patient near extremes, and let the market come to your levels.

Part 3 Institutional vs. TechnicalOption Trading StrategiesHere are some popular option trading strategies:
1. Long Call/Put- Long Call: Buy call option to bet on price increase.
- Long Put: Buy put option to bet on price decrease.
2. Covered Call- Sell call option on stock you own to generate income.
3. Protective Put- Buy put option on stock you own to hedge against losses.
4. Straddle- Buy call and put options at same strike price and expiry to profit from volatility.
5. Spread Strategies- Bull Call Spread: Buy call at lower strike, sell call at higher strike.
- Bear Put Spread: Buy put at higher strike, sell put at lower strike.

STARHEALTH 1 Week Time Frame 📊 Weekly Price Range (1‑Week History)
High (last week): ~₹469.8
Low (last week): ~₹442.45
(Source: Marketscreener weekly price extremes)
📌 Key Weekly Support Levels
Support zones you may watch on the weekly timeframe:
1. Support 1: ~₹440–₹442 (recent weekly low)
2. Support 2: ~₹430 area (round‑number psychological / pivot cluster)
3. Support 3: ~₹408–₹415 range (broader structural support from pivot supports seen on shorter pivots)
Weakness below ₹430 could open the lower band towards ₹405–₹410.
📌 Key Weekly Resistance Levels
Potential weekly resistance zones to monitor:
1. Resistance 1: ~₹470–₹472 (recent weekly highs & EMA cluster)
2. Resistance 2: ~₹480–₹485 (psychological and medium MA area)
3. Resistance 3: ~₹495+ (upper pivot / longer‑term range top)
A weekly close above ₹480–₹485 would indicate stronger upside pressure.
📈 Technical Indicator Context (Weekly)
RSI and weekly momentum indicators on some platforms suggest neutral‑to‑slightly bullish conditions rather than extreme overbought levels.
Weekly pivot and moving average positions (when available) confirm ₹462–₹470 as an important zone for bullish continuation.

HPCL 1 Month Time Frame 📌 Current Price Reference
HPCL’s share price is around ₹410 – ₹435 in late January 2026.
📊 1‑Month Technical Levels
🔵 Support Levels (Downside)
These are zones where the price historically finds buying interest or could rebound if selling increases:
1. Major Support: ~ ₹449–₹454 — key near‑term support zone (weekly lower support).
2. Secondary Support: ~ ₹460 — if price consolidates above this level, trend may hold.
3. Deeper Support Zone: ~ ₹454–₹449 (extended pullback).
4. Additional Lower Band: Recent pivot around ₹440–₹435 from broader charts (may act short‑term cushion).
➡️ Break below these can signal further downside to the 1‑month range.
🔴 Resistance Levels (Upside)
These are levels where price might face selling pressure or may struggle to sustain gains:
1. Immediate Resistance: ~ ₹478–₹481 — short‑term ceiling.
2. Next Key Barrier: ~ ₹484–₹486 — stronger resistance zone.
3. Stretch/Upper Target: ~ ₹490–₹494 (+) — if momentum continues bullishly.
⚖️ Pivot Reference
Pivot Level: ~ ₹449 — central point indicating bias above this tends mildly bullish, below could favor sellers.

Nifty 50 1 Week Time Frame 📊 Current Level (approx)
Nifty 50 ~ 25,200–25,350 area as of the last trading sessions (January 27–28, 2026).
📈 Key Weekly Levels to Watch
🔹 Immediate Resistance
1. ~25,300–25,350 — short‑term upside barrier (recent highs around these levels).
2. ~25,500–25,700+ — next major resistance zone (from prior weekly technical analysis, a breakout above ~26,100 historically signalled stronger bullish control).
🔻 Support Zones
1. ~24,900–25,000 — key short‑term support defended in recent sessions and noted by traders as a pivot area.
2. ~24,500–24,700 — broader weekly support zone (buffer from intermediate trend lines / moving averages).
3. ~24,200–24,300 — deeper weekly support; breach here could imply stronger correction risk.
📌 Weekly Trading Range (Probable)
Based on recent technical ranges and previous weekly outlooks:
➡️ Bullish bias above ~25,000 with resistance towards 25,500–25,700+.
➡️ Bearish/mixed bias if breaks below ~24,900, with support down to 24,500 and 24,200 zones.
⚠️ Important Notes
These levels are technical references used by traders — not investment advice.
Weekly support/resistance can shift quickly with strong market moves or macro events (especially around global policy news or earnings).
Always use stop losses and proper risk management if trading off these levels.

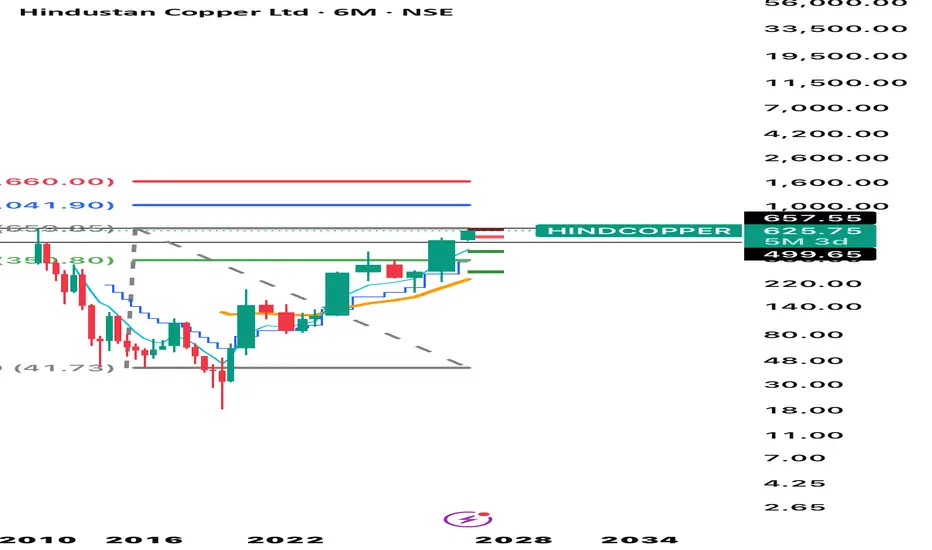
Copper Copper
ज़रूर 👍
नीचे Copper (तांबा) पर आधारित Stock Market Article हिंदी में लिख रहा हूँ — जो ट्रेडिंग, इन्वेस्टमेंट और इंडस्ट्री तीनों एंगल से काम आए।
⸻
📌 Copper (तांबा) और Stock Market: एक पूरा विश्लेषण
Copper यानी तांबा को stock market में “Dr. Copper” भी कहा जाता है, क्योंकि यह दुनिया की आर्थिक सेहत का अच्छा संकेतक माना जाता है। जब अर्थव्यवस्था बढ़ती है, तो Copper की मांग बढ़ती है, और जब मंदी आती है, तो इसकी मांग घटती है।
⸻
🔹 Copper की Demand क्यों बढ़ती है?
Copper का इस्तेमाल कई अहम सेक्टर्स में होता है:
• 🏗️ Construction & Real Estate
• ⚡ Power & Electrical Industry
• 🚗 Electric Vehicles (EV)
• 🔋 Renewable Energy (Solar, Wind)
• 📱 Electronics & Technology
EV और Green Energy Revolution के कारण आने वाले समय में Copper की demand और तेज़ होने की उम्मीद है।
⸻
🔹 Copper Price किन फैक्टर्स पर निर्भर करती है?
1. Global Economic Growth – चीन, अमेरिका और यूरोप की डिमांड
2. US Dollar Index – डॉलर कमजोर = Copper तेज
3. Supply Disruptions – Mining strikes, geopolitical issues
4. Inflation & Interest Rates
5. EV और Infrastructure Spending
⸻
🔹 India में Copper से जुड़े प्रमुख Stocks
भारतीय stock market में Copper से जुड़े कुछ अहम शेयर:
• Hindustan Copper Ltd
👉 Government-backed company, mining + refining
• Vedanta Ltd
👉 Copper + Zinc + Aluminium exposure
• Hindalco Industries
👉 Indirect benefit through metals demand
• Sterlite Technologies
👉 Copper cables & telecom infra
📌 Note: Hindustan Copper pure-play copper stock माना जाता है।
⸻
🔹 Copper: Trading vs Investment
Short-Term Traders के लिए:
• MCX Copper Futures
• Global cues + USD movement पर focus
Long-Term Investors के लिए:
• EV, Infra और Renewable Energy theme
• Copper stocks accumulation on dips
⸻
🔹 Risk Factors ⚠️
• Global recession
• China demand slowdown
• Commodity price volatility
• Government policies & environmental norms
⸻
🔹 निष्कर्ष (Conclusion)
Copper आने वाले समय में Future Metal माना जा रहा है।
जो निवेशक EV, Green Energy और Infrastructure growth पर भरोसा रखते हैं, उनके portfolio में Copper stocks एक अच्छा diversification दे सकते हैं।
📈 “जब दुनिया बनती है, तब Copper चमकता है।”
⸻
अगर चाहो तो मैं:
• इसी पर YouTube वीडियो का script
• Thumbnail text
• या Hindustan Copper का detailed stock analysis
भी बना दूँ 😊
BEMLBEML
Bullish Trend is Showing On The Chart.
Buy Signals in
Technical Indicators And
Descending Channel Pattern.
BUYING RANGE 1700/1720

BDLBDL
bullish trend is Showing on the chart.
buy signals in
technical indicators and
Descending Channel Pattern.
BUYING RANGE 1400/1410
Watch for a retest 1400/1410 to sustain the bullish trend. If the resistance holds, there could be a retest towards 1290/1300 and an uptrend from here.

AI & Technology Sector LeadershipNavigating Innovation, Strategy, and Global Impact
The Artificial Intelligence (AI) and broader technology sectors have become pivotal drivers of the global economy, reshaping industries, markets, and societies. Leadership within this domain is not simply about managing companies; it requires a visionary approach, combining technological expertise, strategic foresight, and an understanding of societal impact. Effective leadership in AI and technology is thus characterized by the ability to navigate rapid innovation, drive sustainable growth, and maintain ethical stewardship over emerging technologies.
1. The Landscape of AI & Technology
The AI and technology sector is remarkably diverse, encompassing areas such as software development, cloud computing, machine learning, robotics, semiconductors, cybersecurity, and more recently, generative AI and quantum computing. The sector’s growth trajectory has been exponential, fueled by data proliferation, advances in computing power, and evolving consumer behavior. According to industry reports, AI alone is expected to contribute trillions to the global economy over the next decade, with applications ranging from autonomous vehicles and precision medicine to personalized marketing and predictive analytics.
This rapid expansion places unique demands on leadership. Unlike traditional industries, technology leaders must contend with disruption as a constant, where yesterday’s innovation quickly becomes obsolete. Successful leaders are those who can anticipate trends, align their organizations with emerging opportunities, and foster a culture of continuous learning and adaptability.
2. Core Traits of Technology Sector Leaders
Leadership in the AI and technology space is defined by several core traits:
a. Visionary Thinking: Technology leaders must envision the future impact of their innovations. For instance, AI leaders are not merely focused on developing algorithms; they must understand how these solutions reshape industries, improve efficiency, and enhance human experiences. Visionary leadership entails strategic foresight, the ability to identify trends, and the courage to pursue transformative projects even amidst uncertainty.
b. Technical Acumen: While leadership encompasses more than technical expertise, understanding the technological underpinnings of one’s business is critical. Leaders must grasp AI architectures, cloud systems, cybersecurity frameworks, or software development processes to make informed strategic decisions, allocate resources efficiently, and guide teams effectively.
c. Agility and Adaptability: The pace of technological change demands leaders who can pivot quickly. Organizations led by adaptive leaders can respond to disruptive innovations, emerging competitors, and shifting regulatory landscapes. Agility also extends to workforce management, ensuring that talent development, recruitment, and reskilling initiatives keep pace with evolving technological demands.
d. Ethical and Responsible Leadership: With AI and technology increasingly influencing society, ethical considerations are central to leadership. Leaders must navigate issues such as data privacy, algorithmic bias, environmental sustainability, and the societal impact of automation. Ethical stewardship enhances public trust, mitigates reputational risks, and aligns technology deployment with human-centered values.
e. Collaborative and Inclusive Leadership: Innovation rarely occurs in isolation. Leaders must foster collaborative environments where cross-functional teams, diverse perspectives, and open communication drive creativity. Inclusivity in hiring, team management, and product development ensures that solutions are equitable and resonate across diverse markets.
3. Strategic Pillars of Leadership in AI & Technology
a. Innovation Management: At the core of technology leadership is the ability to manage and scale innovation. This involves identifying promising research areas, funding exploratory projects, and maintaining a balance between short-term returns and long-term breakthroughs. Companies like Google, Microsoft, and Tesla exemplify how strategic investment in R&D fuels competitive advantage.
b. Talent Acquisition and Development: Human capital is the lifeblood of AI and technology companies. Leaders must attract top engineers, data scientists, and researchers while fostering a culture of continuous learning. Initiatives such as hackathons, mentorship programs, and partnerships with academic institutions enable the cultivation of skills that align with future technological trends.
c. Market and Competitive Strategy: Successful leaders must translate technological capability into market advantage. This includes understanding customer needs, differentiating products, and leveraging partnerships or acquisitions to expand technological capabilities. Strategic decisions in AI, for example, may involve whether to focus on enterprise applications, consumer-facing solutions, or industry-specific platforms.
d. Regulatory and Policy Navigation: AI and technology sectors operate under increasing regulatory scrutiny. Leaders must proactively engage with policymakers, comply with evolving regulations, and anticipate geopolitical implications of technology deployment. Cybersecurity, data governance, and AI safety regulations require a proactive approach to risk management and corporate responsibility.
4. Case Studies in Leadership
a. Sundar Pichai – Alphabet Inc.: Under Pichai’s leadership, Alphabet has maintained dominance in AI and cloud computing while expanding into new arenas such as autonomous vehicles and quantum computing. Pichai exemplifies a balance of technical understanding, visionary strategy, and global market navigation.
b. Satya Nadella – Microsoft: Nadella’s tenure is a testament to transformative leadership. By pivoting Microsoft toward cloud computing, AI, and enterprise solutions, he revitalized the company’s growth trajectory. Nadella emphasized culture, collaboration, and inclusivity, demonstrating that technological leadership is inseparable from organizational culture.
c. Jensen Huang – NVIDIA: Huang has led NVIDIA to become a global leader in AI hardware, leveraging GPU technology to drive advances in machine learning. His focus on innovation, market foresight, and ecosystem-building underscores the importance of aligning technological capability with strategic market positioning.
5. Challenges and Future Directions
a. Rapid Technological Change: Leaders must continuously monitor emerging technologies and assess their relevance. From AI generative models to quantum computing, staying ahead of technological curves is a constant challenge.
b. Ethical Dilemmas: As AI systems influence decision-making in finance, healthcare, and law enforcement, leaders face heightened scrutiny over fairness, transparency, and accountability. Navigating these ethical dilemmas is increasingly central to leadership effectiveness.
c. Global Competition and Geopolitics: Technology leadership is also shaped by international dynamics. Trade restrictions, intellectual property disputes, and differing regulatory frameworks require leaders to adopt globally informed strategies.
d. Workforce Evolution: Automation and AI are reshaping job roles, creating opportunities and displacing traditional functions. Leaders must manage workforce transitions, reskill employees, and foster a culture that embraces change.
6. The Role of AI in Leadership Itself
Interestingly, AI is also transforming leadership practices. AI-driven analytics and predictive models enhance decision-making, optimize operations, and improve customer insights. Leaders who leverage AI for strategic foresight, risk management, and organizational efficiency gain a competitive advantage. However, reliance on AI also requires caution to avoid overdependence on algorithms at the expense of human judgment and ethical considerations.
7. Conclusion
Leadership in the AI and technology sector is multidimensional, combining vision, technical expertise, ethical stewardship, and strategic agility. It is not simply about producing innovative products but shaping the trajectory of industries and societies. Leaders must navigate rapid technological change, global competition, regulatory complexities, and ethical dilemmas while fostering inclusive and innovative organizational cultures.
The future of AI and technology leadership will increasingly demand a synthesis of human and artificial intelligence capabilities, where leaders not only leverage technological tools but also ensure that their applications align with societal values and global progress. Those who can balance innovation with responsibility, agility with strategy, and technical insight with ethical foresight will define the next era of technological advancement, driving growth, transformation, and sustainable impact worldwide.

Kiwi Analysis: Bullish ContinuationThe NZD/USD has exhibited strong bullish momentum over the last few days, successfully climbing out of the 0.5980 consolidation zone. We are currently seeing a classic technical setup: the Break and Retest of a key structural level.

Deglobalization & Supply Chain Shifts: A Comprehensive AnalysisUnderstanding Deglobalization
Deglobalization refers to the reduction in global interdependence in trade, finance, and production. Unlike globalization, which emphasizes interconnectedness and the free flow of goods, services, and capital, deglobalization involves a partial reversal of these processes. It does not imply complete isolation but reflects regionalization, reshoring, and diversification of supply chains to reduce vulnerability to global shocks.
Key drivers of deglobalization include:
Geopolitical Tensions: Conflicts between major powers, such as the U.S.-China rivalry, have introduced tariffs, sanctions, and restrictions on technology and trade. Companies are forced to rethink reliance on politically sensitive regions. For instance, semiconductor supply chains have seen significant reshaping due to export restrictions on advanced chips.
Pandemic Disruptions: The COVID-19 pandemic exposed vulnerabilities in global supply chains. Lockdowns, port closures, and labor shortages highlighted the risks of concentrated production in a few regions. Companies realized that efficiency-focused supply chains could be fragile, leading to a shift toward resilience and risk mitigation.
Rising Protectionism: Nationalist and protectionist policies, including tariffs and local content requirements, have incentivized companies to reduce dependence on foreign suppliers. Governments are increasingly promoting self-sufficiency in critical sectors such as energy, defense, and healthcare.
Technological Shifts: Automation, AI, and advanced manufacturing techniques reduce the cost advantage of low-wage countries. Companies can now consider reshoring production closer to end markets without sacrificing efficiency.
Implications for Global Supply Chains
Deglobalization has triggered major shifts in supply chain strategies, affecting sourcing, manufacturing, logistics, and risk management. These shifts can be categorized as follows:
1. Reshoring and Nearshoring
Reshoring involves bringing production back to the home country, while nearshoring shifts production to nearby countries within the same region. Companies are increasingly moving away from single-source suppliers in distant regions to reduce geopolitical and logistical risks.
Example: U.S. companies are increasingly sourcing electronics from Mexico or Southeast Asia instead of China.
Benefits include reduced transportation costs, shorter lead times, and better compliance with local regulations.
Challenges include higher labor costs and potential skill gaps in domestic manufacturing.
2. Diversification of Suppliers
Companies are no longer relying on a single country or supplier for critical components. Multi-sourcing strategies reduce the risk of disruption due to political conflicts, natural disasters, or pandemics.
Example: Automotive and electronics companies are diversifying chip suppliers across Taiwan, South Korea, the U.S., and Europe.
Diversification requires advanced supply chain analytics, forecasting, and relationship management to maintain efficiency.
3. Regional Supply Chains
There is a growing focus on regionalization, where companies develop supply chains within a geographic cluster. Regional trade agreements, such as the USMCA (United States-Mexico-Canada Agreement) and RCEP (Regional Comprehensive Economic Partnership in Asia), encourage localized production.
Regional supply chains reduce exposure to long-distance shipping risks, tariffs, and currency fluctuations.
They also promote sustainability by reducing carbon emissions associated with global logistics.
4. Increased Inventory and Buffer Stocks
Just-in-time (JIT) manufacturing, a hallmark of globalization, is being reconsidered. Companies are maintaining higher inventories and safety stocks to withstand supply disruptions.
This shift increases costs but ensures supply chain resilience.
Key industries adopting this approach include pharmaceuticals, semiconductors, and critical machinery.
5. Investment in Digital Supply Chains
Digitalization plays a central role in adapting to deglobalization. Advanced data analytics, AI, IoT, and blockchain enable companies to monitor global supply chain risks in real-time.
Example: Predictive analytics help firms anticipate disruptions, adjust production schedules, and optimize logistics.
Blockchain enhances traceability, crucial for compliance with new local content laws and sustainability regulations.
Sectoral Impacts
Deglobalization affects industries differently:
Technology and Electronics: Heavily dependent on global supply chains, these sectors are relocating production to secure chip manufacturing and critical components. The U.S. CHIPS Act incentivizes domestic semiconductor production.
Automotive Industry: Global auto manufacturing has been disrupted by semiconductor shortages. Companies are regionalizing production and investing in EV battery manufacturing closer to end markets.
Pharmaceuticals: COVID-19 highlighted dependence on China and India for APIs (Active Pharmaceutical Ingredients). Many countries are now investing in local production to ensure health security.
Consumer Goods: Companies are diversifying suppliers to avoid disruptions in goods such as clothing, electronics, and household products.
Economic and Strategic Implications
Deglobalization has wide-ranging consequences:
Higher Production Costs: Shifting production closer to home or diversifying suppliers increases labor, logistics, and compliance costs. This could result in higher consumer prices.
Supply Chain Resilience: Companies are willing to trade efficiency for reliability. Resilient supply chains are less prone to disruption from geopolitical or environmental events.
Shift in Trade Patterns: Emerging markets that previously benefited from globalization may face slower growth as global production becomes more regionalized.
Innovation and Competitiveness: Nearshoring and reshoring may stimulate innovation in domestic manufacturing, robotics, and automation, boosting long-term competitiveness.
Policy and Regulatory Focus: Governments are actively shaping industrial policies to ensure national security and self-reliance. Strategic sectors such as energy, defense, and healthcare will see sustained support.
Challenges and Risks
While deglobalization promotes resilience, it is not without challenges:
Cost Inflation: Regionalization and reshoring are expensive, potentially squeezing profit margins.
Complex Supply Management: Managing multiple suppliers across regions increases operational complexity.
Trade Tensions: Fragmentation of global trade can lead to inefficiencies and reduced economies of scale.
Environmental Concerns: While regionalization reduces shipping emissions, increased local production may increase energy consumption if production relies on carbon-intensive processes.
Future Outlook
The trajectory of deglobalization suggests a hybrid model for global supply chains:
Selective Globalization: Companies will retain global networks for certain low-cost, non-critical products while regionalizing critical components.
Resilience as Priority: Supply chain decisions will prioritize risk mitigation over cost efficiency.
Technological Integration: AI, automation, and digital twins will transform supply chain management, enabling agility and rapid response to disruptions.
Policy-Driven Strategies: Trade policies, subsidies, and geopolitical pressures will continue to shape supply chain structures.
In essence, the future of global supply chains will be less about maximizing cost efficiency and more about building robustness and adaptability. Companies that successfully balance efficiency with resilience will gain a competitive edge in an increasingly unpredictable global landscape.
Conclusion
Deglobalization represents a paradigm shift in the global economy, driven by geopolitical risks, pandemics, protectionism, and technological evolution. The shift is fundamentally reshaping supply chains through reshoring, nearshoring, diversification, and digitalization. While these changes entail higher costs and operational complexities, they also provide an opportunity to build resilient, flexible, and strategically secure supply chains. The companies and nations that adapt effectively to these changes will navigate the challenges of the post-globalization era while ensuring long-term sustainability and competitiveness.

gold spot or mcx update after fresh breakoutgold spot eyes on 5200$ if mkt close abv than next up side move 5400-5800$ near terms where support 5230 if stay blow than down side expect 5210--5190--5170$ over all looks boom but profit booking expect . mcx gold April looks abv 173000 up side move 177-185000+++ where support 169000 if stay bleow than down side correction expect til 165--161000+++ no if and but.
yes a;; eyes on support lvl if mkt hold thna no doubt to up side buy on dip good way

Inflation Dynamics: Understanding the Forces Shaping Price LevelIntroduction
Inflation, the sustained increase in the general price level of goods and services in an economy, is a central concern for policymakers, businesses, and households. While moderate inflation can stimulate economic activity, uncontrolled inflation—or hyperinflation—can erode purchasing power, destabilize markets, and disrupt economic planning. Understanding inflation dynamics involves analyzing how various factors interact to drive price changes over time, the transmission mechanisms through which inflation spreads across sectors, and the broader economic consequences.
1. Causes of Inflation
Inflation is not driven by a single factor but by the interaction of multiple economic, structural, and psychological elements. Economists categorize the primary causes into three broad groups: demand-pull, cost-push, and built-in inflation.
a) Demand-Pull Inflation
Demand-pull inflation occurs when aggregate demand exceeds aggregate supply in an economy. This typically arises in periods of strong economic growth when consumers, businesses, and governments increase spending simultaneously. The imbalance between demand and supply pushes prices higher.
Key drivers include:
Rising consumer incomes: When wages grow faster than productivity, consumers have more disposable income, increasing demand for goods and services.
Expansionary fiscal policy: Government spending and tax cuts boost aggregate demand.
Monetary policy effects: Low interest rates and increased credit availability encourage borrowing and spending.
External demand shocks: Strong demand for exports can push domestic prices upward.
b) Cost-Push Inflation
Cost-push inflation arises when the cost of production increases, leading firms to pass higher costs onto consumers. Key factors include:
Rising wages: Labor strikes or increased minimum wages raise production costs.
Commodity price shocks: Increases in essential inputs like oil, metals, or agricultural products can ripple through the economy.
Supply chain disruptions: Events such as natural disasters, geopolitical tensions, or pandemics can constrain supply and elevate prices.
c) Built-in Inflation (Wage-Price Spiral)
Built-in inflation results from expectations of future inflation. When workers expect prices to rise, they demand higher wages, which increases firms’ costs, prompting higher prices for goods—a cycle that can reinforce itself. This dynamic underscores the importance of inflation expectations in shaping actual inflation.
2. Types of Inflation and Their Dynamics
Inflation is not homogeneous; it manifests in different forms depending on its origin, pace, and economic context.
a) Creeping Inflation – Low and steady (1–3% annually), typically considered healthy for economic growth.
b) Galloping Inflation – Rapid but manageable inflation (10–50% annually), creating uncertainty and discouraging long-term investment.
c) Hyperinflation – Extremely high and accelerating inflation, often exceeding 50% per month, eroding savings and destabilizing the economy.
Inflation dynamics also differ by sector. For instance, energy and food prices are highly volatile due to supply shocks, while housing and healthcare may exhibit more gradual, persistent increases. Understanding sectoral dynamics helps policymakers target interventions effectively.
3. Transmission Mechanisms of Inflation
Inflation does not affect the economy uniformly. Its propagation depends on several mechanisms:
a) Wage-Price Spiral
As discussed, expectations of higher prices lead workers to demand higher wages. Firms then increase prices to maintain profit margins, reinforcing the inflation cycle. Central banks often monitor wage growth to anticipate potential inflation pressures.
b) Monetary Transmission Mechanism
Central banks control inflation primarily through interest rates and money supply. Lower interest rates stimulate borrowing and spending, potentially increasing demand-pull inflation. Conversely, higher rates curb spending, reducing inflationary pressures. However, monetary policy often affects inflation with a lag, complicating timely interventions.
c) Exchange Rate Channel
Currency depreciation raises the cost of imported goods, contributing to imported inflation. Countries reliant on imports for energy, raw materials, or consumer goods are particularly vulnerable. Conversely, a strong currency can temper inflation by making imports cheaper.
d) Expectations Channel
Expectations about future inflation significantly influence current price-setting behavior. If businesses and consumers anticipate higher inflation, they adjust wages and prices upward preemptively. Credible central bank policies and communication strategies are critical to managing these expectations.
4. Measuring Inflation and Dynamics
Inflation is typically measured using indices such as the Consumer Price Index (CPI) or the Producer Price Index (PPI). However, analyzing inflation dynamics requires understanding the drivers behind these numbers:
Core Inflation: Excludes volatile items like food and energy to reveal underlying trends.
Sectoral Inflation: Examines which industries or goods are contributing most to price changes.
Headline Inflation: Captures total price change, including all goods and services.
Advanced econometric models, such as Phillips curves, structural vector autoregressions, and dynamic stochastic general equilibrium (DSGE) models, are used to analyze how shocks to demand, supply, and expectations propagate through the economy over time.
5. Consequences of Inflation
Inflation has wide-ranging effects on economic stability, growth, and income distribution:
a) Purchasing Power Erosion
Inflation reduces the real value of money. Households with fixed incomes or savings lose purchasing power, while debtors may benefit from repaying loans with devalued currency.
b) Investment and Savings Behavior
High and unpredictable inflation discourages long-term investment and encourages speculative behavior. It can also prompt households to shift from cash holdings to tangible assets like real estate or gold.
c) Redistribution Effects
Inflation can redistribute wealth between borrowers and lenders, employers and employees, and importers and exporters. Those with assets that appreciate with inflation are often protected, while wage earners may suffer if wages lag behind price increases.
d) Policy Challenges
Policymakers face trade-offs. Tightening monetary policy to control inflation can slow economic growth and increase unemployment, while loose policies may fuel further inflation.
6. Policy Responses and Managing Inflation Dynamics
Effective management of inflation dynamics requires a combination of monetary, fiscal, and structural policies:
a) Monetary Policy
Central banks primarily use interest rate adjustments and quantitative measures to control inflation. Inflation targeting—setting explicit targets for CPI growth—has become a standard approach to anchor expectations.
b) Fiscal Policy
Government spending and taxation influence aggregate demand. Prudent fiscal policy, avoiding excessive deficits, helps prevent demand-pull inflation.
c) Structural Reforms
Improving productivity, investing in infrastructure, and reducing supply bottlenecks can mitigate cost-push inflation. Diversifying energy sources and improving supply chains enhance resilience against shocks.
d) Inflation Expectations Management
Clear communication from central banks about inflation goals, policy actions, and economic outlooks is vital. Credibility can prevent self-fulfilling inflationary spirals.
Conclusion
Inflation dynamics are the result of complex interactions between demand, supply, costs, and expectations. Understanding these forces is crucial for businesses, investors, and policymakers. While moderate inflation supports growth and investment, excessive or volatile inflation destabilizes economies and erodes living standards. Successful management requires a careful blend of monetary discipline, fiscal prudence, structural reforms, and credibility in policy communication. As global economies face shocks ranging from geopolitical tensions to technological disruptions, the study of inflation dynamics remains central to sustaining economic stability and prosperity.

Elliott Wave Analysis XAUUSD – 28/01/2026
1. Momentum
Daily (D1)
– D1 momentum is still overlapping, indicating that the broader bullish move may continue.
– The prolonged overbought condition reflects excessive market enthusiasm, which also serves as a warning of increasing risk.
H4
– H4 momentum is approaching the overbought zone.
→ This suggests that a corrective move on H4 is likely to occur within the next few hours.
H1
– H1 momentum is currently overbought.
→ This indicates that short-term bullish momentum is weakening, and a corrective phase on H1 is likely before the trend resumes.
2. Elliott Wave Structure
Daily Wave Structure (D1)
– On the daily timeframe, we continue to see an extension of the blue Wave 5.
– This is understandable given the current global environment, where geopolitical and economic risks remain elevated, pushing capital flows into safe-haven assets such as gold and silver.
– However, this strong shift toward safe assets also highlights growing systemic risks within global economies.
– As mentioned last Sunday, historically, recent FOMC cycles have typically occurred during periods of consolidation or correction, followed by the start of a long-term bullish trend after the announcement.
– The key difference this time is that price has already rallied strongly ahead of FOMC. Therefore, today’s FOMC release may trigger significant volatility.
H4 Wave Structure
– As discussed in yesterday’s plan, the recent corrective move did not differ materially in size, duration, or target compared to previous corrective waves within the yellow Wave 3 structure.
→ This strongly suggests that the pullback was merely a sub-wave within yellow Wave 3, keeping the bullish structure intact.
H1 Wave Structure
– On H1, a black 5-wave structure appears to be forming inside yellow Wave 3.
– As previously stated, during an extended wave, assigning precise labels while price is still unfolding is extremely difficult and often impractical, especially under extreme market sentiment.
– However, one point remains very clear:
Looking back at previous overbought RSI conditions (highlighted on the chart), each corrective phase was followed by a new price high.
– Currently, RSI is once again deeply overbought, leading me to expect another upside push to form a new high after the correction, at least until a clear RSI divergence appears at the top.
3. Key Price Zones
– With H4 and H1 momentum preparing to turn bearish, we focus on lower support zones to look for buy opportunities in line with the dominant trend.
Potential support zones
– 5192
– 5101
Upper resistance
– On the upside, multiple Fibonacci projections from different wave structures converge around 5323.
→ This zone represents a strong resistance area.
4. Trading Plan
Buy setup zone 1
– Entry: 5193 – 5191
– Stop Loss: 5172
– TP1: 5249
– TP2: 5323
Buy setup zone 2
– Entry: 5102 – 5100
– Stop Loss: 4982
– TP1: 5192
– TP2: 5323

XAUUSD (H1) – Liam Plan (Jan 27) Bullish TrendQuick summary
Gold is still trending higher inside a clean rising channel, but price is now approaching a weak high / liquidity pocket where stop-runs are likely.
Macro backdrop adds fuel for volatility: reports suggest the US is pressuring Ukraine toward territorial concessions as part of peace talks — this kind of uncertainty often keeps safe-haven demand supported, but it can also create fast spikes + fake breaks.
➡️ Today’s rule: follow the uptrend, but only buy at liquidity test points. No chasing highs.
1) Macro context (why spikes are likely)
If markets start pricing a forced compromise in the Ukraine conflict:
risk sentiment can swing quickly,
headlines can trigger instant pumps, then sharp retraces.
✅ Safe approach: let price hit your zones first, then trade the reaction — not the headline.
2) Technical view (H1 – based on your chart)
Price is respecting an ascending channel and building liquidity around key levels.
Key levels (from the chart):
✅ Support / buy liquidity zone: 4,995 – 5,000
✅ Flip / reaction zone: 5,047
✅ Upper resistance / supply: 5,142
✅ Weak High / liquidity target: 5,192.6
✅ Extension target (1.618): 5,240.8
Bias stays bullish while inside the channel, but near 5,192–5,240 we should expect liquidity sweep → pullback behavior.
3) Trading scenarios (Liam style: trade the level)
A) BUY scenarios (priority – trend continuation)
A1. BUY the pullback into the flip zone (cleanest R:R)
✅ Buy: 5,045 – 5,050 (around 5,047)
Condition: hold + bullish reaction (HL / rejection / MSS on M15)
SL (guide): below 5,030 (or below the reaction low)
TP1: 5,085 – 5,100
TP2: 5,142
TP3: 5,192.6
Logic: This is the best “trend-following” entry — buy support, sell into liquidity above.
A2. BUY deep liquidity sweep (only if volatility hits)
✅ Buy: 4,995 – 5,000
Condition: sweep + strong reclaim (fast rejection / displacement up)
SL: below 4,980
TP: 5,047 → 5,142
Logic: This is the strongest liquidity test zone on your chart — ideal for a bounce if price flushes.
B) SELL scenarios (secondary – reaction scalps only)
B1. SELL the weak high sweep (tactical scalp)
✅ If price runs 5,192.6 and shows rejection:
Sell: 5,190 – 5,200
SL: above the sweep high
TP: 5,142 → 5,085
Logic: Weak highs often get swept first. Great for quick mean reversion back into the channel.
B2. SELL extension (highest-risk, but best location)
✅ Sell zone: 5,235 – 5,245 (around 5,240.8)
Only with clear weakness on M15–H1
TP: 5,192 → 5,142
Logic: 1.618 extension is a common exhaustion pocket — don’t short early, short the reaction.
4) Key notes
Don’t trade mid-range between 5,085–5,142 unless you’re scalping with tight rules.
Expect false breakouts near 5,192 and 5,240 during headlines.
Best execution today = buy support, take profits into liquidity.
Question:
Are you buying the 5,047 pullback, or waiting for the 5,192 sweep to sell the reaction?
— Liam

XAUUSD (Gold) 45-Minute Chart – Strong Bullish Continuation AbovTrend:
Gold is in a clear bullish trend. Price has made higher highs and higher lows, accelerating strongly on Jan 28 with a breakout and momentum expansion.
Market Structure:
Earlier consolidation zones (value areas) were broken to the upside, followed by acceptance above prior ranges.
The most recent move shows impulsive buying, suggesting institutional participation rather than a weak breakout.
Volume Profile (VCP):
Previous High Volume Nodes (HVN) around 5,080–5,120 acted as resistance, now flipped into support.
Current price is trading above the Point of Control (POC), which confirms bullish control.
Low volume above indicates price discovery, meaning less resistance overhead.
Key Levels:
Resistance: 5,270–5,300 (current highs / psychological zone)
Immediate Support: 5,120–5,100 (previous value area high)
Deeper Support: 5,020–4,980 (range low & demand zone)
Bias:
Bullish while above 5,100
Pullbacks into previous value areas are likely to attract buyers.
Trading Insight:
Best opportunities are buy-the-dip setups rather than chasing highs.
A rejection with high volume below 5,100 would be the first warning sign of a deeper correction.

GOLD Buy Pullbacks in Bullish TrendMarket Context (M30)
Gold continues to trade within a strong bullish continuation phase, holding firmly inside a well-defined ascending channel. Recent pullbacks are technical retracements for liquidity rebalancing, not signs of distribution or trend exhaustion.
On the macro side, persistent USD weakness, sustained safe-haven demand, and only modest Fed easing expectations keep the broader backdrop supportive for gold. This combination allows upside momentum to remain controlled and constructive rather than emotional.
➡️ Overall bias: Bullish – prioritize BUY setups aligned with the main trend.
Structure & Price Action
M30 structure remains intact with clear Higher Highs and Higher Lows.
Price continues to respect previous demand and key levels, confirming active buyer participation.
No bearish CHoCH has been confirmed.
The current leg is expanding toward higher Fibonacci extensions, reinforcing trend continuation.
Key insight:
👉 As long as structure holds, pullbacks represent opportunity — not risk.
Trading Plan – MMF Style
Primary Scenario – Trend-Following BUY
Focus on patience and execution at discounted levels, not chasing price at extensions.
BUY Zone 1: 5,185 – 5,170
(Short-term demand + channel support)
BUY Zone 2: 5,106 – 5,085
(Key level confluence + trendline support)
➡️ Execute BUYs only after clear bullish reaction and structure confirmation.
➡️ Avoid FOMO at extended highs.
Upside Targets:
TP1: 5,250
TP2: 5,309 (Next ATH extension zone)
Alternative Scenario
If price holds firmly above 5,250 without a meaningful pullback, wait for a break & retest before looking for continuation BUYs.
Invalidation
A confirmed M30 close below 5,044 would weaken the current bullish structure and require reassessment.
Summary
Gold remains in a controlled bullish expansion, driven by structure and macro flow. The edge is not calling the top, but buying pullbacks within demand while the trend remains intact. As long as structure holds, higher prices remain the path of least resistance.

BANDHANBNK 1 Month View 📊 Current Context (Latest Market Data)
Recent price range: ~₹145–₹152 intraday.
52-week range: ~₹128–₹192.
📈 1-Month Key Resistance Levels
These are levels where price may face selling pressure on upward moves:
Primary Resistances
1. ~₹152–₹153 — near recent highs and short-term swing resistance.
2. ~₹155–₹156 — higher pivot resistance zone seen in short-term technical data.
3. ~₹159–₹160 — aligned with 100/200-day moving averages acting as dynamic resistance.
👉 A break above ₹155–₹156 with volume could open way to ₹160+ short-term.
📉 1-Month Key Support Levels
These are levels where price may find buys/defense if it corrects:
Primary Supports
1. ~₹145–₹146 — recent short-term support and pivot zone.
2. ~₹142–₹143 — recent reaction lows intraday.
3. ~₹138–₹140 — deeper support and previous swing area.
👉 A decisive break below ₹142 may signal further weakness toward ₹138–₹136 on extended weakness.
🧠 Technical Indicators (Short-Term Bias)
RSI around mid-range (~57) — slightly bullish/neutral momentum.
Short-term moving averages mixed but range bound (20D near current price) — suggests range trading in the month.
So short-term technically, price is not in a strong trending breakout but more in a range with potentials to oscillate between support & resistance.

NIFTY KEY LEVELS FOR 28.01.2026NIFTY KEY LEVELS FOR 28.01.2026
Timeframe: 3 Minutes
If the candle stays above the pivot point, it is considered a bullish bias; if it remains below, it indicates a bearish bias. Price may reverse near Resistance 1 or Support 1. If it moves further, the next potential reversal zone is near Resistance 2 or Support 2. If these levels are also broken, we can expect the trend.
When a support or resistance level is broken, it often reverses its role; a broken resistance becomes the new support, and a broken support becomes the new resistance.
If the range(R2-S2) is narrow, the market may become volatile or trend strongly. If the range is wide, the market is more likely to remain sideways
please like and share my idea if you find it helpful
📢 Disclaimer
I am not a SEBI-registered financial adviser.
The information, views, and ideas shared here are purely for educational and informational purposes only. They are not intended as investment advice or a recommendation to buy, sell, or hold any financial instruments.
Please consult with your SEBI-registered financial advisor before making any trading or investment decisions.
Trading and investing in the stock market involves risk, and you should do your own research and analysis. You are solely responsible for any decisions made based on this research.
