X-indicator

The "Smart Money" Approach// WTI Oil: Bullish BOS & Demand RetesWTI is showing strong bullish momentum on the 1H timeframe. We just witnessed a clear Break of Structure (BOS) to the upside, signaling a continuation of the recent trend.

Bitcoin at Demand: Where Most Traders Panic and Smart Money WaitWhen I look at this chart, I don’t see weakness.
I see price reacting exactly where it should .
Bitcoin is sitting above a clearly defined demand zone, and instead of collapsing, price is slowing down and compressing.
That usually tells me the market is absorbing liquidity, not distributing .
Key things I’m focusing on:
Price is holding above ascending demand , which shows buyers are still defending structure.
Reactions from the demand zone are clean , not impulsive, a sign of controlled participation.
Overhead supply is present , which explains the compression instead of an instant breakout.
RSI bullish divergence adds confidence that downside momentum is weakening near demand.
My mindset here:
I’m not chasing moves.
I’m not panicking into demand.
I’m simply watching how price behaves here , because this zone decides whether the next move expands or fails.
As long as structure holds, patience matters more than prediction.
Disclaimer:
This analysis is for educational purposes only. Not financial advice. Always manage your risk.

Bitcoin Is Reacting, Not Breaking, Patience Before the Next MoveWhen I look at this chart, I don’t see panic or trend failure. I see price pulling back into a clearly defined demand area within a rising structure and responding from it. That matters. If sellers were truly in control, price wouldn’t pause here, it would slice through demand without hesitation. Instead, Bitcoin is holding above structure, absorbing selling pressure, and stabilising.
The repeated rejections from the upper supply zone show that resistance exists, but the key point is this: sellers are unable to push price into a breakdown. Momentum has cooled, volatility has compressed, and RSI has reset without price collapsing, all signs of balance, not weakness.
This phase feels slow and uncomfortable, especially for traders who expect constant movement, but historically this is where the market builds the base for its next decision. I’m not interested in chasing price near resistance, and I’m not interested in panic selling into demand. I want to observe how price behaves here, because reactions at structure tell the real story. As long as Bitcoin continues to respect this rising demand and doesn’t accept below it, the broader structure remains intact and upside expansion stays on the table. A clean break below structure would force me to rethink, until then, patience is the position. Sometimes the best trades don’t come from predicting the next candle. They come from waiting while price proves who is actually in control.
Disclaimer: This analysis is for educational purposes only and not financial advice. Always manage risk and trade according to your own plan.

Possibility of some cooldown on GOLD for few months.Possibility of some cooldown on GOLD for few months.
Gold after Rally to ATH of 165000+ looks reached on top end of the Channel ... Possibilities are it can consolidate near 170-175K Level for few weeks before providing new direction to the commodity.
LTP - 164K
Range 150K to 175K.
View - Cautious / Consolidation
Technicals:
Crude is seen moving in upward direction ... Crude / Equities & Gold / Silver are seen moving in opposite directions in past ... With Equities market looking to bottomed out we can see big money moving from Metals to Equity in near months.
Happy Investing.

CANDLE PATTERNS Candlestick patterns are one of the most important tools in technical analysis because they visually represent market psychology: who is in control—the buyers (bulls) or the sellers (bears). Each candlestick captures the battle between demand and supply within a specific timeframe, such as 1 minute, 5 minutes, 30 minutes, daily, or weekly. By studying the shape, size, and position of candles, traders can understand momentum, reversals, trend continuation, and market indecision.
Candlestick charts were first developed by Japanese rice merchants over 300 years ago. Today, they are used by traders across stock markets, index futures, options trading, forex, and crypto. A single candle contains four key pieces of information:
Open
High
Low
Close
A candle is generally green (bullish) if the close is above the open, and red (bearish) if the close is below the open. The body shows the range between open and close, while the wicks (shadows) show the highest and lowest price levels touched.
Patterns form when two or more candles appear together in a particular sequence indicating reversal, continuation, or indecision.

BUY TODAY SELL TOMORROW for 5%DON’T HAVE TIME TO MANAGE YOUR TRADES?
- Take BTST trades at 3:25 pm every day
- Try to exit by taking 4-7% profit of each trade
- SL can also be maintained as closing below the low of the breakout candle
Now, why do I prefer BTST over swing trades? The primary reason is that I have observed that 90% of the stocks give most of the movement in just 1-2 days and the rest of the time they either consolidate or fall
Resistance Breakout in INDSWFTLAB
BUY TODAY SELL TOMORROW for 5%

XAUUSD (Gold) | Bull vs Bear Scenerio | 28th Jan'2026XAUUSD (Gold) | Technical Outlook | 28 Jan 2026
Gold (XAU/USD) is trading near 5,291, maintaining a strong bullish trend across intraday, daily, and higher timeframes. Price is holding firmly above all major moving averages (MA5–MA200), confirming trend strength. Momentum indicators (MACD, ADX, ROC, Bull/Bear Power) support further upside, while oscillators (RSI, Stoch RSI, CCI, Williams %R) remain overbought, indicating strong momentum with chances of short-term pullbacks. Volatility remains high (ATR ~59), so key levels are crucial.
Key Levels
Support: 5,232 | 5,198 | 5,135 | 5,101
Resistance: 5,295 | 5,330 | 5,392
Intraday Pivot: 5,232
Breakout & Breakdown
Bullish (Breakout):
Buy Above: 5,295
Targets: 5,330 → 5,392 → 5,400
Trend continuation above resistance
Bearish (Breakdown):
Sell Below: 5,232
Targets: 5,198 → 5,135
Below 5,100 → 5,000–4,950 (correction zone)
Conclusion
Overall trend remains bullish. Buy-on-dips above support is preferred, but avoid chasing near highs due to overbought conditions. Trade strictly on breakout or breakdown confirmation with proper risk management.
Disclaimer :For educational purposes only. Gold trading involves high risk. Always use stop-loss and trade as per your risk appetite.

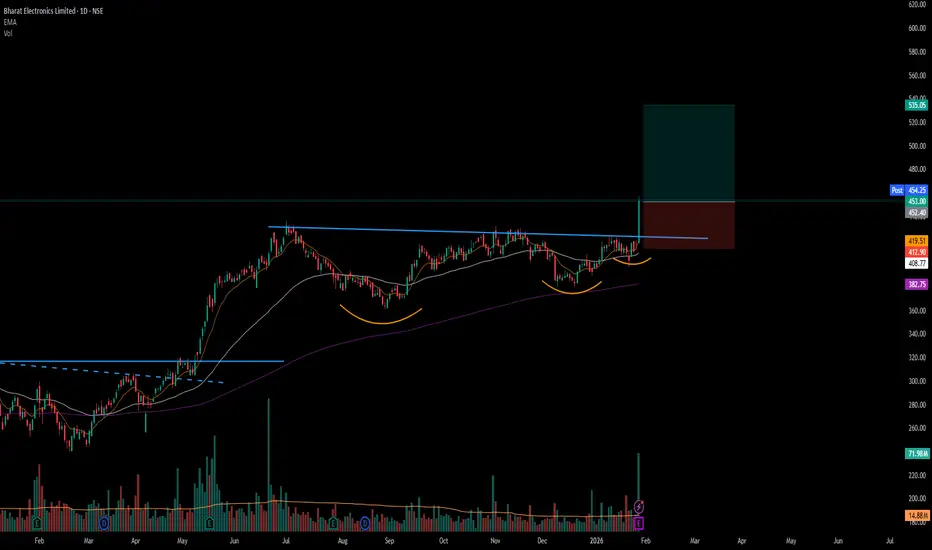
is BEL is getting ready for breakout?🔹 Timeframe: Daily
🔹 Trend Bias: Bullish
Price is moving near a key resistance zone on the daily chart
-Clear horizontal resistance tested multiple times
-Higher lows indicating accumulation
-Price holding above short & medium EMAs
🎯 What to Watch:
-Daily close above resistance for breakout confirmation
-Volume expansion on the breakout candle
Possible Targets once resistance break
target1: 440
target2: 450
Educational idea only. Not financial advice. Always manage risk.

BTC 4H UpdateAre we breaking out or faking out? 📉📈
Bitcoin is at a massive crossroads today, and the $91k level is the only thing that matters right now. We’ve seen some intense "chop" as the market prepares for today's FOMC decision.
My Technical Take:
Bullish Scenario: We need a clean flip of $91,195. If we hold that as support, I’m eyeing $95,621 as the first stop, with a potential run to $98k liquidity.
Bearish Scenario: If $91k stays as a ceiling, we likely visit the $86,355 support again. Keep a close eye on the $83k–$84k demand zone—if we drop there, that's where the real "dip-buying" begins.
The Game Plan: Volatility is the name of the game today. Don’t chase the initial wick; wait for the 4H candle close for confirmation. February is historically strong for BTC, so a breakout here could ignite a massive Q1 rally.
What’s your move? 👇 Are you Longing the breakout or Waiting for the $84k dip? Let’s talk in the replies!
#Bitcoin #BTC #CryptoTrading #FOMC #TechnicalAnalysis #TradingView #Web3

#BEL - VCP BreakOut in Daily Time Frame Script: BEL
Key highlights: 💡⚡
📈 VCP BreakOut in Daily Time Frame
📈 Volume spike during Breakout
📈 Base BreakOut
📈 RS Line making 52WH
📈 MACD Crossover
⚠️ Important: Market conditions are BAD, Avoid entering any Trade. Protect Capital Always
⚠️ Important: Always Exit the trade before any Event.
⚠️ Important: Always maintain your Risk:Reward Ratio as 1:2, with this RR, you only need a 33% win rate to Breakeven.
✅ Boost and Follow to never miss a new idea!✅
Disclaimer: I am not SEBI Registered Advisor. My posts are purely for training and educational purposes. Not a BUY or SELL recommendation.
Eat🍜 Sleep😴 TradingView📈 Repeat 🔁
Happy learning with MMT. Cheers!🥂
Highlight of the day: Silver again up by 6%Silver rose to a new high by 6% heading towards ₹ 4 lac / kg apparently.

Tech Mahindra - Weekly Long On the weekly chart of Tech Mahindra, the recent candles show strong bullish behavior. After spending many months in a wide range, price has formed a rounded base and is now printing higher highs with solid green candles near the earlier resistance zone around 1,750. The latest candle closes near the high, showing that buyers are in control and sellers are not able to push price down. This kind of structure often appears at the start of a new medium-term uptrend.
The trend is clearly shifting upward. From the April 2025 low, the stock has made a series of higher lows and is now moving in a smooth rising arc. The previous supply zone from December 2024 has been tested again and price is holding above it. This change from resistance to support is a classic sign of trend reversal. As long as price stays above the rising trend path, the bias remains positive.
RSI is above 70 and has crossed and sustained above 60, which signals strong momentum. This shows that the stock has moved from a neutral phase into a bullish phase. In trending markets, RSI can stay in the upper zone for a long time, so this strength supports continuation rather than immediate weakness.
Volumes are rising during the recent upward move. The breakout candles are accompanied by higher volume compared to the previous weeks, which confirms genuine participation. When price rises with expanding volume, it reflects accumulation by stronger hands and improves the reliability of the move.
A safer entry can be on a weekly close above 1,770–1,780, or on a pullback towards 1,680–1,700 if price respects this zone as support. This allows better risk control. The stop loss can be placed below 1,600 on a closing basis, which lies below the recent swing low and trend support. The first target comes near 1,950, which is the next major supply area. If the trend remains strong, a higher target in the 2,200–2,280 zone is possible over the medium term.
This analysis is for educational purposes only. It is not a buy or sell recommendation. Stock market investments involve risk, and prices can move unpredictably. Always do your own research and consult a qualified financial advisor before making any trading or investment decision.


XAUUSD (H2) - Liam Plan (Jan 28)XAUUSD (H2) – Liam Plan (Jan 28)
New ATH, strong safe-haven flow | Follow trend, buy FVG pullbacks only
Quick summary
Gold continues to print new all-time highs as global capital rotates into safe-haven assets amid persistent economic and geopolitical uncertainty tied to recent US policy decisions. Additional support comes from concerns around Fed independence and expectations of lower US rates, keeping real yields capped.
Despite the bullish backdrop, price is now extended above equilibrium. The edge is not in chasing strength, but in waiting for pullbacks into imbalance and liquidity zones.
➡️ Bias stays bullish, execution stays patient.
Macro context (why gold stays bid, but volatile)
Ongoing geopolitical uncertainty keeps structural demand for gold intact.
Rate-cut expectations and doubts around Fed autonomy weaken the USD’s long-term appeal.
USD is attempting a technical bounce, but this has not shifted gold’s underlying bid.
➡️ Conclusion: macro supports higher prices, but short-term moves will likely rotate to rebalance inefficiencies.
Technical view (H2 – based on the chart)
Price is trending cleanly higher after multiple bullish BOS, riding an ascending structure and expanding into premium.
Key levels from the chart:
✅ Major extension / sell-side target: 5280 – 5320 (2.618 fib expansion)
✅ FVG / continuation buy zone: 5155 – 5170
✅ Structure support: 5000 – 5050
✅ Trend invalidation (deeper): below 4950
Current price action suggests a likely path of push → pullback → continuation, rather than straight-line expansion.
Trading scenarios (Liam style: trade the level)
1️⃣ BUY scenarios (priority – trend continuation)
A. BUY the FVG pullback (cleanest setup)
✅ Buy zone: 5155 – 5170
Condition: price taps FVG and shows bullish reaction (reclaim / HL / displacement on M15–H1)
SL (guide): below 5125 or below reaction low
TP1: recent high
TP2: 5280
TP3: 5320+ if momentum expands
Logic: This FVG aligns with prior buy-side liquidity and structure — a high-probability continuation zone.
B. BUY deeper structure support (only if volatility spikes)
✅ Buy zone: 5000 – 5050
Condition: liquidity sweep + strong rejection
TP: 5170 → 5280
Logic: This is value within trend. No interest in longs above premium if this level breaks.
2️⃣ SELL scenarios (secondary – reaction only)
SELL at extension (scalp / tactical only)
✅ Sell zone: 5280 – 5320
Condition: clear rejection / failure to hold highs on lower TF
TP: 5200 → 5170
Logic: Extension zones are for profit-taking and short-term mean rotation, not trend reversal calls.
Key notes
New ATHs invite FOMO — don’t be that liquidity.
Best trades come after pullbacks, not during impulse candles.
Reduce size around Fed headlines.
What’s your plan: buying the 5155–5170 FVG pullback, or waiting for a stretch into 5280–5320 to fade the reaction?
— Liam

Gold retraces after surge – trend remains intact.Quick Context
Recent geopolitical uncertainty continues to support safe-haven flows. Gold has already delivered a strong bullish impulse, and the current move looks like a healthy correction, not a reversal.
Technical Snapshot (H1–H4)
Strong bullish impulse already completed
Current price action = controlled retracement
No bearish CHoCH, no structural breakdown
Market is resetting momentum after expansion
This is typical impulse → retrace → continuation behavior.
Key Levels to Watch
Buy Zone: 5,180 – 5,160
Invalidation: H1 close below 5,120
Upside continuation targets:
5,300
5,360
Extension toward 5,440+
If – Then Logic
If price holds above 5,160 → expect continuation higher
If price sweeps into 5,180–5,160 and reacts → buy-the-dip opportunity
Only if H1 closes below 5,120 → bullish bias weakens
Bottom Line
Gold is not reversing — it is reloading.
Pullbacks are part of trend strength.
Wait for reaction, not confirmation at the highs.

XAUUSD – M45 Tech AnalysisXAUUSD – M45 Technical Outlook: Strong Momentum, Now Watch Liquidity Reactions | Lana ✨
Gold has surged above $5,250, extending its buying position with strong momentum. Price action remains constructive, but as the market pushes deeper into premium territory, liquidity reactions become more important than raw momentum.
📈 Market Structure & Price Action
Gold continues to trade inside a well-defined ascending channel, confirming a strong bullish structure.
Multiple BOS (Break of Structure) points on the chart highlight persistent buyer control.
The recent leg higher was aggressive, indicating momentum-driven buying, but also increasing the likelihood of short-term reactions.
At current levels, the market is extended above value, which often precedes either consolidation or a controlled pullback.
🔍 Key Technical Zones on M45
Upper Supply / Reaction Zone: 5280 – 5310
This area represents a premium zone where price may face profit-taking or liquidity sweeps before choosing direction.
Immediate Support (Channel Mid / Retest Zone): 5200 – 5220
A key area where price could pull back and attempt to hold structure.
Strong Sell-Side Liquidity Zone: around 5050
Marked clearly on the chart, this is a deeper level where liquidity is resting and where stronger buyer reactions could emerge if the pullback extends.
As long as price remains inside the channel, the broader bullish bias stays intact.
🎯 Trading Scenarios
Scenario 1 – Extension With Caution:
If price continues higher into the 5280–5310 zone, expect increased volatility and potential short-term rejection. This area is better suited for risk management and observation, not aggressive chasing.
Scenario 2 – Healthy Pullback (Preferred):
A pullback toward 5200–5220 would allow price to rebalance liquidity while maintaining structure. Holding this zone supports continuation within the channel.
Scenario 3 – Deeper Liquidity Sweep:
If volatility expands, a move toward the ~5050 sell-side liquidity zone could occur before a stronger continuation leg develops.
🌍 Market Context (Brief)
Gold’s sharp move above $5,250 reflects ongoing demand for safe-haven assets amid persistent macro and geopolitical uncertainty. Strong daily gains reinforce bullish sentiment, but such vertical moves also tend to attract short-term profit-taking, making structure and liquidity levels critical.
🧠 Lana’s View
The trend is bullish, but not every bullish move is a buy.
At extended levels, Lana focuses on how price reacts at liquidity zones, not on chasing momentum.
✨ Respect the structure, stay patient near extremes, and let the market come to your levels.

Part 3 Institutional vs. TechnicalOption Trading StrategiesHere are some popular option trading strategies:
1. Long Call/Put- Long Call: Buy call option to bet on price increase.
- Long Put: Buy put option to bet on price decrease.
2. Covered Call- Sell call option on stock you own to generate income.
3. Protective Put- Buy put option on stock you own to hedge against losses.
4. Straddle- Buy call and put options at same strike price and expiry to profit from volatility.
5. Spread Strategies- Bull Call Spread: Buy call at lower strike, sell call at higher strike.
- Bear Put Spread: Buy put at higher strike, sell put at lower strike.

STARHEALTH 1 Week Time Frame 📊 Weekly Price Range (1‑Week History)
High (last week): ~₹469.8
Low (last week): ~₹442.45
(Source: Marketscreener weekly price extremes)
📌 Key Weekly Support Levels
Support zones you may watch on the weekly timeframe:
1. Support 1: ~₹440–₹442 (recent weekly low)
2. Support 2: ~₹430 area (round‑number psychological / pivot cluster)
3. Support 3: ~₹408–₹415 range (broader structural support from pivot supports seen on shorter pivots)
Weakness below ₹430 could open the lower band towards ₹405–₹410.
📌 Key Weekly Resistance Levels
Potential weekly resistance zones to monitor:
1. Resistance 1: ~₹470–₹472 (recent weekly highs & EMA cluster)
2. Resistance 2: ~₹480–₹485 (psychological and medium MA area)
3. Resistance 3: ~₹495+ (upper pivot / longer‑term range top)
A weekly close above ₹480–₹485 would indicate stronger upside pressure.
📈 Technical Indicator Context (Weekly)
RSI and weekly momentum indicators on some platforms suggest neutral‑to‑slightly bullish conditions rather than extreme overbought levels.
Weekly pivot and moving average positions (when available) confirm ₹462–₹470 as an important zone for bullish continuation.

HPCL 1 Month Time Frame 📌 Current Price Reference
HPCL’s share price is around ₹410 – ₹435 in late January 2026.
📊 1‑Month Technical Levels
🔵 Support Levels (Downside)
These are zones where the price historically finds buying interest or could rebound if selling increases:
1. Major Support: ~ ₹449–₹454 — key near‑term support zone (weekly lower support).
2. Secondary Support: ~ ₹460 — if price consolidates above this level, trend may hold.
3. Deeper Support Zone: ~ ₹454–₹449 (extended pullback).
4. Additional Lower Band: Recent pivot around ₹440–₹435 from broader charts (may act short‑term cushion).
➡️ Break below these can signal further downside to the 1‑month range.
🔴 Resistance Levels (Upside)
These are levels where price might face selling pressure or may struggle to sustain gains:
1. Immediate Resistance: ~ ₹478–₹481 — short‑term ceiling.
2. Next Key Barrier: ~ ₹484–₹486 — stronger resistance zone.
3. Stretch/Upper Target: ~ ₹490–₹494 (+) — if momentum continues bullishly.
⚖️ Pivot Reference
Pivot Level: ~ ₹449 — central point indicating bias above this tends mildly bullish, below could favor sellers.

Nifty 50 1 Week Time Frame 📊 Current Level (approx)
Nifty 50 ~ 25,200–25,350 area as of the last trading sessions (January 27–28, 2026).
📈 Key Weekly Levels to Watch
🔹 Immediate Resistance
1. ~25,300–25,350 — short‑term upside barrier (recent highs around these levels).
2. ~25,500–25,700+ — next major resistance zone (from prior weekly technical analysis, a breakout above ~26,100 historically signalled stronger bullish control).
🔻 Support Zones
1. ~24,900–25,000 — key short‑term support defended in recent sessions and noted by traders as a pivot area.
2. ~24,500–24,700 — broader weekly support zone (buffer from intermediate trend lines / moving averages).
3. ~24,200–24,300 — deeper weekly support; breach here could imply stronger correction risk.
📌 Weekly Trading Range (Probable)
Based on recent technical ranges and previous weekly outlooks:
➡️ Bullish bias above ~25,000 with resistance towards 25,500–25,700+.
➡️ Bearish/mixed bias if breaks below ~24,900, with support down to 24,500 and 24,200 zones.
⚠️ Important Notes
These levels are technical references used by traders — not investment advice.
Weekly support/resistance can shift quickly with strong market moves or macro events (especially around global policy news or earnings).
Always use stop losses and proper risk management if trading off these levels.

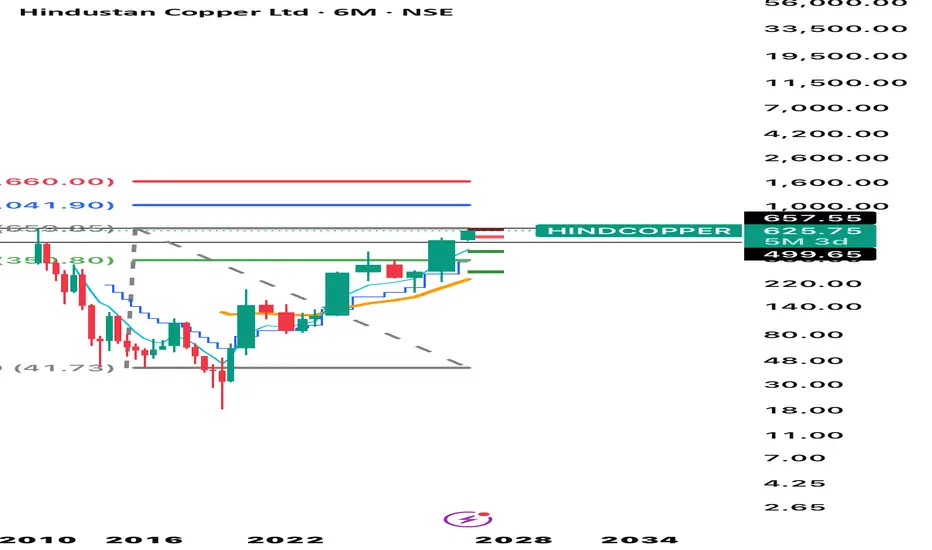
Copper Copper
ज़रूर 👍
नीचे Copper (तांबा) पर आधारित Stock Market Article हिंदी में लिख रहा हूँ — जो ट्रेडिंग, इन्वेस्टमेंट और इंडस्ट्री तीनों एंगल से काम आए।
⸻
📌 Copper (तांबा) और Stock Market: एक पूरा विश्लेषण
Copper यानी तांबा को stock market में “Dr. Copper” भी कहा जाता है, क्योंकि यह दुनिया की आर्थिक सेहत का अच्छा संकेतक माना जाता है। जब अर्थव्यवस्था बढ़ती है, तो Copper की मांग बढ़ती है, और जब मंदी आती है, तो इसकी मांग घटती है।
⸻
🔹 Copper की Demand क्यों बढ़ती है?
Copper का इस्तेमाल कई अहम सेक्टर्स में होता है:
• 🏗️ Construction & Real Estate
• ⚡ Power & Electrical Industry
• 🚗 Electric Vehicles (EV)
• 🔋 Renewable Energy (Solar, Wind)
• 📱 Electronics & Technology
EV और Green Energy Revolution के कारण आने वाले समय में Copper की demand और तेज़ होने की उम्मीद है।
⸻
🔹 Copper Price किन फैक्टर्स पर निर्भर करती है?
1. Global Economic Growth – चीन, अमेरिका और यूरोप की डिमांड
2. US Dollar Index – डॉलर कमजोर = Copper तेज
3. Supply Disruptions – Mining strikes, geopolitical issues
4. Inflation & Interest Rates
5. EV और Infrastructure Spending
⸻
🔹 India में Copper से जुड़े प्रमुख Stocks
भारतीय stock market में Copper से जुड़े कुछ अहम शेयर:
• Hindustan Copper Ltd
👉 Government-backed company, mining + refining
• Vedanta Ltd
👉 Copper + Zinc + Aluminium exposure
• Hindalco Industries
👉 Indirect benefit through metals demand
• Sterlite Technologies
👉 Copper cables & telecom infra
📌 Note: Hindustan Copper pure-play copper stock माना जाता है।
⸻
🔹 Copper: Trading vs Investment
Short-Term Traders के लिए:
• MCX Copper Futures
• Global cues + USD movement पर focus
Long-Term Investors के लिए:
• EV, Infra और Renewable Energy theme
• Copper stocks accumulation on dips
⸻
🔹 Risk Factors ⚠️
• Global recession
• China demand slowdown
• Commodity price volatility
• Government policies & environmental norms
⸻
🔹 निष्कर्ष (Conclusion)
Copper आने वाले समय में Future Metal माना जा रहा है।
जो निवेशक EV, Green Energy और Infrastructure growth पर भरोसा रखते हैं, उनके portfolio में Copper stocks एक अच्छा diversification दे सकते हैं।
📈 “जब दुनिया बनती है, तब Copper चमकता है।”
⸻
अगर चाहो तो मैं:
• इसी पर YouTube वीडियो का script
• Thumbnail text
• या Hindustan Copper का detailed stock analysis
भी बना दूँ 😊
BEMLBEML
Bullish Trend is Showing On The Chart.
Buy Signals in
Technical Indicators And
Descending Channel Pattern.
BUYING RANGE 1700/1720
