Gold now will correctGold has reached new heights and now time for small profit booking towards 4680 and then again rally will continue! Good luck !!
X-indicator

Gold (XAUUSD) Restistance @ 4710 - 4720 | Will it fall?Gold (XAUUSD) has shown a strong rally due to geopolitical situation between US and Europe but it's approaching resistance zone 4710 - 4720 and also overbought. We are looking for sell on rise opportunity as this area is strong supply zone, and fall is likely to happen.
📉 Trade Idea:
Look for sell opportunities in the 4710 – 4720 zone.
Targets and risk levels are clearly outlined on the chart.
⚠️ This is a counter-trend / pullback trade, best suited for intraday or short-term traders. Manage risk accordingly.
📌 Disclaimer:
This analysis is for educational purposes only and is not financial advice. Always manage risk and follow your trading plan.
Your feedback drives our content and keeps everyone trading smarter. Let’s make those pips together! 🚀
Happy Trading,
– The InvestPro Team

ADA/USDT Multi-Timeframe Analysis MONTHLY (1M) - Macro Trend
Status: Bearish with Recovery Attempt
Long-term trend: Downtrend established from May 2021 peak (~$3.1)
Support levels: $0.36 (current), $0.26-0.28 (historical support)
Volume profile: Declining volume suggests weakness
Outlook for Feb: Watch for stabilization or further downside to $0.26
WEEKLY (1W) - Intermediate Trend
Status: Neutral to Weak
Current price action: Trading in consolidation zone ($0.36-0.40)
Key support: $0.36 (green horizontal line visible)
Key resistance: $0.42-0.45
Volume: Contracting, suggesting indecision
Status: Bearish Bias
Current pattern: Lower highs, choppy action
Support: $0.3451, $0.33 zone
Resistance: $0.4341 (red zone resistance)
Momentum: Weak, RSI likely in lower zones
Trading range: $0.33-0.435
February 2025 Trading Scenarios
Bullish Scenario :
[Condition: Daily close above $0.40 with volume
Target: $0.50, then $0.55
Stop: Below $0.36
Probability: 35% (weak fundamentals suggest lower probability)
Bearish Scenario :
Condition: Daily close below $0.325
Target: $0.28, then $0.26
Stop: Above $0.385
Probability: 55% (trend remains down)
ADA is in a critical consolidation zone with weak momentum. The month will likely test whether this is a reversal pattern or continuation of the downtrend. Hold above $0.36 for bullish hopes; break below $0.325 confirms further downside to $0.26.
Disclaimer:
The information shared here is for educational and informational purposes only and should not be considered as financial, investment, or trading advice. Trading in stock markets, crypto, forex, or derivatives involves substantial risk, and past performance is not indicative of future results.

Global Macro Data (GDP, Inflation, RBI Policy) on Indian MarketsIndian financial markets do not operate in isolation. They are deeply interconnected with global economic conditions and influenced by both international and domestic macroeconomic data. Among the most critical factors shaping market direction are GDP growth, inflation trends, and monetary policy decisions—especially those of the Reserve Bank of India (RBI). Together, these indicators influence investor sentiment, capital flows, corporate earnings, currency movements, and overall market stability. Understanding their impact is essential for investors, traders, policymakers, and businesses.
1. Role of GDP Growth in Indian Markets
a) Domestic GDP Growth
Gross Domestic Product (GDP) is a key measure of economic health. Strong GDP growth in India signals rising consumption, increased industrial production, higher corporate profits, and improved employment levels. Equity markets typically respond positively to higher GDP growth because:
Companies experience revenue and earnings growth
Banks see improved credit demand and lower NPAs
Government tax collections improve, supporting fiscal stability
Sectors such as banking, infrastructure, FMCG, automobiles, and capital goods usually benefit during high-growth phases.
Conversely, slower GDP growth can dampen market sentiment. Weak demand, reduced corporate earnings, and cautious consumer spending may lead to market corrections or prolonged consolidation.
b) Global GDP Growth
Global GDP growth is equally important for India due to its integration with the world economy. Major economies like the US, China, and the EU significantly affect Indian markets:
Strong global growth boosts Indian exports (IT services, pharmaceuticals, engineering goods)
Weak global growth reduces export demand and affects corporate earnings
Global recessions often trigger risk-off sentiment, leading to foreign capital outflows from emerging markets like India
For example, a slowdown in the US or Europe can negatively impact Indian IT stocks, while a slowdown in China may affect metal and commodity-linked companies.
2. Impact of Inflation on Indian Markets
Inflation measures the rise in prices and directly affects purchasing power, interest rates, and profitability. Both domestic inflation and global inflation trends play a vital role.
a) Domestic Inflation (CPI & WPI)
In India, the RBI closely monitors Consumer Price Index (CPI) inflation. High inflation impacts markets in several ways:
Reduces consumer spending power
Increases input costs for companies
Forces RBI to adopt a hawkish stance (rate hikes)
High inflation is generally negative for equity markets, especially for interest-sensitive sectors like banking, real estate, automobiles, and NBFCs. It also affects bond markets, as rising inflation leads to higher yields and falling bond prices.
Moderate and stable inflation, on the other hand, is considered healthy. It indicates steady demand without overheating the economy, supporting long-term market growth.
b) Global Inflation
Global inflation, especially in developed economies, influences Indian markets indirectly:
High global inflation often leads to tighter monetary policies by central banks like the US Federal Reserve
This can strengthen the US dollar and cause capital outflows from emerging markets
Imported inflation rises for India due to higher commodity prices (crude oil, metals, fertilizers)
India is a major importer of crude oil, so global inflation driven by rising energy prices directly impacts India’s trade deficit, fiscal balance, and corporate margins.
3. RBI Monetary Policy and Its Market Impact
The Reserve Bank of India plays a central role in shaping financial market conditions through its monetary policy framework. RBI decisions on interest rates, liquidity, and regulatory measures significantly influence equity, bond, currency, and derivative markets.
a) Interest Rate Policy (Repo Rate)
The repo rate is the primary tool used by the RBI to control inflation and stimulate or cool economic activity.
Rate Cuts:
Reduce borrowing costs
Encourage consumption and investment
Positive for equity markets and rate-sensitive sectors
Rate Hikes:
Increase loan EMIs and borrowing costs
Slow down consumption and capex
Generally negative for equities but supportive for the currency
Banking and financial stocks are particularly sensitive to RBI rate decisions. While moderate rate hikes can improve bank margins, aggressive hikes may reduce credit growth.
b) Liquidity Management
RBI uses tools such as CRR, SLR, open market operations (OMOs), and variable rate repos to manage liquidity.
Excess liquidity supports equity markets and risk assets
Tight liquidity leads to higher interest rates and market volatility
During periods of global uncertainty, RBI liquidity measures often act as a stabilizing force for Indian markets.
c) Policy Communication and Guidance
RBI’s forward guidance influences market expectations. Clear and consistent communication reduces uncertainty and volatility. Sudden changes in stance, however, can cause sharp market reactions.
4. Interaction Between Global Macro Data and RBI Policy
Indian markets often react not just to RBI policy but to how it aligns with global central banks.
If the US Fed tightens aggressively while RBI remains accommodative, capital outflows may increase
If RBI hikes rates ahead of global peers, it can support the rupee but slow domestic growth
Policy divergence affects currency stability, bond yields, and equity valuations
RBI must balance growth, inflation, and financial stability, especially in a globalized environment where shocks transmit quickly.
5. Impact on Key Asset Classes
a) Equity Markets
Positive GDP growth + stable inflation + accommodative RBI policy = bullish equity markets
High inflation + aggressive rate hikes = bearish or volatile markets
Sector rotation is common depending on macro conditions.
b) Bond Markets
Inflation and RBI rate decisions directly affect bond yields
Rising inflation → higher yields → falling bond prices
Stable inflation → attractive long-term bond investments
c) Currency (INR)
Strong GDP growth and stable inflation support the rupee
High inflation, trade deficits, and global risk-off sentiment weaken the rupee
RBI intervention plays a key role in managing excessive volatility
d) Commodity and Derivatives Markets
Global macro data heavily influences commodity prices, which in turn affect Indian commodity-linked stocks and futures markets.
6. Role of Foreign Institutional Investors (FIIs)
Global macro indicators strongly influence FII behavior:
Strong global growth + risk appetite → FII inflows
High global inflation + rising US yields → FII outflows
FII flows significantly impact Indian indices like Nifty 50 and Sensex, often amplifying market trends.
Conclusion
The impact of global macro data—GDP growth, inflation, and RBI policy—on Indian markets is profound and multidimensional. GDP growth drives corporate earnings and long-term market trends, inflation influences purchasing power and interest rates, and RBI policy acts as a stabilizing or tightening force depending on economic conditions. In a globalized world, international macro developments often shape domestic outcomes through trade, capital flows, currency movements, and investor sentiment.
For market participants, understanding these macro linkages is crucial. Long-term investors use macro indicators to identify economic cycles, while traders track data releases for short-term opportunities. Ultimately, sustainable growth in Indian markets depends on a delicate balance between robust GDP expansion, controlled inflation, and prudent, forward-looking monetary policy by the RBI.

HINDUNILVRHINDUNILVR
bullish trend is Showing on the chart.
buy signals in
technical indicators and
Ascending Channel chart pattern.
BUYING RANGE 2400/2410
Watch for a retest 2400/2410 to sustain the bullish trend. If the resistance holds, there could be a retest towards 2200/2210 and an uptrend from here.

India–US Trade Deal: Implications on MarketsIntroduction
India and the United States share one of the most strategically important economic relationships in the world. As the largest democracy and the largest economy respectively, both nations have steadily expanded trade, investment, and technology cooperation over the past two decades. A potential or evolving India–US trade deal—whether in the form of sector-specific agreements, tariff reductions, or broader strategic trade frameworks—has significant implications for equity markets, currency markets, bond yields, and sectoral performance in both countries. For investors, traders, and policymakers, understanding these implications is crucial.
1. Background of India–US Trade Relations
India and the US are major trading partners. Bilateral trade in goods and services has crossed USD 190 billion in recent years and continues to grow. The US is among India’s largest export destinations, while India is a key sourcing and services hub for American companies.
Key areas of engagement include:
Information Technology and digital services
Pharmaceuticals and healthcare
Defense and aerospace
Energy (LNG, renewables)
Semiconductors and high-tech manufacturing
A trade deal aims to reduce trade barriers, enhance market access, and improve supply-chain resilience, particularly amid global geopolitical realignments.
2. Equity Market Implications in India
a) Positive Sentiment and Valuation Re-rating
A favorable India–US trade deal is typically viewed as market-positive for Indian equities. Improved access to the US market boosts export-driven revenues, strengthens corporate earnings visibility, and often leads to valuation re-rating, especially in globally linked sectors.
Foreign institutional investors (FIIs) tend to respond positively to trade certainty, which can lead to:
Increased capital inflows
Higher liquidity in large-cap stocks
Reduced risk premium for Indian assets
b) Sectoral Winners in Indian Markets
1. Information Technology (IT):
Indian IT companies are direct beneficiaries. A stable trade framework reduces visa uncertainties, supports outsourcing demand, and enhances long-term contracts with US clients. Large-cap IT stocks often outperform during such developments.
2. Pharmaceuticals:
India is a global supplier of generic medicines to the US. Regulatory alignment, faster approvals, and lower trade frictions improve margins and volume growth for pharma exporters.
3. Manufacturing and PLI-linked Sectors:
Trade cooperation aligned with “China+1” strategies supports Indian manufacturing in electronics, auto components, and specialty chemicals. This benefits mid-cap and small-cap manufacturing stocks.
4. Defense and Aerospace:
Joint production and technology transfer agreements encourage capital expenditure and long-term order books for Indian defense companies.
c) Short-Term Volatility Risks
Markets may experience short-term volatility during negotiations due to:
Tariff disputes
Agricultural and dairy market disagreements
Intellectual property concerns
However, long-term investors generally view such volatility as a buy-on-dips opportunity.
3. Impact on US Equity Markets
For US markets, an India–US trade deal offers:
Access to one of the world’s fastest-growing consumer markets
Cost-efficient supply chains
Expanded services exports
US multinational companies in technology, defense, energy, and consumer goods benefit from higher revenue diversification. However, the impact on US indices is more diffused compared to India, given the larger size of the US economy.
4. Currency Market Implications (INR–USD)
a) Strengthening of Indian Rupee (INR)
Improved trade flows and foreign investment inflows can support the Indian rupee in the medium term. Key drivers include:
Higher dollar inflows from exports
Increased FDI and portfolio investments
Improved current account outlook
A stable or moderately stronger INR reduces imported inflation and supports macroeconomic stability.
b) RBI Intervention and Stability
Despite positive trade developments, the Reserve Bank of India (RBI) may intervene to prevent excessive currency appreciation to protect export competitiveness. As a result, currency movements are likely to remain orderly rather than sharply directional.
5. Bond Market and Interest Rate Implications
a) Lower Risk Premium
Trade certainty with the US improves India’s sovereign risk perception, which can:
Lower government bond yields
Attract long-term foreign bond investors
Support India’s inclusion in global bond indices
b) Impact on Corporate Bonds
Export-oriented companies with dollar revenues benefit from better cash-flow predictability, improving their credit profiles. This can narrow credit spreads and encourage corporate borrowing for expansion.
6. Foreign Direct Investment (FDI) and Capital Flows
An India–US trade deal signals policy stability, a key requirement for long-term FDI. Areas likely to see increased investment include:
Semiconductor fabrication
Renewable energy
Electric vehicles
Digital infrastructure
Higher FDI strengthens India’s capital formation cycle, supporting GDP growth and corporate earnings over multiple years.
7. Strategic and Geopolitical Market Implications
a) Supply Chain Realignment
Global investors increasingly favor countries aligned with US trade and security frameworks. India’s strategic positioning as a democratic alternative manufacturing hub enhances its attractiveness in global portfolios.
b) Reduced Dependence on Single Markets
A stronger India–US trade relationship reduces overdependence on any single geography, improving economic resilience and lowering systemic risk for markets.
8. Challenges and Risks to Watch
Despite positive implications, certain challenges remain:
Protectionist pressures in both countries
Agricultural market access disputes
Labor and environmental compliance costs
US domestic political cycles affecting trade policy
Markets may react negatively if negotiations stall or if protectionist rhetoric resurfaces.
9. Long-Term Market Outlook
From a long-term perspective, the India–US trade deal supports:
Sustained earnings growth for export-oriented sectors
Improved macroeconomic stability
Higher global integration of Indian capital markets
For equity investors, this reinforces the structural India growth story, while for traders it creates sector-specific opportunities aligned with policy developments.
Conclusion
The India–US trade deal represents more than a bilateral economic arrangement—it is a strategic market catalyst. Its implications span equities, currencies, bonds, and capital flows, with India emerging as a major beneficiary due to its growth potential and export competitiveness. While short-term market volatility may arise from negotiation dynamics, the long-term impact remains constructively bullish for Indian markets. For investors, aligning portfolios with sectors and companies positioned to benefit from enhanced India–US trade cooperation can offer meaningful returns in the years ahead.

Looks bullishThis is a Symmetrical Triangle (Compression Pattern) on BEML – Weekly chart.
Lower trendline: Rising (higher lows)
Upper trendline: Falling (lower highs)
Price: Getting squeezed toward the apex
Timeframe: Weekly → high significance

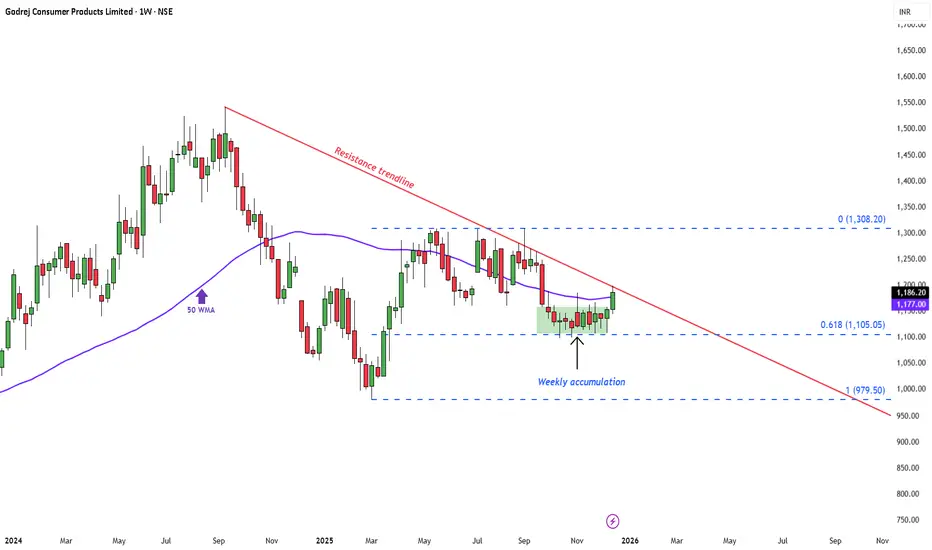
Godrej Consumer Products: Weekly Accumulation Showing StrengthAfter weeks of quiet accumulation near the 0.618 retracement (~₹1,105) , the stock has now delivered a weekly close above the 50-week moving average — a constructive sign of improving sentiment.
The move also puts price right at the descending resistance trendline , where follow-through buying will determine if this recovery extends further.
The structure continues to look steadily constructive , with early signs of buyers regaining control.
As long as the stock holds above the recent base, the bias leans cautiously bullish .
Disclaimer: This analysis is for educational purposes only and does not constitute investment advice. Please do your own research (DYOR) before making any trading decisions.
NIFTY KEY LEVELS FOR 20.01.2026NIFTY KEY LEVELS FOR 20.01.2026
Timeframe: 3 Minutes
Sorry for the Delayed post..
If the candle stays above the pivot point, it is considered a bullish bias; if it remains below, it indicates a bearish bias. Price may reverse near Resistance 1 or Support 1. If it moves further, the next potential reversal zone is near Resistance 2 or Support 2. If these levels are also broken, we can expect the trend.
When a support or resistance level is broken, it often reverses its role; a broken resistance becomes the new support, and a broken support becomes the new resistance.
If the range(R2-S2) is narrow, the market may become volatile or trend strongly. If the range is wide, the market is more likely to remain sideways
please like and share my idea if you find it helpful
📢 Disclaimer
I am not a SEBI-registered financial adviser.
The information, views, and ideas shared here are purely for educational and informational purposes only. They are not intended as investment advice or a recommendation to buy, sell, or hold any financial instruments.
Please consult with your SEBI-registered financial advisor before making any trading or investment decisions.
Trading and investing in the stock market involves risk, and you should do your own research and analysis. You are solely responsible for any decisions made based on this research.

Understanding Trend Breakouts, RSI Signals and Risk Management📈 Understanding Trend Breakouts, RSI Signals, and Risk Management in Trading : Base Chart UNION BANK OF INDIA
Union Bank of India’s stock currently presents a compelling opportunity as it has successfully broken out of its long-term downtrend and is sustaining above the trendline, signaling a confirmed reversal in sentiment. The price action is now forming higher highs and higher lows, a classic bullish structure that often precedes further upward momentum. With the RSI holding above 50 and now approaching the 70 zone, momentum indicators are aligning with price strength, suggesting strong buying interest. For investors and traders, this setup highlights a favorable risk-reward scenario, where disciplined risk management—such as using stop-losses and position sizing—can help capitalize on the breakout while safeguarding against volatility.
Lets elobrate the study....
🔹 The Significance of Long-Term Downtrends
Definition: A long-term downtrend occurs when a stock consistently makes lower highs and lower lows over an extended period.
Investor Psychology: It reflects persistent bearish sentiment, where sellers dominate buyers.
Why It Matters: Recognizing a downtrend helps traders avoid premature entries and understand the broader market context.
✅ Breakout Above the Downtrend Line
Trendline Break: When a stock sustains above its long-term downtrend line, it signals a potential trend reversal.
Confirmation: Sustained price action above the line, supported by volume, indicates that buyers are gaining control.
Implication: This often marks the beginning of a new bullish phase, where higher highs and higher lows start forming.
🔹 RSI (Relative Strength Index) as a Momentum Indicator
RSI Basics: RSI measures momentum on a scale of 0–100.
Below 30 → Oversold (potential reversal upward).
Above 70 → Overbought (potential reversal downward).
Importance of RSI Above 50:
RSI consistently above 50 suggests bullish momentum.
It indicates that average gains outweigh average losses.
RSI Moving Toward 70:
Crossing into the 70+ zone reflects strong buying strength.
While it can signal overbought conditions, in trending markets it often supports continued bullishness.
🔹 Risk Management Principles
Even with strong technical signals, risk management is essential:
Position Sizing: Never allocate more capital than you can afford to lose.
Stop-Loss Orders: Protect against sudden reversals by setting predefined exit points.
Diversification: Avoid concentrating all investments in one stock or sector.
Avoid Emotional Trading: Stick to your plan; don’t chase prices or panic sell.
🔹 Key Takeaways for Investors & Traders
Trend Reversal: Sustained breakout above a long-term downtrend line is a powerful bullish signal.
Momentum Confirmation: RSI above 50, moving toward 70, strengthens confidence in the trend.
Breakout Opportunities: Higher highs and higher lows formation confirms the stock’s bullish structure.
Risk Discipline: Technical signals are valuable, but risk management ensures long-term survival in markets.
Balanced Approach: Combine technical analysis with sound trading psychology and portfolio management.
📌 Final Thought: Technical indicators like trendlines and RSI provide valuable insights, but they are not foolproof. The most successful traders blend technical signals with disciplined risk management, ensuring they ride profitable trends while protecting themselves from unexpected market shifts.

Bank of IndiaI have analysed the Bank of India and it seems like in a bullish trend. We can enter into the trade in the demand zone where there will be a pull back

BTC 4H Update🚨 BTC Update: After peaking at $99.7k, BTC dumped to $91.8k on trade war fears from Trump's tariffs—$790M liquidated! Stabilizing ~$92.7k (-2.3% 24h).
Supports: $91.8k, then $90k-$92k. Resist: $93.9k-$94.5k—break for bounce to $95k+.
Healthy reset? Buy dip if holds. What's your take? #BTC #Crypto

#NIFTY Intraday Support and Resistance Levels - 20/01/2026A flat opening is expected in Nifty, indicating continued consolidation after the recent corrective move. The index is currently trading below the previous resistance zone, suggesting that the overall bias remains cautious in the near term. Early price action is likely to remain range-bound, with volatility expected around the marked support and resistance levels. Traders should be patient during the opening minutes and wait for price confirmation near key levels before initiating positions.
On the upside, the immediate resistance zone is placed around 25,750–25,800. A sustained move and acceptance above 25,750 can trigger a reversal long setup, indicating that buyers are regaining control. If this breakout holds, Nifty may gradually move towards 25,850, followed by 25,900 and 25,950+, where fresh supply and profit booking can be expected. Long trades should only be considered if the index shows strong price acceptance above this zone with supportive volume.
On the downside, the 25,700–25,650 region remains a crucial intraday support. Any rejection from the resistance zone or failure to hold above 25,700 can lead to a reversal short setup. In such a scenario, downside targets are seen at 25,650, 25,550, and 25,500, which are important demand areas. A decisive breakdown below 25,450 will further weaken the structure and can open the gates for deeper downside towards 25,350, 25,300, and 25,250, where buyers may attempt a defensive bounce.
Overall, the market structure suggests a sell-on-rise or range-trading environment unless a strong breakout above resistance occurs. Traders should focus on level-based trading with strict stop-loss discipline and avoid overtrading during sideways moves. Scalping and short-term trades near support and resistance will be more effective than positional trades until Nifty shows a clear directional breakout.

Is BearFlag CompletedCurrent Outlook on BTC Chart Pattern.
BearFlag Rising Wage
In this case btc is supposed to create a Rising wage on Macro, only Valid if BTC, 94k, and then pumped to 99k, breaking down below 94k Invalidates in Technical term, but you never know what can happen here
50/50
BearFlag Rising Triangle Pattern
In this macro case, BTC has already completed 70% of the Pattern, and the Move to 75k can start to happen any moment. Breakdown of the channel, and then retest, right now looks like BTC is just holding at the ascending channel, which is crucial to hold if another test of 99k is supposed to happen.
50/50
FareValue Gap
FareValue Gap from 97k to 100k is Stil Empty on Macro, which needs to be retested before the next big move.
Looks like there is only 10% probablity of this happening.
Comment on what you think might happen,
1. Will the breakdown happen from here?
2. Will the Farevalue Gap between 97k - 100k will be filled before any major move.

[INTRADAY] #BANKNIFTY PE & CE Levels(20/01/2026)A flat opening is expected in Bank Nifty, indicating indecision after the recent volatile moves. The index is opening near the 59,800–59,900 zone, which continues to act as a short-term balance area where buyers and sellers are actively competing. This suggests that the market is still in a consolidation phase and is waiting for a clear trigger to decide the next directional move. Early price action is likely to remain choppy, with whipsaws possible near key intraday levels.
On the upside, the crucial level to watch remains 60,050–60,100. A sustained move and acceptance above this zone will indicate renewed buying strength. If Bank Nifty manages to hold above 60,050, bullish momentum can gradually build, opening the path for CE buying opportunities. In such a scenario, upside targets are placed at 60,250, followed by 60,350, and 60,450+, where strong supply zones are expected. A breakout above these levels may also invite short covering, accelerating the move higher.
On the downside, the 59,950–59,900 area is acting as immediate intraday support. Any rejection or failure to sustain above this zone may increase selling pressure. A breakdown below 59,900 can trigger PE buying, with downside targets at 59,750, 59,650, and 59,550. If weakness extends further and the index slips below 59,450, it would confirm bearish dominance, opening deeper downside levels toward 59,250, 59,150, and 59,050.
Overall, the structure suggests a range-bound and level-based trading session unless a decisive breakout or breakdown occurs. Traders should avoid aggressive early entries and focus on confirmation-based trades near the mentioned levels. Scalping and short-term positional trades with strict stop-loss and disciplined risk management will be more effective than directional bets until the market clearly breaks out of this consolidation range.

GOLD TRADING STRATEGY FOR 20TH JANUARY 2026🟡 GOLD (XAUUSD) TRADING PLAN 🟡
💰 Intraday / Positional Setup
📈 BUY SETUP (Bullish Momentum) 🟢
🕰️ Timeframe: 30-Minute Candle
✅ Buy Condition:
Enter BUY 🟢 only if price breaks and CLOSES ABOVE the HIGH of the 30-minute candle
Confirmation level: Above 4710 🔔
💵 BUY ABOVE: $4710
🎯 TARGETS:
🎯 Target 1: $4725
🎯 Target 2: $4735
🎯 Target 3: $4745
📊 Logic:
Strong bullish candle close above resistance
Indicates fresh buying interest and continuation momentum
Suitable for trend-following traders
📉 SELL SETUP (Bearish Breakdown) 🔴
🕰️ Timeframe: 1-Hour Candle
❌ Sell Condition:
Enter SELL 🔴 only if price breaks and CLOSES BELOW the LOW of the 1-hour candle
Confirmation level: Below 4643 ⚠️
💵 SELL BELOW: $4643
🎯 TARGETS:
🎯 Target 1: $4630
🎯 Target 2: $4618
🎯 Target 3: $4603
📊 Logic:
Hourly candle close below support
Shows weakness and bearish continuation
Best for breakdown & momentum sellers
⚠️ RISK MANAGEMENT
🛑 Always wait for candle CLOSE confirmation
📉 Use strict stop-loss based on your risk appetite
💼 Trade with proper position sizing
📌 DISCLAIMER ⚠️
🚫 This is NOT financial advice
📚 Shared for educational purposes only
📊 Trading involves high risk, and losses may exceed profits
💰 Please consult your financial advisor before trading
🙌 Trade at your own risk and responsibility
✨ Discipline beats emotion in trading 💵📈

Beta DrugsDate 20.01.2026
Beta Drugs
Timeframe : Weekly Chart
About
(1) It is engaged in manufacturing of a wide range of oncology drugs in India.
(2) It has operations in the domestic and export markets.
(3) The company is ranked among the top 10 oncology companies.
(4) Has CDMO partnerships with few top pharma cos like Glenmark, Torrent Pharma, Reliance Lifesciences, Cadila Pharmaceuticals among others.
Business Segments
(1) CDMO 48%
(2) Domestic Own Brand Business 29%
(3) International Business 16%
(4) Active Pharmaceutical Ingredients 7%
Note* CDMO (Contract Development and Manufacturing Organization)
Manufacturing Facilities
(1) The company operates 2 formulations & 1 API manufacturing facility in India
(2) About 70% of API requirements are manufactured in-house
Valuations
(1) Market Cap ₹ 1,564 Cr
(2) Stock Pe 34.6
(3) Roce 27%
(4) Roe 25.9%
(5) Book Value 7X
(6) Opm 20%
(7) Promoter 64.90%
(8) Profit Growth (TTM) 10%
(9) Sales Growth 15.20% (YOY)
(10) EV/Ebita 18.09
(11) PEG 1.53
Note*
(1) Delivered good profit growth of 37.1% CAGR over last 5 years
(2) Return on equity (ROE) track record: 3 Years ROE 26.6%
Regards,
Ankur SIngh

“Liquidity Grab → Pivot Support Holds → Next Bullish Leg Loading🔍 Market Structure & Key Observations
Overall market structure remains bullish with clear higher highs & higher lows ✔️
Price is respecting the upward trendline, confirming ongoing bullish momentum 📈
The recent sharp drop was a liquidity sweep into the Pivot Point / Demand zone, followed by a strong bullish reaction → Smart Money accumulation 💼💰
Multiple POI (Point of Interest) reactions below show buyers are active on dips
Current consolidation above the Pivot Point zone suggests preparation for the next impulsive move up, not distribution
🎯 Suitable Target Zones (High Probability)
🎯 Primary Target (TP1)
➤ 4,615 – 4,625 🎯
Prior resistance / range high
Liquidity resting above recent consolidation highs
Most realistic short-term objective
🚀 Extended Target (TP2)
➤ 4,650 – 4,670 🚀💸
Measured move from the last bullish impulse
Upper expansion of the ascending structure
Valid if bullish momentum accelerates
📌 Optional BUY Trade Idea (Trend-Following)
🟢 Buy Zone (on pullback):
➤ 4,560 – 4,580
(confluence of Pivot Point + trendline support)
❌ Stop-Loss (invalidation):
➤ Below 4,540
🎯 Take Profit:
TP1: 4,620 🎯
TP2: 4,660 🚀
📊 Risk–Reward: approx. 1:2.5 – 1:3+
🧭 Market Outlook Summary
Factor Bias
Trend Bullish 📈
Momentum Buyers in control 💪
Structure Continuation pattern ✅
Liquidity Upside targets active 💧

$ONDO ALTSEASON SETUP | 5,000%+ EXPANSION IF MACRO DEMAND HOLDSONDO is currently trading at a major weekly demand zone after an ~85% drawdown from ATH. While price action remains weak, on-chain data suggests silent accumulation, indicating potential smart money positioning ahead of the next cycle.
Market Structure (Weekly)
Bearish divergence confirmed at $2.14, marking the macro top
Breakdown + retest of the $0.73–$0.80 support zone → now acting as resistance
Price has entered a high-timeframe demand zone between $0.30–$0.20
A final retracement into bullish order flow ($0.32–$0.20) remains possible
Bullish bias remains valid above $0.20 (weekly close)
On-Chain Context (Jan 18, 2026 – 1.94B ONDO Unlock):
Whale spot orders dominating market activity
$0.35–$0.40 acting as an accumulation range
90D CVD trending higher → buy pressure outweighs sell pressure
Taker-buy dominance → aggressive smart money absorption
This behavior suggests unlock supply is being absorbed, not distributed.
Upside Projections (HTF Expansion)
Targets: $0.70 → $1.00 → $2.00 → $5.00–$10.00
Structure supports a potential RWA-led expansion into 2026 if demand holds
Key Level to Watch
Invalidation: Weekly close below $0.20
This $0.32–$0.20 zone may be the final bullish base for ONDO ahead of the next alt-season cycle
TA Only. Not Financial Advice. DYOR.

Mirrored Repetition of Structure Possible?In the world of trading, "mirrored repetition of structure" is a core concept used by technical analysts to find order in the chaotic movement of prices. It is based on the idea that market psychology is cyclical—fear and greed repeat in predictable geometric shapes.Depending on how you view the market, this mirroring can be categorized into three main types:1. Mirror Levels (Support & Resistance Flip)This is the most common form of "mirrored structure." A price level that once acted as a ceiling (Resistance) is broken and then becomes the new floor (Support).The Logic: When price returns to a previous peak from above, traders who "missed out" on the original move now see it as a bargain, mirroring the previous rejection behavior but in the opposite direction.The Pattern: Often visualized as a "Break and Retest."2. Geometric Symmetry (Harmonic & Chart Patterns)Traders look for "Symmetrical Repetition" where the second half of a pattern mirrors the first.Double Tops/Bottoms: An "M" or "W" shape where the second peak/trough mirrors the first, indicating a structural rejection.ABCD Patterns: The market moves in a specific leg ($A$ to $B$), retraces ($B$ to $C$), and then repeats the first move almost exactly ($C$ to $D$). This is a literal repetition of structural distance and time.Symmetrical Triangles: Price is squeezed between two mirroring trend lines, indicating a "coil" where buyers and sellers are reaching a point of perfect, repeated equilibrium before a breakout.3. Fractal Structure (Self-Similarity)This is the most advanced form of mirrored repetition. In Fractal Theory (popularized by Benoit Mandelbrot), the structure of the market is mirrored across different timeframes.The Concept: A 5-minute chart might show a specific zigzag pattern that is a miniature version of a pattern currently forming on the Daily chart.Mirroring Scales: The "structure" repeats itself, meaning the way the market moves over 1 hour is often a mirrored or scaled-down version of how it moves over 1 year.

BANK NIFTY - Technical Analysis Bank Nifty is showing an interesting setup on the weekly chart.
After breaking out above its previous all-time high, the index has started contracting in a tight range, indicating healthy consolidation.
On the daily timeframe, it continues to take support near the 9 EMA, and during minor dips, it has also reversed from the 20 EMA, reflecting strong buying interest.
If Bank Nifty breaks out of this range with momentum, the upside potential remains open, sky’s the limit.
In case of a pullback, watch these key support zones:
🟩 57,500 – first immediate support
🟩 57,160 – secondary support
🟩 56,600 – third support
🟩 56,000 – major support zone if deeper retracement occurs
Overall market structure is Bullish, and a bit more consolidation or a short pullback will only strengthen the base for a sustained breakout.
✅ If you like my analysis, please follow me here as a token of appreciation :)
in.tradingview.com/u/SatpalS/
📌 For learning and educational purposes only, not a recommendation. Please consult your financial advisor before investing.

HEGHEG - The structure remains bullish.
The stock recently broke above a year-long resistance around 617 and then pulled back for a healthy retest. It found support near the 550 zone and around the 50 EMA, followed by a clear reversal.
Price has also respected the 0.618 Fibonacci (golden ratio) level, which adds strength to the setup. A breakout from the current range could lead to a fresh upside move.
Keep it on your watchlist.
✅ If you like my analysis, please follow me here as a token of appreciation :)
in.tradingview.com/u/SatpalS/
📌 For learning and educational purposes only, not a recommendation. Please consult your financial advisor before investing.

XAUUSD (Gold) 45-Minute Chart – Bullish Trend Holding with MomenTrend & Structure:
Gold remains above the ascending trendline, confirming a valid short-term bullish trend. The recent candles show sideways consolidation after a strong impulsive rise, which typically favors continuation as long as support holds.
Price Action:
The market is forming higher lows while compressing below recent highs. This price behavior suggests indecision, not rejection—buyers are still defending dips.
RSI (14):
RSI is around 57–58, holding above the 50 level. This indicates bullish momentum, though momentum has stabilized rather than accelerated, consistent with consolidation.
Awesome Oscillator (AO):
AO bars remain above zero but decreasing, signaling that bullish momentum is cooling, not reversing. A fresh green expansion would confirm continuation.
MACD:
MACD histogram is slightly negative and contracting, while lines are flattening. This supports a pause within trend, not a confirmed bearish crossover.
Key Levels:
Immediate Support: Rising trendline / recent higher-low zone
Resistance: Consolidation highs near the recent swing top
Trend Failure: Strong close below the trendline
