CADJPY 4HR T/F ANALYSIS----
cadjpy 4hr t/f analysis---- in arc internal breakout of penant supply now current supply can measure from previous supply after supply complete then we can see demand from reversal portion after a confirmation like bullish candle then we can go with demand which are heighlited demand let`s see--- remember trend are bullish so after supply complete then we can plane a exicution--
X-indicator

Volume trading strategy for intraday - paid videoVolume trading strategy - paid video
how to trade volume on intraday

BUY TODAY SELL TOMORROW for 5%DON’T HAVE TIME TO MANAGE YOUR TRADES?
- Take BTST trades at 3:25 pm every day
- Try to exit by taking 4-7% profit of each trade
- SL can also be maintained as closing below the low of the breakout candle
Now, why do I prefer BTST over swing trades? The primary reason is that I have observed that 90% of the stocks give most of the movement in just 1-2 days and the rest of the time they either consolidate or fall
Resistance Breakout in XPROINDIA
BUY TODAY SELL TOMORROW for 5%

BUY TODAY SELL TOMORROW for 5%DON’T HAVE TIME TO MANAGE YOUR TRADES?
- Take BTST trades at 3:25 pm every day
- Try to exit by taking 4-7% profit of each trade
- SL can also be maintained as closing below the low of the breakout candle
Now, why do I prefer BTST over swing trades? The primary reason is that I have observed that 90% of the stocks give most of the movement in just 1-2 days and the rest of the time they either consolidate or fall
Resistance Breakout in MRPL
BUY TODAY SELL TOMORROW for 5%

Part 2 Ride The Big Moves Option Trading Psychology
Avoid emotions
Don’t overtrade
Keep strict stop-loss
Avoid averaging when wrong
Follow market structure
Learn volume profile & volatility patterns
Success in options comes from discipline, not luck.

INDUSINDBK | Weekly Bullish Options Setup | 27 Jan ExpiryTrade Structure (Text Format)
• Sell 960 PE
• Buy 940 PE
• Defined-risk Bull Put Spread
NSE:INDUSINDBK
Why this setup works
INDUSINDBK is holding above the short-term support zone around 950 after a strong bounce. Price is trading above key moving averages, momentum is improving, and RSI is comfortably above the mid-zone.
Put-side OI is building near 950–960, suggesting strong downside support. With IV elevated, selling puts via a spread offers attractive risk-reward with defined downside.
View
Moderately bullish — expecting INDUSINDBK to stay above 950 and trend sideways to higher over the week.
This post is for education only. It’s not financial advice or a recommendation to trade.
#WeeklyOptions #BullishSetup #BullPutSpread #INDUSINDBK #BankNiftyStocks #NSEOptions #OptionsTradingIndia #PriceAction

CIPLA | Weekly Bearish Options Setup | 27 Jan ExpiryTrade Structure (Text Format)
• Sell 1400 CE
• Buy 1420 CE
• Defined-risk Bear Call Spread
NSE:CIPLA
Why this setup works
CIPLA is trading below the short-term trend with price failing to sustain above the 1400 zone. The recent bounce has been sold into, RSI remains weak below the mid-line, and momentum continues to fade.
Call-side OI is building around the 1400 strike, indicating strong overhead supply. With IV holding steady, call spreads offer a favourable risk-defined way to express a bearish-to-neutral view.
View
Moderately bearish — expecting CIPLA to stay below 1400 and drift sideways to lower over the week.
This post is for education only. It’s not financial advice or a recommendation to trade.
#WeeklyOptions #BearishSetup #BearCallSpread #CIPLA #NSEOptions #OptionsTradingIndia #PriceAction #StockMarketIndia #RMInvestech

Part 1 Technical Analysis vs. Institutional Option Trading Call Options (CE) – Explained
A Call Option gives the buyer the right to buy the underlying asset at the strike price.
Why Buy a Call Option?
You buy a call when you expect the price to rise.
Example:
NIFTY is at 22,000
You buy NIFTY 22,000 CE @ ₹100
If NIFTY goes to 22,400 at expiry:
Intrinsic value = 22,400 – 22,000 = 400
Profit = 400 – 100 = ₹300 x lot size
If NIFTY stays below 22,000:
Your call expires worthless
Loss = Premium = ₹100
Why Sell a Call Option?
You sell a call when you expect the price to stay below strike.
Call Seller View:
Market will fall OR stay sideways
Premium will decrease (time decay)

BNBUSDT.P – 1D | High RR Trend-Continuation SetupBNB is forming a higher-low structure after a prolonged correction and is now reacting from a key demand / flip zone aligned with the ascending trendline. Price acceptance above this level can lead to a strong upside expansion.
🔹 Market: BNBUSDT Perpetual (Bitget)
🔹 Timeframe: 1 Day
🔹 Bias: Bullish continuation
🔹 Entry Zone: Demand / Structure support
🔹 Stop Loss: Below invalidation level
🔹 Targets:
TP1: Previous supply / range high
TP2: Major resistance zone
TP3: Higher-timeframe liquidity area
📌 Confluence Factors:
Higher-low market structure
Trendline support
Previous resistance turned support
Clean risk-to-reward profile
📈 As long as price respects the marked demand zone and holds the trendline, upside continuation remains favorable.
⚠️ A daily close below support invalidates the setup.
💡 Trade with strict risk management. This chart reflects technical analysis, not financial advice.

Gold Analysis & Trading Strategy | January 16✅ 4-Hour Chart (H4) Trend Analysis
From the 4-hour perspective, gold failed to sustain its bullish momentum after testing the 4640–4650 resistance zone, with 4642.85 forming a clear short-term top. Following this rejection, price entered a high-level consolidation phase, fluctuating within the 4620–4580 range, indicating that bullish momentum has significantly weakened. The market has transitioned from a strong impulsive uptrend into a corrective structure, with price gradually losing upside strength. Short-term moving averages (MA5 and MA10) have flattened and started to turn lower, while MA20 has also lost its upward slope, showing that the previous bullish structure is no longer dominant. At the same time, the Bollinger upper band has flattened and turned downward, and price has fallen below the middle band, confirming that the overall market structure has shifted from a trending environment into a corrective and consolidation phase. This suggests that gold has entered a post-rally adjustment stage, with downside risks gradually increasing.
✅ 1-Hour Chart (H1) Trend Analysis
On the 1-hour chart, a clear topping structure has already been completed. After forming a double top around the 4640–4650 area, price broke below the key support at 4595–4600, confirming the completion of the top pattern. Subsequent rebound attempts have been repeatedly capped in the 4615–4620 resistance zone, forming a textbook pullback rejection area. The Bollinger middle band has turned into resistance, and price continues to oscillate within a weak downward consolidation range, indicating that bearish momentum remains intact and that the market is vulnerable to further downside once key support levels are tested.
🔴 Resistance Zones
• 4620–4625
• 4640–4650
🟢 Support Zones
• 4590–4580
• 4570–4555
• 4535–4520
✅ Trading Strategy Reference
🔰 1. Short from High Levels
📍 Open light short positions in the 4615–4625 zone
🎯 Targets: 4595 / 4585 / 4570 / 4555
🔰 2. Buy on Pullbacks
📍 Open light long positions in the 4555–4570 zone
🎯 Targets: 4585 / 4600 / 4615
✅ Trading Reminder
👉 The current structure represents a post-rally high-level correction with bears gradually gaining control
👉 All rebounds should be treated primarily as selling opportunities
👉 Strictly control position size and avoid heavy exposure in range-bound conditions
👉 A smoother trend is more likely to emerge only after a key support break or confirmation

Buy idea MTAR TechAfter a consolidation of almost 4.5 year, the stock is trying to give range breakout in monthly chart. RSI in D+W+M is above 60 which is good and showing momentum and supertrend is also bullish. If we try to find the target on monthly chart taking range calculation method, the target goes to near 5000 from this level which is almost double but the same is not going to come in 1-2 months. One have to wait for atleast 1-2 year.

XAUUSD – Bearish pressure, monitor breakdown zone (H1)Market Context (H1)
Gold is trading inside a descending structure, with price repeatedly rejected from the upper supply zones. The recent recovery attempts remain corrective and lack follow-through, suggesting sellers are still in control in the short term.
From a fundamental angle, markets are cautious ahead of upcoming U.S. data, keeping gold vulnerable to downside moves while risk appetite remains unstable. This environment favors sell-on-rallies until structure shifts.
Structure & Price Action
H1 structure is bearish / corrective, with lower highs intact.
Price continues to respect the descending trendline and supply layers above.
The zone around 4,581 is a key breakdown level — loss of this area could accelerate selling pressure.
Trading Plan – MMF Style
Primary Scenario – SELL Continuation
Preferred SELL zones:
4,607 – 4,618
4,634 area (strong supply cap)
Look for bearish reactions or rejection signals at these zones. Avoid chasing mid-range moves.
Downside Targets
TP1: 4,581
TP2: 4,557
Extension: deeper liquidity if momentum expands
Alternative Scenario
If price fails to break below 4,581 and reclaims 4,618 with strong H1 close, pause SELL bias and wait for structure confirmation.
Invalidation
H1 close above 4,634 → bearish scenario invalid, reassess market structure.
Summary
Bias remains bearish while below supply. The optimal strategy is patience — sell at premium zones or wait for a confirmed breakdown to follow momentum.

RSI Oversold Zone in a Downtrend – Case of Dixon Technologies📘 RSI Oversold Zone in a Downtrend – Case of Dixon Technologies
🔍 Introduction
Dixon Technologies is currently trading around ₹10,933.00 on its hourly chart. The stock has entered the RSI oversold zone, which often signals a pause in aggressive selling. While many traders mistakenly interpret oversold conditions as an immediate buy signal, in a downtrend, oversold RSI typically suggests a temporary bounce—from a lower low to a lower high—before the prevailing trend resumes.
📊 What is RSI and the Oversold Zone?
Relative Strength Index (RSI):
A momentum oscillator that measures the speed and magnitude of price movements.
Values range between 0 and 100.
Oversold Zone:
RSI below 30 is generally considered oversold.
It indicates that selling pressure has been strong and may be due for a pause.
📉 RSI Oversold in a Downtrend
Not a Buy Signal:
In an uptrend, oversold RSI can hint at a bullish reversal.
In a downtrend, however, oversold RSI usually signals only a short-term bounce.
Bounce to Lower High:
The stock may recover temporarily from a lower low to a lower high.
This bounce provides sellers with a “comfortable zone” to re-enter positions.
Trend Continuation:
Unless there is evidence of a complete reversal (higher highs and higher lows), the downtrend remains intact.
⚖️ Pause in Aggressive Selling
Why Selling Pauses:
Oversold RSI reflects exhaustion of immediate selling pressure.
Market participants often wait for prices to retrace before resuming selling.
Bounce Dynamics:
The bounce is typically weaker than prior rallies.
It serves as a reset, allowing the trend to continue with renewed momentum.
🎯 Practical Takeaways for Traders & Investors
Do Not Confuse Oversold with Reversal:
Oversold RSI in a downtrend is a pause, not a trend change.
Expect Lower Highs:
The bounce usually leads to a lower high, not a breakout.
Wait for Evidence of Reversal:
A true reversal requires higher highs and higher lows, supported by volume and momentum.
Risk Management:
Traders should avoid aggressive buying in oversold conditions during a downtrend.
Investors should wait for structural changes in trend before considering long positions.
📝 Final Thoughts
For Dixon Technologies at ₹10,933, the RSI oversold condition suggests a short-term bounce rather than an immediate bullish reversal. The downtrend remains intact until clear evidence of reversal emerges. Traders should treat oversold RSI as a signal of pause in selling pressure, not as a standalone buy trigger.

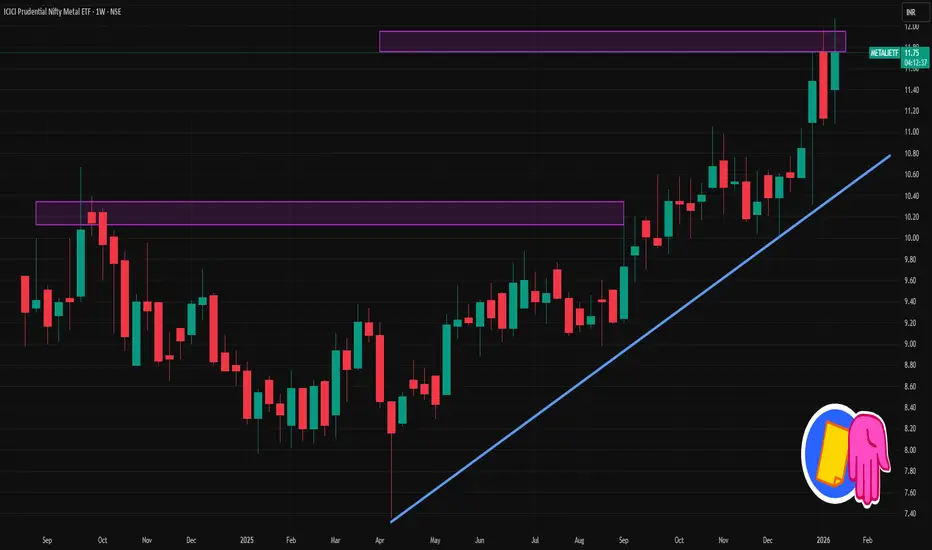
METALIETF 1 Week Time Frame 📊 Current Context (Latest Price)
• The ETF is trading around ₹11.6–₹11.8 (mid‑Jan 2026 data).
📈 Weekly Technical Levels (Pivot‑Based Support / Resistance)
From the weekly pivot point analysis:
Weekly Pivot Point (Center): ~ ₹11.38
This is a key level — above it suggests bullish bias on weekly charts.
Weekly Resistance Levels:
R1: ~ ₹11.71 — first upside target/resistance
R2: ~ ₹12.28 — secondary resistance zone
R3: ~ ₹12.61 — further supply zone if momentum continues
Weekly Support Levels:
S1: ~ ₹11.05 — initial support on pullbacks
S2: ~ ₹10.81 — next support below
S3: ~ ₹10.48 — deeper weekly support
Central Pivot Range (CPR):
Top CPR ~ 11.51
Bottom CPR ~ 11.26
This band often acts as a weekly equilibrium zone — trading above it keeps bulls in control.
📌 Summary – Weekly Key Levels
Level Type Price (₹)
Weekly Resistance 3 (R3) ~11.52
Weekly Resistance 2 (R2) ~11.28
Weekly Resistance 1 (R1) ~11.06
Weekly Pivot ~10.82
Weekly Support 1 (S1) ~10.60
Weekly Support 2 (S2) ~10.36
Weekly Support 3 (S3) ~10.14
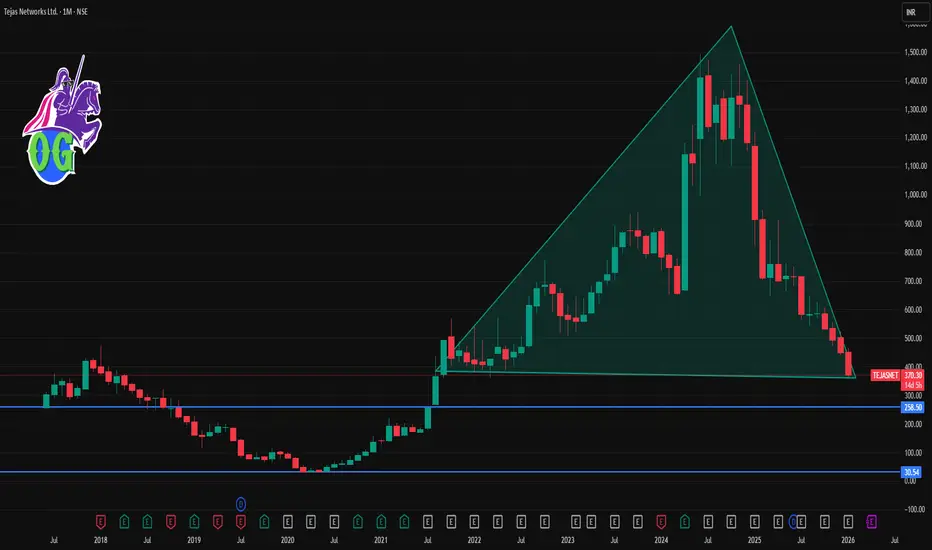
TEJASNET 1 Month Time Frame 📊 Current Price Context (as of mid‑January 2026)
Tejas Networks is trading around ₹370‑₹375 on NSE/BSE.
The stock recently hit a 52‑week low near ₹364 after weak quarterly earnings and sales decline.
📉 Short‑Term Technical Levels (1‑Month View)
🔻 Immediate Support Zones
These are levels where the stock could find buyers or stall further declines:
₹366‑₹370 — current short‑term support (intraday pivot & recent low).
₹362‑₹366 — lower pivot/secondary intraday support.
~₹356‑₹362 — deeper support if momentum remains weak.
📈 Resistance Levels (Upside Hurdles)
For any bounce or recovery attempt:
₹377‑₹380 — near current pivot/resistance range.
~₹390‑₹395 — next resistance zone (prior price congestion).
₹405‑₹410+ — stronger resistance (short‑term target for recovery).
🧠 Trading/Price Action Tips (1‑month)
Bullish Scenario (countertrend bounce):
A break above ₹380‑₹390 with good volume could shift short‑term sentiment and target ₹405‑₹410+.
Bearish/Continued downtrend:
If support at ₹366‑₹370 breaks convincingly, the next zone near ₹362 then ₹356–₹360 becomes focus.
Geopolitical Tensions Keep Gold Bid Macro & Fundamental Context
Escalating geopolitical risks, ongoing regional conflicts, and rising political uncertainty continue to drive risk-off sentiment across global markets.
In this environment:
The USD shows mixed reactions as demand for safety competes with expectations of policy flexibility.
Gold remains structurally supported as capital rotates into safe-haven assets amid uncertainty.
As long as global tensions remain unresolved, downside moves in Gold are likely to be corrective rather than trend-breaking.
Technical Structure (H1)
Gold remains in a bullish market structure, confirmed by multiple BOS (Break of Structure).
The current pullback is unfolding into stacked Fair Value Gaps (FVG) — a typical rebalancing phase in an uptrend.
No confirmed bearish structure break at this stage.
Key Price Zones
Intraday Resistance: 4,581
Upper FVG: 4,569.369
Mid FVG: 4,545.716 – 4,535.432
Deep FVG / Structure Support: 4,512.551
Scenarios (If – Then)
Scenario 1 – Bullish Rebalance
If price holds above 4,535.432 – 4,512.551, expect buyers to step in.
A recovery above 4,581 would reopen the path toward 4,620+.
Scenario 2 – Deeper Liquidity Sweep
A deeper pullback into 4,512.551 is still acceptable within the bullish structure.
Only a clear H1 close below 4,512.551 would weaken the bullish bias.
Summary
Gold is reacting to global uncertainty, not just technicals.
As long as geopolitical risks persist, buy-the-dip remains the dominant mindset.
Risk-off flows favor Gold.
Structure defines the bias.

INDIANB 1 Day View 📌 Indian Bank – Daily Levels (Current / Accurate)Price Reference (Recent): ~₹832–₹835 area (last updated Jan 9-Jan 12, 2026)
🔹 Daily Pivot Point
Pivot: ~₹839.3 – ₹825.6 (multiple pivot sources)
📈 Resistance Levels
R1: ~₹850.6 – ₹838 area
R2: ~₹868.3
R3: ~₹879.6
(These are the daily upside barriers where selling pressure may emerge)
📉 Support Levels
S1: ~₹821.6 – ₹814 area
S2: ~₹810.3
S3: ~₹792.6 – ₹777 area
(These are key downside floors where buyers often step in)
🧠 How To Use These Levels (Daily Trading)
Bullish view (if price holds above pivot ~₹825–839 area):
✔ Above S1 (~₹821–822) — short-term bullish continuation likely
✔ Break above R1 (~₹850) — targets R2 (~₹868) then R3 (~₹880)
Bearish view (if price breaks below daily pivot / S1):
❌ Below S1 (~₹821) — weakness could push price toward S2 (~₹810)
❌ Sustained below S3 (~₹792–₹777) — could signal deeper correction
⚠️ Quick Reminder
These technical levels are based on latest publicly available pivot analysis and may differ slightly from live real-time data on your trading platform. Always verify live quotes on your charting tool before entering trades.

Technical Analysis and Chart PatternsUnderstanding Technical Analysis
At its foundation, technical analysis relies on three key assumptions. First, the market discounts everything, meaning price reflects all known information. Second, prices move in trends—once a trend starts, it is more likely to continue than reverse immediately. Third, history tends to repeat itself, as market participants often react similarly to comparable situations due to human psychology such as fear, greed, and herd behavior.
Technical analysis uses tools like price charts, indicators, and oscillators to identify trends, momentum, volatility, and potential reversal points. Charts visually represent price movements over time, making them the backbone of technical analysis. Common chart types include line charts, bar charts, and candlestick charts, with candlesticks being the most popular due to their detailed representation of price action.
Role of Charts in Technical Analysis
Charts help traders understand how price behaves over different time frames. Short-term traders may focus on minute or hourly charts, while swing traders prefer daily charts, and long-term investors may analyze weekly or monthly charts. Regardless of the time frame, the principles of technical analysis remain the same.
Key elements observed on charts include support and resistance levels, trendlines, moving averages, and volume patterns. Support represents a price level where demand is strong enough to prevent further decline, while resistance is where selling pressure prevents further price increases. These levels often act as decision points for traders.
What Are Chart Patterns?
Chart patterns are specific formations created by price movements on a chart. They represent the collective psychology of market participants and often signal continuation or reversal of trends. Chart patterns do not guarantee outcomes, but they increase the probability of a particular move when combined with other technical tools.
Chart patterns are broadly classified into three categories:
Reversal Patterns
Continuation Patterns
Bilateral Patterns
Understanding these patterns allows traders to anticipate potential breakouts, breakdowns, or trend changes.
Reversal Chart Patterns
Reversal patterns indicate a possible change in the prevailing trend. They form after a sustained upward or downward move and suggest that momentum is weakening.
One of the most well-known reversal patterns is the Head and Shoulders pattern. It consists of three peaks: a higher middle peak (the head) flanked by two lower peaks (the shoulders). When price breaks below the neckline, it signals a potential reversal from an uptrend to a downtrend. The inverse head and shoulders pattern works similarly but indicates a reversal from a downtrend to an uptrend.
Another important reversal pattern is the Double Top and Double Bottom. A double top forms when price tests a resistance level twice and fails to break higher, signaling bearish reversal. A double bottom forms when price tests a support level twice and fails to break lower, signaling bullish reversal. These patterns reflect exhaustion of buyers or sellers at critical levels.
Continuation Chart Patterns
Continuation patterns suggest a temporary pause in the market before the prevailing trend resumes. They often occur during periods of consolidation, where the market gathers strength for the next move.
Flags and Pennants are common continuation patterns. Flags appear as small rectangular consolidations sloping against the prevailing trend, while pennants resemble small symmetrical triangles. Both patterns indicate strong momentum prior to consolidation and usually resolve in the direction of the original trend.
Triangles are another popular continuation pattern, including ascending, descending, and symmetrical triangles. An ascending triangle forms with a flat resistance line and rising support, signaling bullish continuation. A descending triangle has flat support and falling resistance, signaling bearish continuation. Symmetrical triangles show contracting price action and can break in either direction, often continuing the previous trend.
Bilateral Chart Patterns
Bilateral patterns indicate uncertainty in the market and can break in either direction. Traders usually wait for confirmation before taking a position.
The Symmetrical Triangle is a prime example of a bilateral pattern. It reflects a balance between buyers and sellers, with lower highs and higher lows converging toward an apex. A breakout above resistance suggests bullish continuation, while a breakdown below support suggests bearish continuation.
Importance of Volume in Chart Patterns
Volume plays a crucial role in validating chart patterns. A breakout or breakdown accompanied by high volume is considered more reliable than one with low volume. Volume confirms the strength of market participation behind a move. For example, in a head and shoulders pattern, increasing volume on the breakdown of the neckline strengthens the bearish signal.
Combining Chart Patterns with Indicators
While chart patterns are powerful, relying on them alone can be risky. Successful traders often combine chart patterns with technical indicators such as Relative Strength Index (RSI), Moving Average Convergence Divergence (MACD), and moving averages. These indicators help confirm momentum, trend strength, and overbought or oversold conditions.
For instance, a bullish breakout from a triangle pattern combined with RSI moving above 50 and price crossing above a moving average provides stronger confirmation. This multi-tool approach reduces false signals and improves decision-making.
Limitations of Technical Analysis and Chart Patterns
Despite their usefulness, technical analysis and chart patterns have limitations. Markets can behave unpredictably due to sudden news, economic events, or geopolitical factors. False breakouts are common, especially in low-volume or highly volatile markets. Additionally, chart patterns are subjective—different traders may interpret the same pattern differently.
Discipline, risk management, and proper position sizing are essential to handle these limitations. Stop-loss orders help protect capital when a pattern fails.
Conclusion
Technical analysis and chart patterns form the backbone of modern trading strategies. By studying price behavior, identifying recurring patterns, and understanding market psychology, traders can gain valuable insights into potential future movements. Chart patterns such as head and shoulders, double tops and bottoms, flags, and triangles help traders anticipate reversals and continuations with higher probability.
However, technical analysis is not a magic formula. Its true power lies in consistent practice, combining multiple tools, and disciplined risk management. When used correctly, technical analysis and chart patterns become a powerful framework for navigating financial markets and making informed, strategic trading decisions.

Unlock Trading SecretsUnderstanding Market Behavior
The first trading secret lies in understanding that markets move based on a combination of demand and supply, driven by human behavior. Prices do not move randomly; they react to information such as economic data, corporate earnings, geopolitical events, interest rate changes, and market sentiment. Traders who learn to read these influences gain an advantage. Technical analysis helps decode price action through charts, trends, support and resistance levels, and indicators. Fundamental analysis focuses on the intrinsic value of assets by studying financial statements, macroeconomic factors, and industry trends. Successful traders often combine both approaches instead of relying on only one.
The Power of Discipline and Consistency
One of the most overlooked trading secrets is discipline. Many traders fail not because their strategy is poor, but because they cannot follow it consistently. Discipline means sticking to predefined rules for entry, exit, position sizing, and risk management—regardless of emotions or market noise. Consistency in execution allows traders to measure performance accurately and improve over time. Without discipline, even the best strategy becomes ineffective.
Risk Management: The Core Secret
Risk management is the foundation of long-term trading success. Professional traders focus more on controlling losses than maximizing profits. A common rule is to never risk more than a small percentage of trading capital on a single trade. This ensures survival during losing streaks, which are inevitable in trading. Using stop-loss orders, maintaining a favorable risk-to-reward ratio, and avoiding overleveraging are critical practices. The secret here is simple but powerful: protect your capital first, and profits will follow.
Psychology and Emotional Control
Trading psychology is often described as the true battlefield. Fear, greed, hope, and revenge trading can sabotage even the most skilled traders. Fear may cause early exits, while greed may lead to overtrading or holding positions too long. Emotional control is developed through self-awareness, experience, and structured routines. Keeping a trading journal, reviewing mistakes, and accepting losses as part of the process help build mental resilience. Traders who master their emotions gain a significant edge over those who react impulsively.
Developing a Trading Strategy
Another key trading secret is having a clear, well-tested strategy. A strategy defines what to trade, when to trade, and how to trade. It may be based on trends, breakouts, reversals, momentum, or events such as earnings and economic announcements. The important factor is not the complexity of the strategy, but its clarity and repeatability. Backtesting strategies on historical data and forward-testing them in live or simulated markets builds confidence and reliability.
Timeframe and Trading Style Alignment
Not all trading styles suit every individual. Some traders thrive in fast-paced intraday trading, while others prefer swing trading or long-term investing. Understanding your personality, time availability, and risk tolerance is a crucial secret. A strategy that works well for one trader may fail for another simply due to differences in patience or decision-making speed. Aligning your trading style with your lifestyle increases the chances of consistency and long-term success.
Learning from Losses and Mistakes
Losses are unavoidable in trading, but they are also valuable teachers. The secret is not avoiding losses entirely, but learning from them. Each losing trade offers insight into strategy flaws, emotional mistakes, or market conditions. Traders who analyze losses objectively and make adjustments continuously improve. Those who ignore or emotionally react to losses often repeat the same mistakes.
The Role of Market Cycles
Markets move in cycles—bull markets, bear markets, and sideways phases. Recognizing the current phase is a powerful trading secret. Strategies that work well in trending markets may fail in range-bound conditions. Adapting to market cycles instead of forcing trades improves performance. Flexibility and awareness allow traders to shift strategies or reduce activity when conditions are unfavorable.
Patience and Long-Term Vision
Many beginners seek quick profits, but patience is a hidden trading secret. Sustainable success comes from compounding small, consistent gains over time. Professional traders think in terms of months and years, not days. They focus on process over outcome, knowing that results will naturally follow disciplined execution. Patience helps traders wait for high-probability setups instead of chasing every market move.
Continuous Learning and Adaptation
Markets evolve with technology, regulations, and global events. A trader who stops learning eventually falls behind. Continuous education—through books, courses, market analysis, and self-review—is essential. Staying adaptable and open to improvement is a major secret behind longevity in trading.
Conclusion
Unlocking trading secrets is not about finding a hidden indicator or insider tip. It is about mastering the fundamentals: understanding market behavior, managing risk, controlling emotions, following a disciplined strategy, and committing to continuous learning. Trading rewards those who respect the process and remain patient through challenges. When approached with the right mindset and structure, trading becomes less of a gamble and more of a professional skill—one that can deliver consistent results over the long term.

Defining Option Chain TermsUnderlying Asset
The underlying asset is the financial instrument on which the option contract is based. It can be an equity share, stock index, commodity, currency, or exchange-traded fund (ETF). For example, in the NIFTY option chain, the underlying asset is the NIFTY 50 index. The price movement of the underlying asset directly influences the value of option contracts.
Strike Price
The strike price (or exercise price) is the predetermined price at which the option holder has the right to buy or sell the underlying asset. In a call option, it is the price at which the buyer can purchase the asset, while in a put option, it is the price at which the buyer can sell the asset. Option chains list multiple strike prices above and below the current market price, helping traders choose contracts based on their market outlook.
Expiry Date
The expiry date is the date on which the option contract ceases to exist. After this date, the option becomes invalid. Options can have weekly, monthly, or long-term expiries depending on the market. As expiry approaches, the time value of options decreases rapidly, a phenomenon known as time decay.
Call Option
A call option gives the buyer the right, but not the obligation, to buy the underlying asset at the strike price on or before the expiry date. Call options are generally purchased when traders expect the price of the underlying asset to rise. In the option chain, call options are typically displayed on the left side.
Put Option
A put option gives the buyer the right, but not the obligation, to sell the underlying asset at the strike price on or before expiry. Traders buy put options when they expect the price of the underlying asset to fall. Put options are usually displayed on the right side of the option chain.
Last Traded Price (LTP)
The last traded price is the most recent price at which a particular option contract was traded. It reflects the current market value of the option and is crucial for understanding real-time demand and supply.
Bid Price and Ask Price
The bid price is the highest price a buyer is willing to pay for an option contract, while the ask price is the lowest price a seller is willing to accept. The difference between these two prices is known as the bid-ask spread. A narrow spread indicates high liquidity, whereas a wide spread may signal low trading interest or higher risk.
Open Interest (OI)
Open interest represents the total number of outstanding option contracts that have not been settled or closed. It is one of the most closely watched indicators in an option chain. Rising open interest indicates the creation of new positions, while falling open interest suggests position unwinding. Traders often analyze open interest in combination with price movement to gauge market sentiment.
Change in Open Interest
Change in open interest shows the increase or decrease in the number of open contracts compared to the previous trading session. A sharp increase may indicate fresh buying or selling, while a decline suggests profit booking or exit from positions. It is widely used to identify support and resistance levels.
Volume
Volume refers to the total number of option contracts traded during a specific period, usually a trading day. High volume suggests strong market participation and interest in that particular strike price. Volume helps confirm price trends and breakout signals.
Implied Volatility (IV)
Implied volatility measures the market’s expectation of future price fluctuations in the underlying asset. Higher IV indicates expectations of significant price movement, often around events like earnings announcements or policy decisions. Lower IV suggests stable price expectations. IV plays a critical role in option pricing and strategy selection.
Intrinsic Value
Intrinsic value is the actual value of an option if it were exercised immediately. For a call option, it is the difference between the underlying price and the strike price, provided the underlying price is higher. For a put option, it is the difference when the strike price is higher than the underlying price. If an option has no intrinsic value, it is considered out-of-the-money.
Time Value
Time value is the portion of the option’s premium that exceeds its intrinsic value. It reflects the probability that the option may become profitable before expiry. Time value decreases as the option approaches expiry, a process known as theta decay.
In-the-Money (ITM), At-the-Money (ATM), and Out-of-the-Money (OTM)
An option is in-the-money when it has intrinsic value. It is at-the-money when the strike price is close to the current market price of the underlying asset. It is out-of-the-money when it has no intrinsic value. These classifications help traders choose options based on risk and reward preferences.
Option Premium
The option premium is the price paid by the buyer to the seller (writer) of the option. It consists of intrinsic value and time value. The premium is influenced by factors such as underlying price, volatility, time to expiry, and interest rates.
Greeks
Option Greeks measure how the price of an option responds to different factors. Delta shows sensitivity to price changes in the underlying asset, theta measures time decay, gamma measures delta changes, vega measures sensitivity to volatility, and rho measures sensitivity to interest rate changes. While not always directly visible in a basic option chain, Greeks are essential for advanced analysis.
Conclusion
Understanding option chain terms is fundamental to successful options trading. Each term—from strike price and expiry to open interest and implied volatility—provides valuable insights into market behavior and trader positioning. A well-analyzed option chain can reveal support and resistance levels, predict volatility, and help in selecting appropriate trading strategies. For anyone looking to participate in derivatives markets, mastering option chain terminology is not just beneficial but essential for informed and disciplined decision-making.

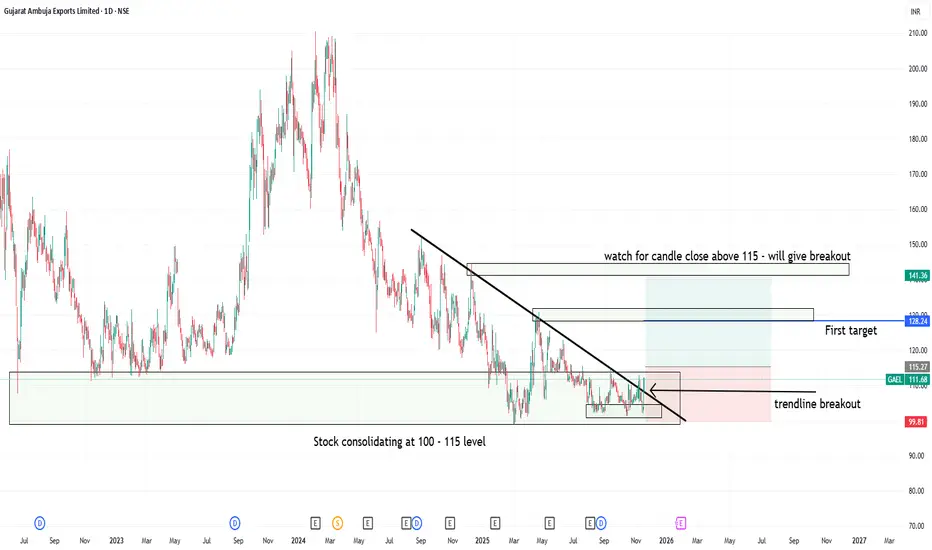
Trendline breakout at support level in GAEL1. Gujrat ambuja export lt- showing consolidation at 100 to 115 levels
2. Candle close above 115 can trigger consolidation breakout at strong support zone
3. Trendline breakout has already happend but above 115 close will be safe and logical
4. Good Risk:Reward one can watch for upside movement with strict sl level
Buying idea in PNBPNB is going to break almost Oct 2010 trendline in Monthly chart which is almost 16 years. RSI on D+W+M is above 60 which indicating that the momentum is also in favour. Moreover the PSU bank sector is also very strong. If we see the chart from 2017 to till date, it is like a cup and handle pattern. The stock has crossed its 200 DMA on monthly chart and sustained above it.

Understanding the Cup & Handle Pattern in 360 One Wam Limited🔍 Introduction
360 One Wam Limited is currently trading around ₹1230.00 on its weekly chart. The stock has recently completed the edge of a Cup & Handle pattern, a classic bullish continuation formation. Traders and investors often view this as a powerful signal of potential upside momentum once the neckline is crossed. Let’s break down what this pattern means, why it matters on a weekly chart, and how to approach it with proper risk management.
☕ What is the Cup & Handle Pattern?
Cup Formation:
The “cup” resembles a rounded bottom, showing a period of consolidation after a prior uptrend.
It reflects a gradual shift from selling pressure to accumulation.
Handle Formation:
The “handle” is a smaller consolidation or pullback that occurs after the cup.
It typically slopes downward slightly, shaking out weak hands before the breakout.
Neckline Breakout:
The neckline is the resistance level formed at the top of the cup.
A breakout above this neckline signals renewed bullish strength and often leads to a strong upward move.
📊 Importance of the Weekly Chart
Long-Term Reliability: Patterns on weekly charts carry more weight than daily charts because they represent broader investor sentiment.
Reduced Noise: Weekly candles filter out short-term volatility, making the breakout more meaningful.
Institutional Interest: Larger players often act on weekly chart signals, adding credibility to the move.
🎯 Proper Entry Strategy
Entry Point:
The ideal entry is on a confirmed breakout above the neckline with strong volume.
Traders should wait for a weekly close above the neckline to avoid false breakouts.
Confirmation Tools:
Volume expansion during breakout.
Momentum indicators (RSI crossing above 60, MACD bullish crossover).
⚖️ Risk Management Criteria
Stop Loss Placement:
Place stop loss just below the handle’s low or slightly under the neckline after breakout.
This limits downside risk if the breakout fails.
Position Sizing:
Risk only a small percentage of capital (1–2%) per trade.
Adjust position size based on volatility and stop-loss distance.
Target Projection:
Measure the depth of the cup and project it upward from the neckline to estimate potential upside.
Example: If the cup depth is ₹200, breakout target could be ₹1410 (₹1210 + ₹200).
📌 Key Takeaways for Traders & Investors
The Cup & Handle is a bullish continuation pattern, signaling strength after consolidation.
Weekly chart patterns are more reliable than daily ones, reducing noise and false signals.
Entry should be on neckline breakout with volume confirmation.
Risk management is critical: use stop losses and proper position sizing.
Potential upside can be projected by measuring the cup’s depth, but patience is key—weekly breakouts take time to unfold.
📝 Final Thoughts
For 360 One Wam Limited, the completion of the Cup & Handle pattern around ₹1210 sets the stage for a potential bullish rally once the neckline is crossed. Traders should remain disciplined, waiting for confirmation and managing risk carefully. Investors can view this as a sign of long-term strength, but must align entries with their risk tolerance and investment horizon.
