Long Term Investment What is Bank Nifty (for long-term view)
Nifty Bank tracks India’s top banking stocks (HDFC Bank, ICICI Bank, SBI, Axis, etc.).
It’s:
🚀 High growth–oriented
📉 More volatile than Nifty 50
💰 Strongly linked to credit growth, interest rates, and the economy
Long-term verdict:
Great for growth if you can tolerate volatility.
Best ways to invest in Bank Nifty for the long term
1️⃣ Bank Nifty Index Mutual Funds (BEST for most people)
Passive funds that track Bank Nifty
Ideal for SIP + long horizon (7–10+ years)
Why this works
No stock picking risk
Lower expense ratio
Automatic rebalancing
👉 Suitable if you want set it and forget it
X-indicator

Reliance Industries: Still in a B-Wave Trap Below 1,420Price appears to have completed a short-term 5-wave advance, following which the structure has shifted into a corrective phase.
The ongoing move is best read as an (a)(b)(c) zigzag, where wave (b) is still unfolding inside a clear supply zone. The overlapping and choppy price action supports the view that this is not a trend reversal.
As long as price stays below 1,419.5, the expectation remains for a 5-wave decline in wave (c), targeting the 0.618–0.786 retracement zone (around 1,390–1,383).
Only after this corrective leg completes does the setup open the door for a higher-degree recovery. Until then, any rise should be treated as corrective.
Disclaimer:
This analysis is for educational purposes only and does not constitute investment advice. Please do your own research (DYOR) before making any trading decisions.

Wave 5 Long-Term Target: Fibonacci Projection Indicates 28,867Wave 5 Long-Term Target: Fibonacci Projection Indicates 28,867
Wave 1: 15,214 to 18,893
Wave 3: 16,833 to 26,290
Wave 4 Complete: 22,022 (Correction Phase Ended)
Calculation:
Wave 1-3 Range: 26,290 - 15,214 = 11,076
61.8% of Wave 1-3: 11,076 × 0.618 = 6,844.97
Wave 5 Target: 22,022 + 6,844.97 = 28,867
Conclusion:
Wave 4 has completed, confirming a long-term bullish outlook. If Wave 5 follows the 61.8% Fibonacci extension rule, its estimated target is 28,867. This projection helps us to set long-term price targets and confirmations. You can view my previous analysis of wave 4 published on 20 FEB.

Elliott Wave Analysis: Nifty’s Final Corrective Leg UnfoldingOn October 31, I predicted that Nifty would enter a bearish phase based on my Elliott Wave Zigzag analysis. So far, the market has followed this pattern.
Currently, Nifty is in the final leg of its corrective phase. After reaching the 22,500–22,300 range, I expect it to complete its 5th corrective wave. The structure has played out in three key phases:
First Zigzag Pattern: Waves (i), (ii), (iii), (iv), (v)
ABC Correction Phase: A, B, C
Final Zigzag Pattern: Waves (i), (ii), (iii), (iv), (v)
As per my analysis, Wave (V) is close to completion, but some time correction is still pending, while the price movement has mostly aligned with expectations. Keep an eye on market signals for confirmation!

SUPREMEIND – STWP Equity Snapshot 📊 SUPREMEIND – Technical & Educational Snapshot
Ticker: NSE: SUPREMEIND
Sector: 🧪 Chemicals / Plastics
CMP: 3,500.80 ▲ (+4.15% | 22 Jan 2026)
Learning Rating: ⭐⭐⭐⭐☆ (Neutral–Range with Recovery Bias)
Chart Pattern Observed: 📊 Range Structure with Recovery from Demand
Candlestick Pattern Observed: Bullish Engulfing
📊 Technical Snapshot
SUPREMEIND is attempting a short-term stabilisation after a sharp corrective phase, with the latest daily candle showing a strong bullish response from lower demand zones. RSI is placed near 52.5, indicating neutral momentum with early signs of internal strength but no overbought pressure yet. Stochastic is around the mid-zone, suggesting recovery from oversold conditions rather than trend exhaustion. Bollinger Bands remain wide, reflecting elevated volatility and a market still adjusting after the decline, while price continues to trade below major supply zones — keeping the broader structure range-bound with recovery bias. MACD remains subdued, highlighting that momentum improvement is still developing rather than fully established. Price is currently interacting near the CPR band, which is relatively wide, typically associated with range-bound or two-sided price action. As long as price remains within or below the CPR zone, upside moves may face supply pressure, while sustained acceptance above the CPR pivot would be required to signal any meaningful directional shift.
📊 Volume Analysis
🔹 Current Volume: ~536K
🔹 Average Volume (20-period): ~252K ✅
💥 Volume is running at more than 2× the recent average, confirming active participation during the rebound from demand.
💡 Interpretation: Higher-than-average volume near support zones suggests genuine buying interest and supply absorption. However, for any sustained move toward upper range resistance, similar volume expansion will be required near higher levels to confirm acceptance.
🔑 Key Levels – Daily Timeframe
Support Areas: 3373 | 3258 | 3194
Resistance Areas: 3552 | 3616 | 3731
These are zones where price has paused or reacted earlier.
What’s Catching Our Eye: Sharp demand-led rebound with strong participation.
What to Watch For: Acceptance above CPR and nearby resistance.
Failure Zone: Loss of the recent demand base.
Risks to Watch: Overhead supply and wide CPR.
What to Expect Next: Range-bound move with recovery bias.
Bullish Case: Sustained Demand absorption may support recovery.
Bearish Case: Failure to hold Demand base risks deeper reversion.
Momentum Case: Strong Rebound momentum, needs follow-through.
STWP Equity Snapshot – SUPREMEIND
Intraday Setup:
Entry: 3,500.8
Invalidation level: 3,237.11
Reference 1: 3,817.23
Reference 2: 4,028.18
Swing Setup (Hybrid Model – 2–5 days):
Entry: 3,500.8
Invalidation level: 3,151.67
Reference 1: 4,199.06
Reference 2: 4,722.75
STWP View: Momentum: Strong | Trend: Range | Risk: High |Volume: High
Learning Note: Focus on structure, risk per trade and clean reviews – not prediction.
Disclaimer:
Educational view only. Not a Buy/Sell recommendation. Please consult a SEBI-registered advisor before making any decision. STWP is not responsible for trading decisions based on this post.
💬 Did this help you read the chart better?
🔼 Boost | ✍️ Comment | 🔁 Share with a learner
👉 Follow STWP for clean chart-reading insights
🚀 Stay Calm. Stay Clean. Trade With Patience.

POLICYBZR - STWP Equity Snapshot📊 STWP Equity Snapshot – PB Fintech Ltd (POLICYBZR)
(Educational | Chart-Based Interpretation)
POLICYBZR continues to trade within a well-defined range structure, with repeated rejection from the 1960–2000 supply / distribution zone and consistent buyer activity emerging near the 1650–1609 demand / value zone. The stock has once again reverted from upper supply and is currently attempting a recovery from this demand region. The area around 1720–1740 now acts as a near-term balance zone. Holding above this region keeps the recovery attempt structurally valid and allows price to test higher reaction zones near 1755 and 1790, where selling pressure has appeared previously. However, sustained acceptance above these levels would be required to improve directional confidence. On the downside, continued weakness below 1650, and especially below 1609, would signal structural weakness and increase the probability of deeper mean reversion within the range. Until either boundary is resolved, price action should be viewed as rotation rather than trend development.
Recent market conditions reflect a neutral but stabilising environment. The recent strong bullish candle highlights buyer response from demand, but not trend confirmation. Bollinger Band behaviour shows that price is emerging from a compressed phase, with early expansion attempts visible, though follow-through remains limited. The BB squeeze context indicates potential for movement, but direction remains undecided. RSI near 45–46 reflects balanced momentum, consistent with a range-bound market rather than a trending phase. Price interaction with short-term averages suggests short-term stabilisation, while the wide CPR structure reinforces expectations of two-sided activity, consolidation, and rotational price behaviour instead of immediate directional continuation.
Volume analysis adds important context to the recovery attempt. Participation has improved during the recent bounce from demand, indicating active buyer involvement rather than a low-liquidity reaction. At the same time, volume intensity remains moderate (Vol X near 1.0), with no signs of climax or exhaustion. Selling phases have not been accompanied by aggressive volume expansion, suggesting controlled supply rather than panic distribution. Overall, volume behaviour supports range stability and validates the demand-side response, while still falling short of confirming accumulation or breakout intent.
From a short swing perspective, POLICYBZR remains structurally neutral as long as price trades between the 1650–1609 demand zone and the 1960–2000 supply zone. Acceptance above intermediate resistance would be required to shift bias toward higher range expansion. Conversely, sustained acceptance below 1609 would elevate downside risk and suggest continuation of mean reversion toward lower structural levels. Until such confirmation occurs, consolidation and rotational movement within the range should be expected.
Final Outlook (Condition-Based):
Momentum is improving but not decisive, the trend remains range-bound, risk is elevated due to overhead supply, and volume is supportive but non-confirmatory.
💡 STWP Learning Note
In range markets, demand reactions show interest — only acceptance above supply confirms intent.
⚠️ Disclaimer
This post is shared strictly for educational and informational purposes. It is not investment advice or a recommendation. Please consult a SEBI-registered financial advisor before making any financial decision.
🚀 Stay Calm. Stay Clean. Trade With Patience.

Market Outlook & Trade Setup – Friday, 23rd January 2025The Indian equity markets witnessed a highly volatile session on Friday, 23rd January 2025, reflecting continued uncertainty and cautious sentiment among market participants.
NIFTY Price Action Overview:
NIFTY began the day on a strong note, opening nearly 170 points higher. However, the optimism was short-lived as the index faced selling pressure from higher levels, falling nearly 253 points from the day’s high. Post this sharp decline, the market entered a consolidation phase, trading in a narrow range for most of the session. Interestingly, the final hour saw a strong recovery of nearly 160 points, indicating buying interest at lower levels.
This intraday behavior clearly highlights a battle between bulls and bears, with buyers attempting to defend critical support zones while overall sentiment remains fragile.
Key Technical Levels to Watch:
NIFTY has bounced from an important 1-year support zone, which is a technically positive sign.
The index closed at 25,328, hovering close to the 150-day Moving Average (MA) — a level that often acts as a medium-term trend indicator.
Crucial support: 25,000
Immediate resistance: 25,500
A sustained move above 25,500 could bring short-term relief, while a breakdown below 25,000 may invite further downside pressure.
Market Sentiment Remains Weak:
Despite the late-session recovery, the broader sentiment continues to remain cautious to weak. Traders are advised to avoid aggressive positions and focus more on price confirmation and risk management rather than prediction-based trades.
Gold & Silver ETF Update:
Precious metal ETFs saw a noticeable correction during the recent sessions:
Gold and Silver ETFs corrected between 7% to 15%
Many of these ETFs found support near their 20-day Moving Average, suggesting a potential technical bounce rather than a trend reversal.
This correction appears to be healthy in nature and should be monitored closely for fresh setups.
Market Holiday Ahead:
Please note that the market will remain closed on Monday, 26th January 2025, on account of Republic Day. Traders should factor this into their position sizing and overnight risk planning.
Final Thoughts:
The current market structure demands patience, discipline, and technical clarity. Volatility is creating opportunities—but only for those who understand price action and key levels.

ASTRAL - STWP Equity Snapshot📊 STWP Equity Snapshot – Astral Ltd (ASTRAL)
(Educational | Chart-Based Interpretation)
ASTRAL continues to trade within a broader range-bound structure, with price oscillating between well-defined supply and demand zones rather than establishing a sustained trend. After facing rejection near the 1593–1600 supply zone, price moved into a corrective phase and recently reacted from the 1333–1293 demand region, where buyers have previously stepped in. The current price is stabilising near the 1424 balance area, which now acts as an important near-term reference. Holding above this zone keeps the structure intact and allows price to retest higher reaction zones near 1441–1470, where selling pressure has emerged earlier. On the downside, sustained weakness below 1367, and more importantly below the 1333 demand zone, would increase downside risk and reinforce the broader range structure. Until price decisively exits either boundary, movement should be viewed as rotation within the range rather than trend development.
Indicator readings reflect a mixed but stabilising environment. The recent strong bullish candle with open near the low signals short-term buyer response from demand rather than trend confirmation. Bollinger Band behaviour highlights prior volatility contraction, with early signs of expansion emerging, though follow-through remains limited. The BB squeeze context suggests the market is transitioning from compression toward potential movement, but direction is still undecided. RSI near 47 indicates balanced momentum, neither weak nor strong, aligning with the ongoing range structure. Price interaction with short-term averages shows attempts at stabilisation, while a wide CPR structure reinforces the expectation of two-sided trade and consolidation rather than immediate directional continuation.
Volume behaviour provides constructive but cautious confirmation. Participation has expanded during the recent rebound, indicating active involvement from buyers near demand rather than a low-volume reaction. At the same time, volume intensity remains within a healthy range (Vol X ~1.4–1.5), with no signs of climax or exhaustion. Selling phases have not shown aggressive volume expansion, suggesting supply pressure is controlled. Overall, volume dynamics support range stability and recovery attempts but stop short of confirming accumulation or breakout intent.
From a short swing perspective, ASTRAL remains structurally neutral as long as price trades between the 1333–1293 demand zone and the 1593–1600 supply zone. Acceptance above intermediate resistance levels would be required to improve directional confidence toward higher range-expansion zones. Conversely, sustained acceptance below 1293 would elevate downside risk and shift focus toward deeper structural demand. Until either boundary is resolved, consolidation and rotation within the range should be expected.
Final Outlook (Condition-Based):
Momentum is improving but not decisive, the trend remains range-bound, risk stays elevated due to proximity to both demand and supply, and volume is supportive but not confirming a directional shift.
💡 STWP Learning Note
Range markets reward patience and structure awareness more than prediction.
⚠️ Disclaimer
This post is shared strictly for educational and informational purposes. It is not investment advice or a recommendation. Please consult a SEBI-registered financial advisor before making any financial decision.
🚀 Stay Calm. Stay Clean. Trade With Patience.

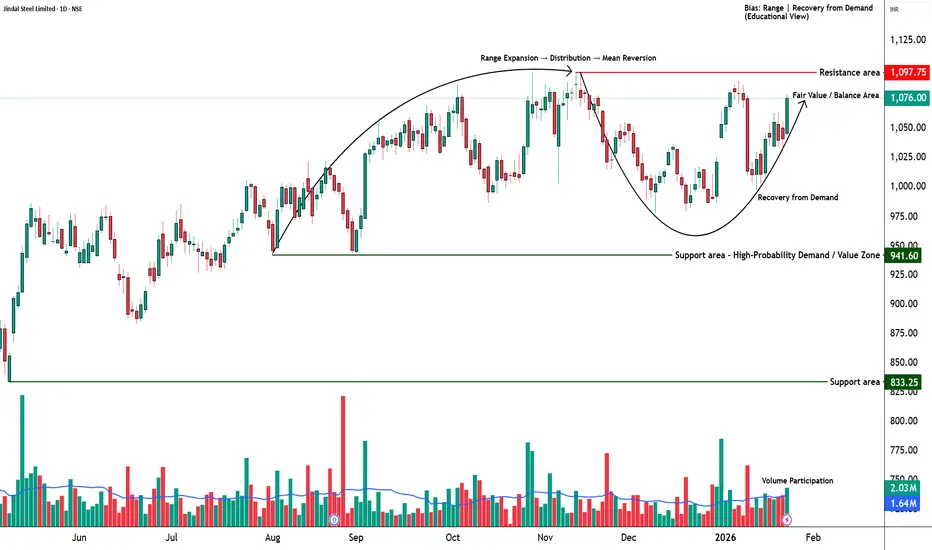
JINDALSTEL - STWP Equity Snapshot📊 STWP Equity Snapshot – Jindal Steel Ltd (JINDALSTEL)
(Educational | Chart-Based Interpretation)
JINDALSTEL is trading within a broader upward structure while navigating a short-term recovery from a recent corrective phase. Price has rebounded strongly from the 1031–1019 demand zone, an area that has historically attracted buyers and acted as structural support. The current price is stabilising near the 1079 balance area, which now serves as a key near-term reference for structure. Holding above this zone keeps the short-term structure constructive and allows price to test higher reaction zones near 1089–1101, where prior supply has emerged. Acceptance above these zones would be required to improve directional confidence. On the downside, any sustained weakness below 1053 initially, and more importantly below 1031, would increase downside risk toward deeper demand and signal a return to range-bound or corrective behaviour. As long as price remains above the primary demand zone, the broader uptrend framework remains intact.
Indicator readings from the green dashboard support a developing bullish structure but with conditions. The presence of a strong bullish candle reflects renewed buyer initiative after consolidation, while Bollinger Band behaviour highlights a prior compression phase now transitioning into early expansion. The BB squeeze context increases the relevance of the current move, suggesting improving volatility conditions rather than a late-stage rally. RSI near 60 indicates strengthening internal momentum without entering stretched or overbought territory, supporting continuation potential while keeping exhaustion risk contained. Price holding above short-term trend measures and VWAP reinforces near-term stability. However, interaction with a wide projected CPR structure suggests that the market environment still favours balance and consolidation, meaning follow-through and acceptance matter more than single-session strength.
Volume behaviour adds an important layer of confirmation. Participation has expanded during bullish candles, indicating active buyer involvement rather than a low-liquidity bounce. Volume intensity remains around healthy levels (Vol X ~1.3), showing interest without signs of climax or emotional excess. Recent pullbacks have not been accompanied by aggressive selling volume, suggesting that supply is being absorbed rather than distributed. Overall, volume dynamics support a controlled recovery and align with accumulation-type behaviour rather than exhaustion.
From a short swing perspective, JINDALSTEL maintains a constructive bias as long as price holds above the 1031–1019 demand zone. If acceptance improves above nearby supply, higher range-expansion reference zones around 1192–1278 come into focus over the coming sessions. Conversely, sustained acceptance below 1019 would elevate downside risk and indicate a shift from recovery into a deeper corrective or range phase. Until such a failure occurs, consolidation above demand should be viewed as structural digestion rather than weakness.
Final Outlook (Condition-Based):
Momentum is strong and improving, the broader trend remains upward, risk stays elevated due to nearby supply and a wide CPR environment, and volume remains supportive but requires continued follow-through.
💡 STWP Learning Note
Strong candles initiate moves; structure and acceptance decide sustainability.
⚠️ Disclaimer
This post is shared strictly for educational and informational purposes. It is not investment advice or a recommendation. Please consult a SEBI-registered financial advisor before making any financial decision.
🚀 Stay Calm. Stay Clean. Trade With Patience.
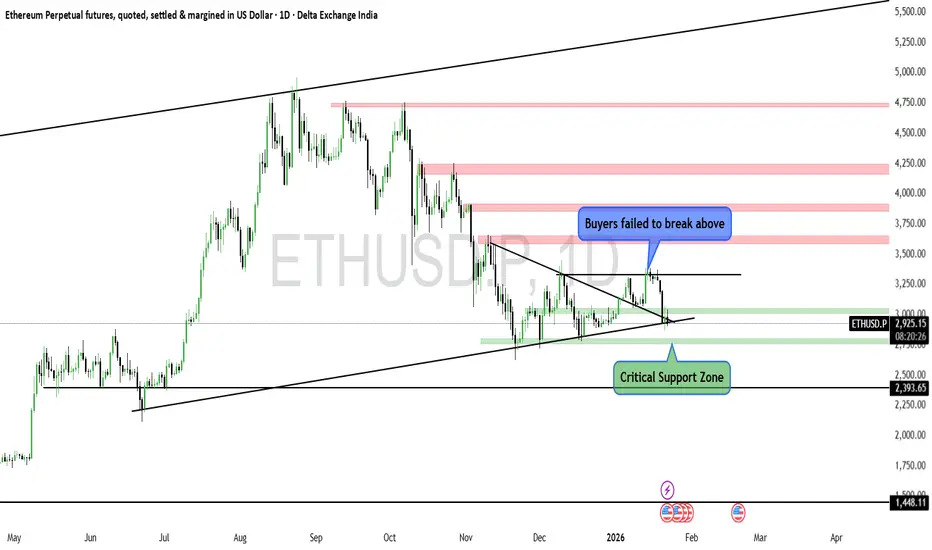
#ETH lost the bullish momentum?
Seems like ETH failed to break the previous high.
But the trend is still not reversed. Until it holds the "Critical Support" level, we can consider side way movement.
If it breaks below the critical support then the downside may continue.
This indicator is provided for educational and informational purposes only.
It does not constitute financial advice, investment recommendations, or trade signals.
The creator and Systematic Traders Club are not responsible for any financial losses resulting from the use of this indicator.
Trading and investing involve risk. Always do your own analysis and use proper risk management.
COLPAL - STWP Equity Snapshot📊 STWP Equity Snapshot – Colgate-Palmolive (India) Ltd (COLPAL)
(Educational | Chart-Based Interpretation)
COLPAL has transitioned from a corrective phase into a demand-led recovery, with price reacting decisively from the 2097–2074 demand zone. This zone has historically attracted buyers, and the recent rebound reflects active absorption of selling pressure rather than a passive bounce. Price is now stabilising around the 2184 balance area, which acts as an important near-term reference. Sustained holding above this zone keeps the short-term structure stable and allows price to test higher reaction zones between 2288 and 2358, where acceptance will determine continuation quality. On the downside, any weakness below 2184 increases risk toward 2138 initially, followed by a deeper retest of the 2097–2074 primary demand zone, where the broader structure would be reassessed. As long as price remains above this demand band, the larger trend framework stays constructive.
Indicator readings from the dashboard support this developing structure. The presence of a strong bullish candle emerging after a period of consolidation indicates renewed buyer initiative. Bollinger Band behaviour shows prior volatility compression, with early signs of expansion now appearing, suggesting a shift from balance toward directional intent rather than a late-stage move. The BB squeeze context increases the relevance of the current expansion attempt, while RSI near the bullish mid-zone (~60) reflects improving internal strength without signs of exhaustion. Price holding above short-term trend measures reinforces near-term stability. At the same time, interaction with a wide CPR structure suggests that the market remains in a balanced environment, where consolidation, pauses, or controlled pullbacks toward value zones are more likely than immediate acceleration. Acceptance and follow-through remain more important than candle size alone.
Volume behaviour adds important confirmation to the price structure. Participation has expanded during bullish candles, indicating genuine buyer involvement rather than a low-liquidity reaction. Volume intensity remains within a healthy range, with no signs of climax or exhaustion typically associated with late-stage moves. Pullbacks have occurred on relatively lighter volume, suggesting that selling pressure is being absorbed rather than aggressively expanding. Overall, volume dynamics align with a controlled recovery and support the view that the move is being built through participation rather than emotion.
From a short swing perspective, COLPAL maintains a positive structural bias as long as price holds above the 2097–2074 demand zone. If acceptance improves and momentum sustains, higher range-expansion reference zones between 2388 and 2541 come into focus over the coming sessions. Conversely, sustained acceptance below 2074 would elevate downside risk and indicate a transition from recovery into a deeper corrective phase. Until such failure occurs, consolidation above demand should be viewed as healthy digestion of gains rather than structural weakness.
Final Outlook (Condition-Based):
Momentum is moderate and improving, the broader trend remains upward, risk stays elevated due to the recovery nature of the move and nearby supply, and volume remains supportive but requires continued follow-through.
💡 STWP Learning Note
Strong recovery candles show intent — confirmation comes only with acceptance above supply.
⚠️ Disclaimer
This post is shared strictly for educational and informational purposes. It is not investment advice or a recommendation. Please consult a SEBI-registered financial advisor before making any financial decision.
🚀 Stay Calm. Stay Clean. Trade With Patience.

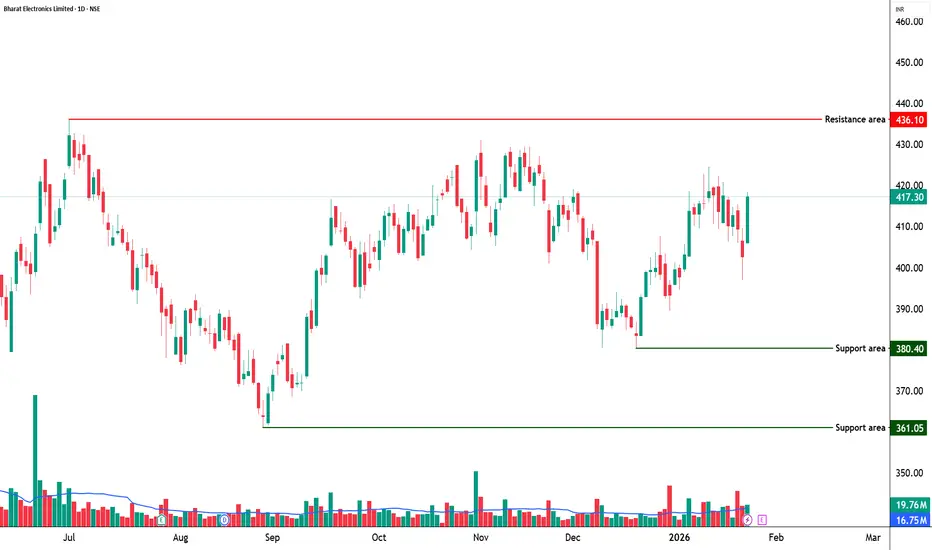
BEL - STWP Equity Snapshot📊 STWP Equity Snapshot – Bharat Electronics Ltd (BEL)
(Educational | Chart-Based Interpretation)
Market Structure
BEL continues to trade in a structurally strong uptrend, characterized by higher highs and higher lows on the daily timeframe. Recent price action reflects consolidation after a sharp upward expansion, suggesting digestion of gains rather than distribution. The broader structure remains constructive, with price holding above key support zones and maintaining bullish alignment.
Demand–Supply Structure
Price has respected a well-defined demand zone in the 402–397 region, where buyers have consistently defended declines. The recent bullish reaction from this area indicates demand absorption and willingness to support price at higher value levels. Overhead supply is visible near recent highs, but selling pressure appears controlled, indicating healthy supply management rather than aggressive profit booking.
Key Levels – Daily Timeframe
Primary demand zones are placed near 409, followed by deeper structural support around 402–397. These zones represent areas where buyers have previously stepped in with conviction. On the upside, resistance and reaction zones are located near 421, 426, and 434, which may act as pause or acceptance areas during further upside attempts.
What the Chart is Saying
Momentum remains supportive, with RSI holding near 57–58, reflecting healthy strength without signs of exhaustion. Price continues to trade above key moving averages, reinforcing trend integrity. Volume participation remains above average during bullish candles, suggesting continuation interest rather than speculative activity.
CPR Impact
BEL is trading above the CPR pivot with a relatively narrow CPR structure, which generally supports directional continuation rather than range-bound behavior. Acceptance above the CPR zone indicates short-term bullish control. However, the projected CPR ahead appears wider, hinting at the possibility of brief consolidation before the next directional phase.
Additional Structure Observations
Recent pullbacks have been shallow and followed by strong recovery attempts, indicating dip-buying behavior. Short-term moving averages remain positively aligned, while the longer-term structure continues to slope upward. The absence of heavy selling volume during declines suggests effective absorption of supply. Overall, the structure supports continuation, subject to normal consolidation and acceptance checks.
Intraday Reference Levels (Structure-Based)
The 418 zone acts as the near-term balance area and remains the key intraday reference. Sustained holding above 418 keeps the structure stable and supports upside testing toward the 436–449 zone, which represents upside reaction areas where price may pause or require acceptance. On the downside, weakness below 418 increases risk toward the 402–397 demand zone, where intraday structure would be reassessed. These levels define intraday risk versus opportunity, not directional certainty.
Swing Reference Levels (Hybrid Model | 2–5 Days)
From a short-term swing perspective, BEL remains within a positive structural framework as long as price holds above the 402–397 primary demand zone. If strength sustains, the 449–473 zone emerges as a higher range-expansion reference area over the coming sessions. Conversely, sustained acceptance below 397 would elevate downside risk and indicate a shift from consolidation toward deeper corrective behavior. Until such failure occurs, consolidation above demand should be viewed as constructive.
Final Outlook (Condition-Based)
Momentum remains strong and supportive of the prevailing structure. The trend is clearly up, with buyers maintaining control above key demand zones. Risk remains elevated due to proximity to resistance and recent price expansion, while volume stays moderate and healthy, supporting continuation rather than exhaustion.
💡 STWP Learning Note
Strong trends often pause through consolidation, not reversal.
Respect structure and let price confirm continuation.
📘 STWP Approach
Observe price. Respect risk.
Trade structure, not prediction.
⚠️ Disclaimer
This post is shared strictly for educational and informational purposes.
It is not investment advice or a recommendation.
Please consult a SEBI-registered financial advisor before making any financial decision.
🚀 Stay Calm. Stay Clean. Trade With Patience.
POL/USDT MACRO SETUP | 1700%+ POTENTIAL IF HTF STRUCTURE HOLDSPOL is currently trading within a major higher-timeframe accumulation zone after a prolonged downtrend from the 2024 highs. Price is building a long-term base inside a falling wedge / descending channel, a structure that often precedes macro trend reversals.
Technical Structure
• HTF demand holding at $0.13 – $0.10
• Price compression near multi-year lows, indicating seller exhaustion
• Falling wedge approaching maturity (bullish reversal pattern)
• Macro structure remains valid above 0.097 (HTF close)
• A break and acceptance above ~0.17 is required for bullish confirmation
Expansion Targets (HTF): $0.286 / $0.435 / $0.704 / $1.20 / $2.00+
This presents a high risk-to-reward positional setup if HTF demand continues to hold and a confirmed breakout occurs with volume.
Invalidation: HTF close below $0.097
This analysis is for educational purposes only.
Not financial advice. Always do your own research.

ZOTA - STWP Equity Snapshot📊 STWP Equity Snapshot – Zota Health Care Ltd
(Educational | Chart-Based Interpretation)
Market Structure
ZOTA witnessed a sharp corrective phase from higher levels, followed by a strong rebound from a well-defined demand zone. The recent candle stands out as a decisive bullish reaction, indicating aggressive buying interest after prolonged selling pressure. Despite the strength of the bounce, price is still trading within a broader range, and the larger trend structure has not yet shifted into a clear uptrend.
Demand–Supply Structure
Price moved deeply into a historical demand zone where buyers stepped in with conviction. The strong bullish candle suggests absorption of selling pressure and short-term buyer dominance. However, overhead supply zones remain active, meaning the current move should be viewed as a recovery from demand rather than a confirmed breakout. Sustained strength is required for further range expansion.
Key Levels – Daily Timeframe
Immediate demand zones are placed near 1376, followed by lower structural supports around 1290 and 1250. These are areas where buyers have previously defended price. On the upside, resistance zones are visible near 1451, 1526, and 1652, where selling pressure has historically emerged. These levels act as reaction zones and help define the current range.
What the Chart is Saying
Momentum has improved significantly after the recent bullish expansion, supported by strong volume participation. RSI is recovering from lower levels, indicating improving internal strength, but it is still not in a trending zone. The structure remains range-bound, suggesting that price may consolidate or oscillate between demand and supply zones before showing directional clarity.
CPR Impact
ZOTA is currently interacting with a wide CPR structure, which typically signals indecision and range-bound behavior. Earlier price action stayed below CPR resistance, reinforcing the lack of strong directional bias. For any sustained bullish shift, price would need to show acceptance above the CPR pivot with follow-through. Until then, the CPR structure supports a cautious, range-based view.
Additional Structure Observations
The rebound candle carries added significance as it formed with an open equal to the low, indicating immediate buyer control and minimal intraday selling pressure. This move was supported by clear volume expansion, suggesting participation beyond short-term traders and pointing toward stronger hands absorbing supply near demand. Short-term moving averages are attempting to turn up, reflecting improving momentum, while price remains below longer-term averages, keeping the broader structure neutral. RSI has recovered from lower levels but is still below bullish expansion zones, indicating support without trend confirmation. Additionally, the projected wide CPR for the next session reinforces the probability of consolidation or two-sided activity rather than immediate directional continuation. Overall, the move reflects strength from demand, but structural acceptance above nearby supply is still required for confirmation.
Intraday Reference Levels (Structure-Based)
The reference price zone near 1400 acts as a short-term decision area. Weakness below this zone may expose price toward lower demand regions around 1290. On the upside, reaction zones near 1450 and above are areas where price may pause or face selling pressure. These are observational levels, not predictions.
Swing Reference Levels (Hybrid Model | 2–5 Days)
For the short swing perspective, the 1400 zone remains the structural reference. Failure to hold demand increases downside risk toward deeper support zones. If strength sustains, higher range-expansion zones above previous resistance come into focus, but only as conditional possibilities within the broader range.
Final Outlook (Condition-Based)
Momentum is strong in the short term, supported by volume expansion. The trend remains range-bound, with no confirmed directional control yet. Risk remains high due to the counter-trend nature of the recovery and nearby supply zones. Volume is elevated, indicating participation, but structure confirmation is still pending.
💡 STWP Learning Note
Strong rebounds from demand show intent — not confirmation.
Let structure and acceptance guide bias, not candle size.
📘 STWP Approach
Observe price. Respect risk.
Trade structure, not excitement.
⚠️ Disclaimer
This post is shared strictly for educational and informational purposes.
It is not investment advice or a recommendation.
Please consult a SEBI-registered financial advisor before making any financial decision.
🚀 Stay Calm. Stay Clean. Trade With Patience.

HAL Weekly Chart suggest BO above 4680 ... 20% upside Possible.HAL Weekly Chart suggest BO above 4680 ... 20% upside Possible.
HAL looks breaking out from Earlier tops of 4680 after long time. Expect momentum to continue for 20% upside soon.
We can see multiple patterns on chart ... Daily CUP / Weekly CUP / DEC 24 Top Breakout.
LTP - 4736
SL - 4650
Targets - 5680+
timeframe - 10-12 weeks.
Happy Investing.

What"s next for IBKR ?Stock has been testing the 52 wk high resistance zone for quite a few times . After the earning boost , stock is poised to give a new ATH in the next 3-6 months depending upon macro and global uncertainities. Next stock target from current price is 86-90 $ per share translating into a return of almost 10 % from the current levels .

Part 9 Trading Master Class With Experts Role of Options in Modern Financial Markets
Options play a crucial role in:
Price discovery
Risk transfer
Market liquidity
Institutional hedging
Algorithmic and quantitative trading

End of the crazy gasInside the channel targetting 5.635 to 5.64. If rejected from there, bears are in for a treat after the mad week in the recent history of natgas
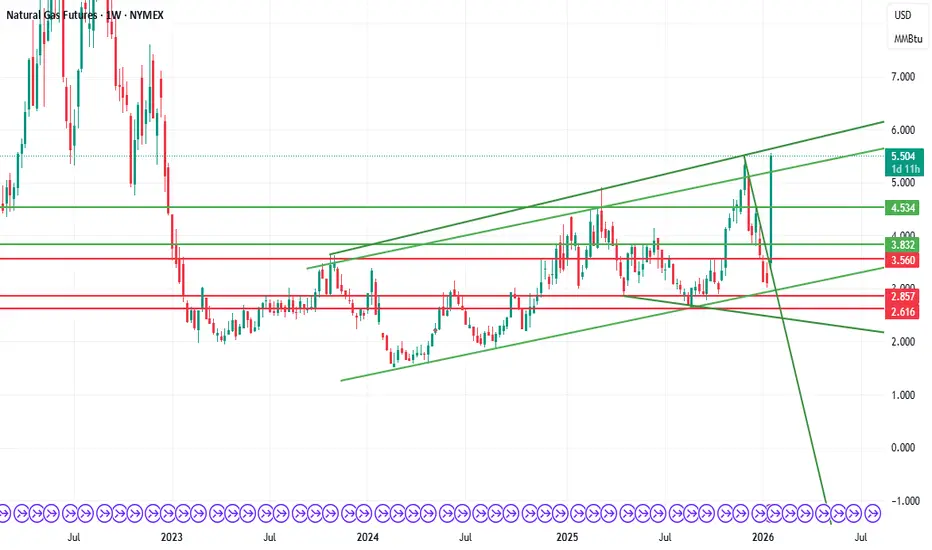
NatGas LongCurrent Price: 3.557, immediate support and SL 3.498 , long with a target of 3.75, and trailing it to 3.9 4.091 and so on. For short positions enter after support 3 break and take support 2 as SL , tgt would be kept at 3.25.

Part 10 Trade Like Institutions Volatility (Vega)
Options become expensive when volatility rises.
This usually happens:
Before major news: RBI policy, elections, budgets, Fed meetings.
During event-based uncertainty.
After events → IV crashes → Options become cheaper → Buyers suffer.

NIFTY – Short-term & Long-term Outlook from Demand ZoneNifty has shown a strong rejection from the 24,900–24,500 historical demand zone.
On the 4H chart:
Long lower wick near 24,900 indicates aggressive buyer participation.
RSI exhaustion and reversal suggests selling pressure has weakened.
Trendline and EMAs remain intact.
Short-term View:
Above 24,900 → upside possible towards 25,600 – 25,900
Below 24,900 (sustained) → downside towards 24,500
Long-term View:
24,500 is the major invalidation level.
Above 24,700–24,900, bias remains bullish on dips.
Upside targets: 26,000 – 26,400+
Disclaimer:
I am not a SEBI registered advisor. This analysis is for educational purposes only. Please do your own research before taking any trades.

XAUUSD (Gold) – Short-Term Bullish Rebound Within Broader ConsolPrice Action
Gold has rebounded from the recent swing low near 4775–4780, forming higher lows.
Price is moving along an ascending trendline (blue dashed line), indicating short-term bullish momentum.
However, the broader structure still looks like a range / consolidation after a prior impulsive move.
RSI (14)
RSI is around 54, back above the mid-line (50).
Earlier bearish RSI divergence played out, but momentum is now recovering, suggesting buyers are regaining control.
No overbought condition yet → room for further upside.
Awesome Oscillator (AO)
AO remains below zero, but red bars are shrinking.
This signals waning bearish momentum and a potential shift toward bullish pressure.
MACD (12,26,9)
MACD is still slightly below the signal line, but histogram is contracting upward.
Early signs of a bullish crossover forming if momentum continues.
Key Levels
Immediate Support: 4800 / 4775
Trend Support: Rising trendline from recent low
Resistance: 4850 → 4875
Upside Extension: 4900+ if bullish continuation confirms

KALYANKJIL 1 Week Time Frame 📌 Current Price Snapshot (Weekly Context)
₹~391–396 — the stock is trading near its 52‑week low range after heavy selling pressure.
NSE/BSE trend is bearish on weekly charts (sell signals and down momentum).
📊 1‑Week Time Frame – Pivot & Key Levels
📉 Weekly Pivot & Levels (from pivot analysis)
(These are derived from weekly pivot point calculations, representing expected turning points for the week)
📌 Weekly Pivot:
Pivot: ~₹479.12
👊 Weekly Resistances:
R1: ~₹495.23
R2: ~₹522.97
R3: ~₹539.08
🛑 Weekly Supports:
S1: ~₹451.38
S2: ~₹435.27
S3: ~₹407.53
👉 The current market price (~₹392–396) is below the first major weekly support (~₹451) and closer to the third weekly support at ~₹407.5 — indicating deep bearish momentum this week.
🧠 Summary – 1‑Week Level Playbook
Bearish near‑term risk:
Break below ~₹407 opens potential towards psychological lower bands.
Key levels for traders this week:
Support to watch: ~₹407 (S3)
Initial resistance to challenge: ~₹451 (S1 on weekly pivot)
Major resistance zones: ~₹495 and ~₹523
