2026 XAUUSD/GOLD YEARLY ANALYSISXAUUSD / GOLD – 2026 Yearly Buy Plan
With Entry, Stop Loss & Targets
🔹 Market Bias
Gold (XAUUSD) is bullish for 2026 based on:
Global economic uncertainty
Central bank gold accumulation
Expected US interest-rate cuts
Strong long-term bullish structure on the daily chart
🔹 Buy Zones (Entries)
✅ Major Buy Zone (Best Risk–Reward)
Entry: 3,250 – 3,300
This zone is near:
Golden Fibonacci retracement
Yearly swing low
Strong institutional demand area
👉 Suitable for positional & long-term investors
✅ First Confirmation Buy
Entry: 3,950 – 4,050
Buy only if price holds above support and shows bullish candles
👉 Suitable for safe swing traders
🔴 Stop Loss (Risk Control)
🛑 Stop Loss Placement
Stop Loss: Below 3,150
Reason:
Break of yearly structure
Bullish view invalid below this level
📌 Risk should be 1–2% per trade, not more.
🎯 Take Profit Targets (2026)
🎯 Target 1
4,800 – 5,000
Partial profit booking recommended (30–40%)
🎯 Target 2
5,800 – 6,000
Trail stop loss to cost or profit
🎯 Target 3 (Long-Term Extreme Target)
7,500 – 7,800
Only for patient positional holders
🔹 Trade Management Plan
Buy only on pullbacks, not at highs
Book partial profits at each target
Move stop loss gradually as price moves up
Avoid over-leverage
Xausdanalysis

Gold (XAU): Fed Cut Incoming? Breakout Time!I. 📰 FUNDAMENTAL ANALYSIS (FA)
The Vibe: The US Dollar (DXY) is facing serious heat! The US Fed's recent dovish signals are a major tailwind for non-yielding Gold.
Fed's New Tune: Big guns like Governors Williams and Waller are now talking about rate cuts soon. Why? Because US economic data (Retail Sales, Consumer Confidence) is getting weaker, boss.
Market Buzz: The market is pricing in a strong nearly 85% probability of a 25bps rate cut in December. Picture clear, right?
Takeaway: This shift is Massively Bullish for Gold because lower interest rates make the Dollar less attractive.
II. 📈 TECHNICAL ANALYSIS (TA)
The Scene: Gold is currently bumping heads with a major hurdle – the Discount Zone (our supply zone). The real action is here!
Crucial Resistance: Gold is testing the Discount Zone (the main resistance area). This is the make-or-break level.
The Short Game (Bearish): Wait for a clear rejection signal at this resistance zone. If it holds, a correction is coming.
The Long Game (Bullish): For Gold to go on a proper rally, it needs a Strong Breakout and Close above the entire resistance area.
💡 THE STRATEGY
Focus on the Resistance Level: Trade based on Confirmation, whether that's a reversal signal for a short correction, or a strong breakout for a fresh long position.
Don't miss the US data tonight (Durable Goods/Jobless Claims) – it will be the real fire starter!
#GoldTrading #XAUUSD #ForexIndia #FedRates #DovishFed #TechnicalAnalysis #MarketUpdate #FinanceIndia

XAUUSD/GOLD 1H SELL PROJECTION 08.05.25Bearish setup on XAUUSD (Gold vs. USD) with a strong indication for a potential short/sell opportunity based on several technical signals:
Key Observations:
Three Black Crows Pattern:
Clearly marked and highlighted on the chart.
This is a classic bearish reversal pattern indicating strong selling pressure.
Break of Neckline:
The price has broken below a previously established neckline area, confirming bearish momentum.
Support Becomes Resistance:
The neckline zone (~$3350.880) is now acting as resistance after the breakdown, further validating the short setup.
Target Levels:
Support S1 around $3330.
Support 2 near $3311.354 – likely the final target area for the sell projection.
Stop Loss Zone:
Clearly marked at $3362.631, above the broken support (now resistance).
Summary:
Entry Zone: Around current price (~$3344)
Stop Loss: $3362.63
Take Profit Zones:
TP1: ~$3330 (Support S1)
TP2: ~$3311.35 (Support 2) bearish setup on XAUUSD (Gold vs. USD) with a strong indication for a potential short/sell opportunity based on several technical signals:
Key Observations:
Three Black Crows Pattern:
Clearly marked and highlighted on the chart.
This is a classic bearish reversal pattern indicating strong selling pressure.
Break of Neckline:
The price has broken below a previously established neckline area, confirming bearish momentum.
Support Becomes Resistance:
The neckline zone (~$3350.880) is now acting as resistance after the breakdown, further validating the short setup.
Target Levels:
Support S1 around $3330.
Support 2 near $3311.354 – likely the final target area for the sell projection.
Stop Loss Zone:
Clearly marked at $3362.631, above the broken support (now resistance).
Summary:
Entry Zone: Around current price (~$3344)
Stop Loss: $3362.63
Take Profit Zones:
TP1: ~$3330 (Support S1)
TP2: ~$3311.35 (Support 2)

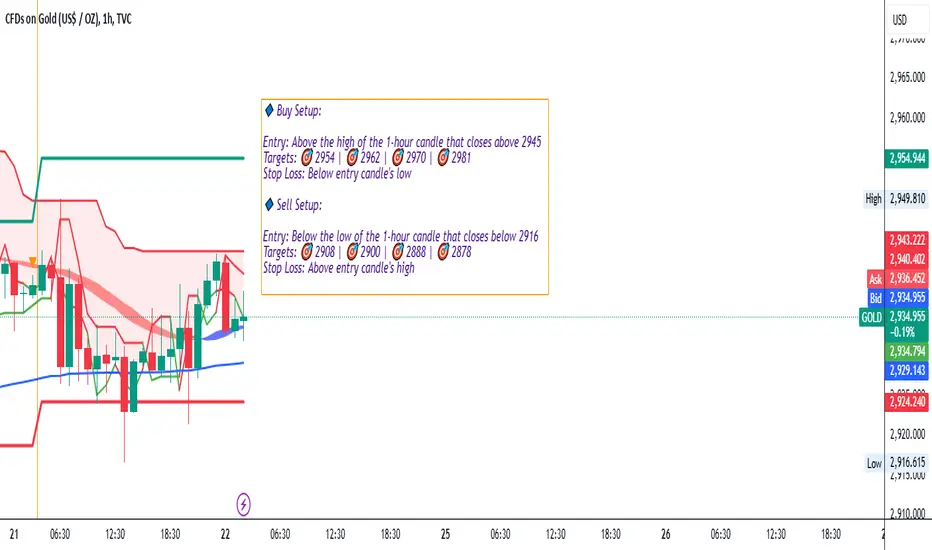
Gold Trading Strategy for 24th Feb 2025📊 GOLD INTRADAY TRADING PLAN 📊
📌 Strategy: This plan is based on the breakout of a significant level after a confirmed 1-hour candle close.
🟢 Buy Setup (Bullish Breakout)
🔹 Entry Condition: Enter a buy position above the high of the 1-hour candle that closes above 2945.
🔹 Targets:
🎯 First Target: 2954
🎯 Second Target: 2962
🎯 Third Target: 2970
🎯 Final Target: 2981
🔹 Stop Loss: Below the low of the entry candle.
🔹 Risk Management: Ensure proper lot sizing based on your risk appetite.
🔴 Sell Setup (Bearish Breakdown)
🔹 Entry Condition: Enter a sell position below the low of the 1-hour candle that closes below 2916.
🔹 Targets:
🎯 First Target: 2908
🎯 Second Target: 2900
🎯 Third Target: 2888
🎯 Final Target: 2878
🔹 Stop Loss: Above the high of the entry candle.
🔹 Risk Management: Follow strict position sizing and risk-reward ratio.
⚠ Important Notes:
📌 Confirmation is key – Wait for a full 1-hour candle close before entering a trade.
📌 Avoid trading during high-impact news events as they may cause sudden volatility.
📌 Use a trailing stop-loss to maximize profits in a strong trend.
🚨 Disclaimer:
This analysis is for educational purposes only and should not be considered as financial advice. Trading in financial markets involves significant risk, and past performance is not indicative of future results. Always trade with proper risk management and consult with a financial expert before making trading decisions. 📉📈
GOLD SHOWING A GOOD UP MOVE WITH 1:7 RISK REWARDGOLD SHOWING A GOOD UP MOVE WITH 1:7 RISK REWARD
DUE TO THESE REASON
A. its following a rectangle pattern that stocked the market
which preventing the market to move any one direction now it trying to break the strong resistant lable
B. after the break of this rectangle it will boost the market potential for break
C. also its resisting from a strong neckline the neckline also got weeker ald the price is ready to break in the outer region
all of these reason are indicating the same thing its ready for breakout BREAKOUT trading are follws good risk reward
please dont use more than one percentage of your capitalfollow risk reward and tradeing rules
that will help you to to become a bettertrader
thank you

XAUSDHii Guys here is the trade for today, of XAUSD,
Market is purely bullish we can expect market to give the high risk reward today.

Xausd next week moves hello traders gold next move over all gold in down trend so we can accept more down trend because fed is in this week gold may be in this ranges
