XAUUSD / GOLD – 1H SELL PROJECTION (05-02-2026)
Gold was moving inside a rising channel, respecting the uptrend line.
However, price failed to sustain bullish momentum and clearly broke the uptrend, indicating a market structure shift.
After the breakdown:
Price retraced back into a Fair Value Gap (FVG)
The retracement got rejected near Resistance (R1)
A Three Black Crows candlestick pattern formed, confirming strong bearish pressure
This rejection from the FVG zone after an uptrend break signals a high-probability sell continuation setup.
🔍 Confluences Used
Broken uptrend line
Fair Value Gap (Sell zone)
Resistance rejection
Three Black Crows pattern
Bearish market structure
🎯 Trade Expectation
Sell from FVG zone
Stop Loss: Above recent high
Targets:
TP1: Previous support
TP2: Lower liquidity / Support S3
Xauusd4h

Gold Faces Key Resistance as Pullback Risk BuildsChart Analysis
Gold is in a short-term recovery phase after a clear bearish structure earlier (multiple BOS to the downside). The market has since printed a CHoCH, signaling a potential shift toward bullish momentum, and price is now trading inside a broader discount zone (green box), which supports the recovery narrative.
However, price is currently stalling below a key resistance area around 4995, where multiple technical factors converge:
Prior structure resistance (BOS level)
Fair Value Gap (FVG) mitigation
Local equal highs / liquidity resting above
This makes the current zone a decision area rather than a clean breakout point.
The highlighted POI between ~4840 – 4790 aligns well with:
Demand zone
FVG support
Previous structure support
A pullback into this zone would be technically healthy and could offer a higher-probability continuation setup if bullish reaction and displacement appear.
Bias summary:
Short-term: Cautious bullish, but vulnerable to pullback
Resistance: ~4995
Support / POI: 4840 – 4790
Bullish continuation requires: Strong break and acceptance above resistance

Three White Soldiers Pattern Gold Buy Projection 27.01.26🔍 Technical Breakdown
Market Structure:
Overall structure remains bullish. Price already broke the neckline and a successful retest is completed, confirming continuation bias.
Retracement Zone:
Price has completed a 50% Fibonacci retracement, which is a high-probability buy zone in an uptrend.
Candlestick Confirmation:
Formation of Three White Soldiers indicates strong bullish momentum returning after the pullback.
📍 Key Levels
Entry for Buy:
Near 5065 – 5070 (Support + Retest zone)
Support Levels:
Support: ~5070
Support S1: ~5050
Targets / Resistance:
R1 / Target Zone: 5095 – 5105
Further upside possible if R1 breaks with volume
🎯 Trade Idea (Projection)
Bias: BUY on dips
Logic:
✔ Break & retest confirmed
✔ 50% retracement respected
✔ Bullish candle pattern
✔ Strong rejection from support
⚠️ Risk Note
If price sustains below 5050, bullish projection may fail and consolidation / deeper correction is possible.

BTCUSD Daily Chart – Corrective Phase with Potential Trendline BPrice Structure:
Bitcoin is trading around $88,800, coming off a strong rejection from the $95k–$97k area. The broader structure since November shows a downtrend transitioning into consolidation, with recent price action respecting a rising diagonal trendline support (blue dashed line). Price is currently testing this trendline, making this a decision zone.
Trend & Key Levels:
Immediate Support: $87,500 – $88,000 (trendline + recent swing lows)
Major Support: $83,000 – $85,000 (range bottom / demand zone)
Immediate Resistance: $91,000 – $92,500
Major Resistance: $95,000 – $100,000
RSI (14):
RSI is around 41.7, below the 50 midline but above oversold. This suggests weak momentum, yet not exhaustion. No strong bullish divergence is confirmed yet, but downside momentum is slowing.
Awesome Oscillator (AO):
AO remains negative, though histogram bars are flattening. This indicates bearish momentum is losing strength, not yet reversed.
MACD (12,26,9):
MACD is still below the zero line with a bearish crossover, but the histogram is contracting. This often precedes either sideways consolidation or a potential bullish reversal if price holds support.
Overall Bias:
Neutral to cautiously bullish if the trendline holds.
A daily close below $87k would invalidate the trendline and open the door toward $83k–$80k.
A strong bounce with volume could target $92k → $95k initially.
Scenario Outlook:
Bullish Scenario: Trendline holds → RSI curls up → MACD histogram flips positive → move toward $95k+
Bearish Scenario: Trendline breaks → increased selling pressure → retest of $83k support zone
Conclusion:
BTC is at a critical inflection point. Momentum indicators are weak but stabilizing, suggesting a possible short-term bounce, though confirmation requires a strong bullish daily close above $91k. Until then, expect choppy price action near support.

XAUUSD (Gold) – Short-Term Bullish Rebound Within Broader ConsolPrice Action
Gold has rebounded from the recent swing low near 4775–4780, forming higher lows.
Price is moving along an ascending trendline (blue dashed line), indicating short-term bullish momentum.
However, the broader structure still looks like a range / consolidation after a prior impulsive move.
RSI (14)
RSI is around 54, back above the mid-line (50).
Earlier bearish RSI divergence played out, but momentum is now recovering, suggesting buyers are regaining control.
No overbought condition yet → room for further upside.
Awesome Oscillator (AO)
AO remains below zero, but red bars are shrinking.
This signals waning bearish momentum and a potential shift toward bullish pressure.
MACD (12,26,9)
MACD is still slightly below the signal line, but histogram is contracting upward.
Early signs of a bullish crossover forming if momentum continues.
Key Levels
Immediate Support: 4800 / 4775
Trend Support: Rising trendline from recent low
Resistance: 4850 → 4875
Upside Extension: 4900+ if bullish continuation confirms

SKY ROCKET XAUUSD/GOLD BUY PROJECTION 21.01.26rend = Strong Bullish
Price uptrend channel la travel pannudhu ✅
Bullish momentum candle confirm pannudhu ✅
Break + retest idea perfect ✅
Fair Value Gap (FVG) zone la re-entry buy chance iruku ✅
📌 Trade Plan (Based on your chart)
🟦 BUY AREA (Entry Zones)
✅ Zone 1 (Best Entry):
📍 FVG + retest area around 4720 – 4680
✅ Zone 2 (Aggressive Entry):
📍 Breakout retest near 4750 – 4720
🛑 STOPLOSS (Chart la marked)
📍 Below structure support / zone
✅ Stoploss: 4660 – 4640
🎯 Targets (As per Projection)
🎯 Target 1: ~4850 (Target Price 1)
🎯 Target 2: ~5000 (Target Price 2 / Major resistance + Fib retracement)
📌 Confirmation Checklist (Signal)
Buy confirm panna:
✅ Retest candle + rejection wick
✅ Bullish close above retest zone
✅ Trendline hold

XAUUSD (Gold) 45-Minute Chart – Bullish Trend Holding with MomenTrend & Structure:
Gold remains above the ascending trendline, confirming a valid short-term bullish trend. The recent candles show sideways consolidation after a strong impulsive rise, which typically favors continuation as long as support holds.
Price Action:
The market is forming higher lows while compressing below recent highs. This price behavior suggests indecision, not rejection—buyers are still defending dips.
RSI (14):
RSI is around 57–58, holding above the 50 level. This indicates bullish momentum, though momentum has stabilized rather than accelerated, consistent with consolidation.
Awesome Oscillator (AO):
AO bars remain above zero but decreasing, signaling that bullish momentum is cooling, not reversing. A fresh green expansion would confirm continuation.
MACD:
MACD histogram is slightly negative and contracting, while lines are flattening. This supports a pause within trend, not a confirmed bearish crossover.
Key Levels:
Immediate Support: Rising trendline / recent higher-low zone
Resistance: Consolidation highs near the recent swing top
Trend Failure: Strong close below the trendline

XAUUSD/GOLD 1H SELL LIMIT PROJECTION 19.01.26✅ XAUUSD / GOLD (1H) – SELL LIMIT PROJECTION (19.01.26)
Gold is currently respecting the 1H downtrend line, and price is moving in a bearish structure. Even though we saw a bullish engulfing reaction from demand, this move is likely a pullback before bearish continuation.
📌 Key Levels
🔴 Supply / Resistance Zone: 4615.608
This level is acting as a premium zone + resistance area.
⚫ Key Mid Support/Resistance: 4585.679
Important reaction level. Price must reclaim & hold above this for further upside push.
🔵 Demand / Support Zone: 4576 – 4578
Strong demand region where buyers previously entered and formed engulfing.
📍 Current Market Price: 4596.320
📉 Trade Idea (Sell Limit Setup)
✅ Sell Limit Entry: 4610 – 4615 (inside supply + trendline confluence)
🛑 Stoploss: 4628 – 4630 (above supply highs)
🎯 Targets:
TP1: 4585.679
TP2: 4576 – 4578 (Demand zone)
📊 Risk-Reward: 1:2
🧠 Setup Logic
✔ 1H trendline still bearish
✔ Entry at premium / supply zone (4615.608)
✔ Target into support/demand zone (4576 – 4578)
✔ High probability continuation after pullback
⚠️ Confirmation: Watch for bearish rejection / wick near 4615 zone

XAUUSD Daily Chart – Bullish Trend Intact but Momentum Cooling NTrend Structure
Gold remains in a clear medium-term uptrend, respecting a rising trendline since August.
Price is currently pulling back toward the trendline, which acts as dynamic support.
As long as price holds above this trendline, the bullish structure remains valid.
Price Action
Recent candles show consolidation / mild correction after a strong impulsive move.
No decisive bearish engulfing or breakdown yet — this looks more like profit-taking than trend reversal.
Key support zone: 4,380 – 4,420
Key resistance zone: 4,480 – 4,550
RSI (14)
RSI around 59, above the 50 midline → bullish bias still intact.
Previous bearish divergence signals have already played out with the current pullback.
RSI cooling suggests momentum is slowing, not reversing.
Awesome Oscillator (AO)
AO remains positive (above zero) but histogram is flattening.
This confirms bullish momentum is weakening, not yet bearish.
MACD
MACD lines are losing upside momentum and flattening.
Histogram slightly negative → short-term corrective phase ongoing.
No strong bearish crossover yet on the higher timeframe.
Overall Bias
Primary trend: Bullish
Short-term: Pullback / consolidation
Market condition: Healthy correction within an uptrend
Trading Outlook:
Bullish continuation scenario:
Buy setups favored on trendline or support confirmation.
Bearish risk:
A daily close below the rising trendline would open deeper correction toward 4,250 – 4,200.
Best approach: Wait for confirmation (bullish rejection candle or momentum re-expansion).

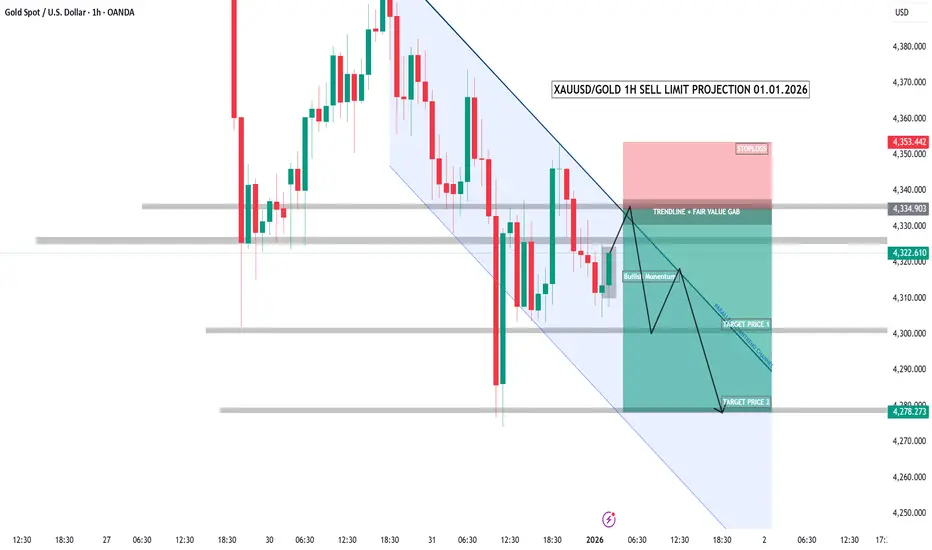
XAUUSD/GOLD 1H SELL LIMIT PROJECTION 01.01.26This is XAUUSD – Gold – on the 1-hour timeframe.
The market is clearly in a downtrend,
forming lower highs and lower lows.
Price is currently in a pullback phase within the trend.
This pullback is moving into a strong confluence zone —
the descending trendline combined with a fair value gap.
This area acts as a high-probability sell zone.
Sell limit area:
4330 to 4340.
Here, we expect a short-term bullish move to trap buyers,
followed by a strong rejection and continuation to the downside.
Stop loss:
4353 — a clear invalidation of the setup.
Target one:
4300 — a short-term support level.
Target two:
4278 — a strong demand zone and trend continuation target.
This is a pullback sell strategy.
Trade with the trend, not against it.
No emotions.
No overtrading.
Only structure, discipline, and patience.
Gold (XAU/USD) — Bullish Continuation Setup on 1H📊 Technical Analysis
1. Overall Trend
The market remains in an uptrend, confirmed by higher highs and higher lows.
A trend line drawn from lower left is supporting price structure nicely.
Price is above both the 9 EMA and 15 EMA, indicating short-term bullish momentum.
2. Key Levels
Resistance Zones
Immediate resistance (red box): Currently challenging this level — price is struggling to break above.
Larger supply area above: A wider grey zone above the immediate resistance — likely the next target once cleared.
Major target: ~4580 — marked as the next significant upside.
Support Zones
Minor support (thin horizontal): Around ~4510, could act as intraday support.
Strong demand zone: Around ~4475–4490 — significant buyers previously entered here.
Trend line support beneath the candles — dynamic support reinforcing bullish bias.
3. Price Action & Structure
Recent Break of Structure (BOS) to the upside indicates buyers are in control.
After the BOS, price retraced slightly then resumed higher, a sign of healthy bullish behavior.
Current consolidation at resistance suggests a potential shakeout / liquidity hunt before continuation.
4. Possible Scenarios (as annotated)
Bullish Scenario (favored):
Price consolidates slightly, retests support ~4510–trendline zone,
Then breaks above the red resistance box,
Targets the larger grey supply zone and then ~4580+.
Alternative Short Pullback:
Minor pullback into support,
Then bounce for continuation.
The dotted projected line on your chart reflects this potential pullback → rally sequence.
📉 Volume Context
Buying volume tends to increase on bullish moves,
Showing participation from demand zones — supportive of upside continuation.

XAUUSD 4H: Market Holding Positive StructureGold is moving with a stable bullish setup on the 4H chart. Price behaviour continues to show higher highs and higher lows, supported by consistent buying activity along the trend direction.
The current zone near 4533 is an important area to monitor. A normal retracement may take place, bringing price back toward the 4510–4490 support range, where demand was seen earlier. If buyers stay active, this area can again provide support.
As long as price remains above this support and the overall structure is respected, the possibility of a move toward the 4600 region remains open. Minor pullbacks should be considered part of healthy market flow, not a trend change.
Traders should rely on price confirmation and follow proper risk control. This view is based only on technical analysis and market structure.

XAUUSD (Gold Spot vs USD) – Daily Chart Analysis: Strong UptrendOverall Trend
Gold (XAUUSD) remains in a strong long-term uptrend on the daily timeframe.
Price is making higher highs and higher lows, trading near the upper range around 4,485.
The broader bullish structure is intact despite minor pullbacks.
Price Action
Recent candles show steady bullish continuation, but momentum is slightly slowing.
Price is approaching a descending trendline resistance (blue dashed line), which could act as a short-term cap.
A breakout above this trendline would confirm further upside continuation.
RSI (Relative Strength Index)
RSI is around 81, clearly in the overbought zone.
Previous “Bear” divergence labels suggest that momentum has weakened before at similar RSI levels.
This increases the probability of a short-term correction or consolidation, even if the main trend remains bullish.
Volume
Volume has picked up recently, supporting the latest price advance.
However, volume is not expanding aggressively, hinting at possible buyer exhaustion near current highs.
MACD
MACD remains above the signal line and in positive territory, confirming bullish momentum.
The histogram is modest, suggesting momentum is positive but not accelerating strongly.
Key Levels
Resistance: 4,500 – 4,550 zone and the descending trendline.
Support: 4,350 – 4,300 (previous consolidation zone).
A daily close below support could trigger a deeper pullback toward 4,100–4,200.
Outlook:
Bullish bias remains dominant, but conditions are overbought.
Short-term traders should be cautious of a pullback or sideways consolidation.
Medium- to long-term traders may look for buy-the-dip opportunities as long as price holds above key support.

Gold Looks Prime for All-Time High Breakout📈 Technical Analysis of the Chart
The chart shows XAU/USD (Gold vs. USD) moving in what appears to be an upward-sloping channel — higher lows are marked by trend-line support.
Price recently revisited the lower boundary (support zone + trendline) and appears to have held firm — a bullish signal (i.e. a “retest & bounce”).
The annotation “POI” (Point of Interest) near that bounce suggests a probable pivot from support → initiating the next leg up.
On the upside, the chart projects a move toward a new all-time high (ATH) — the red horizontal line — implying a breakout of the current consolidation zone.
If gold breaks above current resistance and stays above the channel’s upper boundary, that increase could accelerate with bullish momentum. This aligns with typical breakout + retest strategies often used in gold trading.
Conversely, if price fails to hold this support zone and drops below the trendline, the bullish setup would be invalidated — a risk to watch, especially if sentiment shifts.
Technical conclusion: The chart shows a classic channel-retest setup — if upward momentum continues, a move toward the all-time high is well justified. The current bounce from support provides a favorable entry setup for bulls, with manageable risk if a stop-loss is set just below the channel support.
🌍 Fundamental & Macro Context
Gold’s recent strength is driven by expectations of lower interest rates: as a non-yielding asset, gold tends to benefit when rates fall because the opportunity cost of holding gold decreases.
A weaker U.S. dollar — often accompanying potential rate cuts — makes gold cheaper for foreign buyers, adding further demand support.
Broad economic context: unsteady global growth, geopolitical uncertainty, and rising demand for safe-haven assets help maintain strong gold demand.
Market forecasts remain bullish: some analysts see gold reaching as high as $4,950/oz by 2026, with a more likely base-case target around $4,500/oz — assuming rate cuts and continued macroeconomic uncertainty.
That said, the key risk remains in a potential rebound of the U.S. Dollar or abrupt shift in monetary policy (e.g. fewer rate cuts than expected) — either could undercut gold’s rally.
Fundamental conclusion: The macro backdrop — rate-cut expectations, weak USD, and global uncertainty — strongly supports a continuation of gold’s upward trajectory. If these tailwinds persist, gold’s push toward new highs is fundamentally justified.
✅ What This Setup Means & What to Watch
If bullish scenario plays out
Expect price to challenge the all-time high. A breakout may target or even exceed prior ATHs.
A bounce-and-run scenario may attract momentum traders, fueling further upside.
Key triggers to monitor
Keep an eye on announcements from Federal Reserve: rate-cut decisions or dovish signals accelerate gold demand.
Watch USD strength: a strong dollar could cap gains or reverse the uptrend.
Monitor global risk sentiment — geopolitical events or economic slowdown fears tend to push money into gold.
Risk control considerations
Use the channel support / trendline as a stop-loss anchor. A breakdown below could invalidate the bullish bias.
Consider that strong moves in the dollar or surprising inflation data might compress gold’s upside or spark a pullback.
XAUUSD Breakout Retest – Bearish Continuation SetupChart Analysis (XAUUSD)
Here’s a clear breakdown of what the chart shows and what the setup implies:
1. Market Structure
Price previously made a strong push upward, then entered a sideways consolidation zone (highlighted in yellow).
This zone represents accumulation/distribution, where buyers and sellers balanced out before a breakout.
2. Breakout & Retest
Price broke down below the consolidation zone, indicating bearish intent.
After the drop, price is currently doing a retest of the breakout level (where the red horizontal line sits at around 4191.953).
This retest commonly acts as a point where sellers look to re-enter.
3. Trade Setup
A sell position is plotted from the retest area.
The shaded region above represents stop-loss territory.
The two blue arrows mark:
Half Take-Profit (TP 50%) — a mid-level target for partial exit
Full Target — deeper downward continuation expectation
4. Bias
The structure, breakout, and retest all favor a bearish continuation as long as price stays below the retest zone.
The chart suggests a momentum continuation to the downside, targeting the lower green line.
5. Risk Considerations
If price closes back above the red line, the setup becomes invalid.
Consolidation after the breakdown shows indecision — strong bearish confirmation may come only after a clean push down.

Key-Resistance Liquidity Grab → FVG ShortIdea:
Price has reached a key resistance zone — a common place where smart money or institutions may hunt liquidity (stop-losses above resistance before reversing).
There is an unfilled Fair Value Gap (FVG) / imbalance zone drawn below (green “POI / FVG” zone). In price-action trading, these FVGs often act like magnets: after a rapid move, price tends to retrace and “fill” the gap.
The plan: wait for a rejection at resistance (signaling liquidity grab is done), then short — target the FVG/POI zone where the market may come back to fill imbalance.
🎯 Trade Plan (Entry / Exit / Risk-Reward)
Parameter Plan
Entry After a bearish rejection (e.g. long upper-wick candle) near the resistance zone.
Stop-Loss Slightly above the resistance / recent swing high (to avoid being stopped by a false breakout).
Take-Profit (TP) Around / within the FVG / POI zone (green zone on chart) — where imbalance may be filled.
Risk–Reward Aim for at least 1 : 2 — ideally more, depending on how far the FVG is below resistance.
⚠️ What Makes This Setup Valid (and What to Watch)
FVGs mark market inefficiencies / liquidity gaps created by rapid moves, which often get revisited.
A reversal or rejection at a well-defined resistance zone gives signal that the liquidity hunt may be done and a move downward may begin.
But — if price breaks cleanly and strongly above the resistance (with momentum), the short trade becomes invalid.
Also, FVGs don’t always get filled. Entry should ideally wait for a clear rejection or confirmation, not just assume a fill.

BTC/USD – Support Reclaim Signals Potential Bullish ContinuationChart Analysis
1. Key Support Zone (≈ 90,350 – 90,920)
Your chart highlights a strong support zone where price previously reacted.
Price has reclaimed this area, showing that buyers stepped in aggressively.
This support aligns with Fibonacci retracement levels, strengthening its validity.
2. Current Price Structure
BTC is consolidating just above support, forming a minor bullish structure.
A higher-low formation is visible, suggesting buyers remain in control.
The drawn white arrow also suggests an expected retest before continuation.
3. Local Resistance Cluster (≈ 92,500 – 94,000)
The upper shaded zone marks a major resistance, possibly a supply region.
This aligns with Fib extension levels (2.618–3.618).
This is the area where sellers are likely to show up again.
4. Bullish Scenario (Most Probable Based on Chart)
If BTC holds above 90,920, a rally toward the resistance zone is likely.
The large grey projection box indicates a potential move to ~93,500–94,000.
Momentum from the recent strong bullish candle also supports the upside.
5. Bearish Risk Scenario
Losing 90,350 on strong volume could invalidate the bullish setup.
If that happens, price may revisit 87,500–88,000 (Fib confluence).

XAUUSD – Potential Distribution Phase Signaling Deeper Bearish TAnalysis of the Chart
Your chart shows a full market cycle structure based on Wyckoff + Smart Money Concepts (SMC). Here’s a clean breakdown:
1️⃣ Previous Accumulation Phase (Left Side)
Multiple BOS (Break of Structure) labels confirming bullish intent.
CHoCH followed by accumulation zones.
Price gradually builds liquidity (SSL / price points).
Strong bullish impulsive leg begins after accumulation.
2️⃣ Strong Bullish Trend Continuation
Successive BOS levels show continuation of bullish strength.
Several mitigation blocks / filled imbalances visible.
Price aggressively pushes toward the premium ceiling zone.
3️⃣ Entry Into Distribution Phase (Top Right)
Market reaches Premium Ceiling Zone.
Signs of exhaustion appear:
Lower high formations
Reversal zone highlighted
Shift in character from expansion → distribution
4️⃣ Bearish Reversal Structure Forming
The chart shows:
A potential descending structure
Expectation of liquidity sweeps followed by deeper decline
First bearish target (Target One) around 3,902
Second bearish target (Target Two) around 3,700
These levels align with prior imbalances and discount pricing.
5️⃣ Market Psychology According to the Chart
Bulls losing momentum after premium pricing reached
Smart money distributing positions
Expecting a retracement toward major discount areas
Possible sweep of liquidity before continuation downward

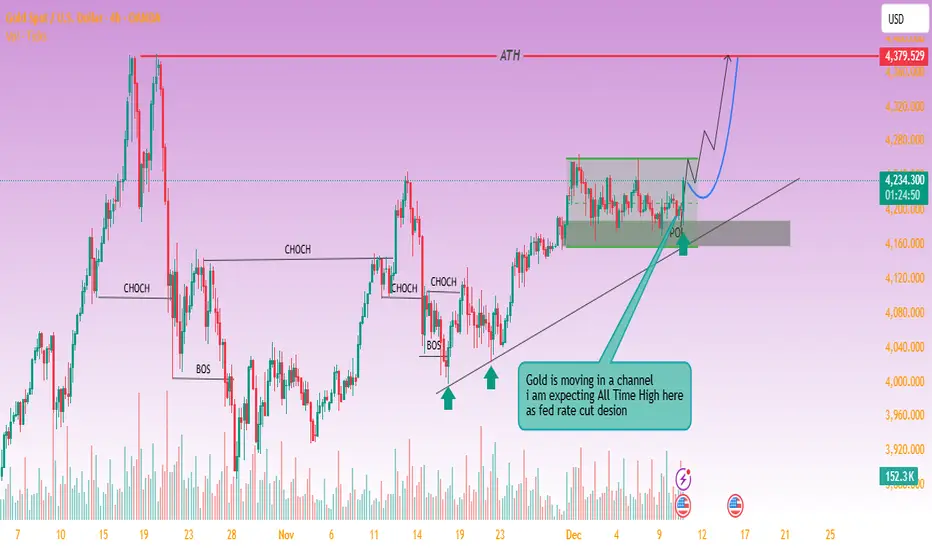
Current Market Structure & Key Observations Previous Trend: The Current Market Structure & Key Observations
Previous Trend: The chart shows a strong uptrend from late October, peaking around November 14th at approximately $4,400. This peak marked a significant reversal.
Correction/Reversal: Since the peak, the price has undergone a sharp downward correction or potential reversal.
Trendline Interaction: The price has recently fallen to and is currently interacting with a major long-term ascending trendline (the solid black line).
Current Price: The price is hovering right at the trendline, indicated by the dashed pink line at approximately $4,034.
Analysis of the Projected Path (Red Lines)
The red lines drawn on the chart suggest a specific bearish scenario:
Trendline Break and Retest: The price is shown to break below the ascending trendline. This is a critical technical signal, often indicating the end of the uptrend and the start of a downtrend.
Pullback/Retest: The price then executes a pullback back up to the broken trendline (now acting as a resistance level). The projected high for this pullback is around $4,060.
Bearish Continuation: After failing to break back above the trendline, the price is projected to continue its decline, heading towards the area of $3,900 and then possibly $3,850 in the following days.
Potential Scenarios (Alternative View)
While the red lines illustrate a clear bearish path, it's important to consider an alternative:
Scenario 1: Bearish Continuation (As Projected)
Action: If the price confirms a breakout below the trendline (closes below it on multiple candles), the trendline turns into resistance.
Target: The focus shifts to lower support levels, with initial targets around $3,900 - $3,850. This confirms the end of the recent uptrend.
Scenario 2: Trendline Hold/Bounce
Action: If the trendline acts as strong support and the price fails to close significantly below it, it could lead to a bounce.
Target: A bounce would target the previous swing high before the major drop, potentially aiming back toward $4,150. This would maintain the longer-term bullish structure.

XAUUSD Potential Reversal Zone & Bullish Channel Projection (45-1. Price Action Context
Gold (XAUUSD) has been in a short-term downtrend, shown by a sequence of lower highs and lower lows.
Price is currently trading around 4113 after a sharp drop.
2. Key Zone: RESISTANCE Turned SUPPORT
The highlighted red zone around 4081 – 4103 is marked as a major support / demand zone.
This appears to be a level where buyers are expected to step in.
The squiggly black arrows indicate a possible liquidity grab or fake breakout before the true move begins.
3. Projected Bullish Recovery
The gray vertical projection box and upward channel lines suggest the author expects:
A bounce from the 4081–4103 support
A move up through the channel
A potential target around 4220, which aligns with the upper boundary of the projected ascending channel.
4. Trend Channel
A rising channel has been plotted, projecting the potential direction over the next sessions.
Price bouncing inside the lower area of the channel suggests:
The down move might be ending
Momentum could shift toward a bullish correction or even a trend reversal
5. Key Levels Highlighted
Support zone:
4,081.888
4,103.142
Bullish target:
4,220.041
These levels are visually marked and consistent with a reversal strategy.
🧭 Overall Interpretation
This chart proposes a bullish reversal setup, with traders watching for:
A potential liquidity sweep at the support zone
A bounce and consolidation
A climb toward the upper channel area, with 4220 as a projected target
This is a counter-trend reversal idea, so confirmation would be crucial (rejection wicks, bullish candle structures, RSI turning up, etc.).

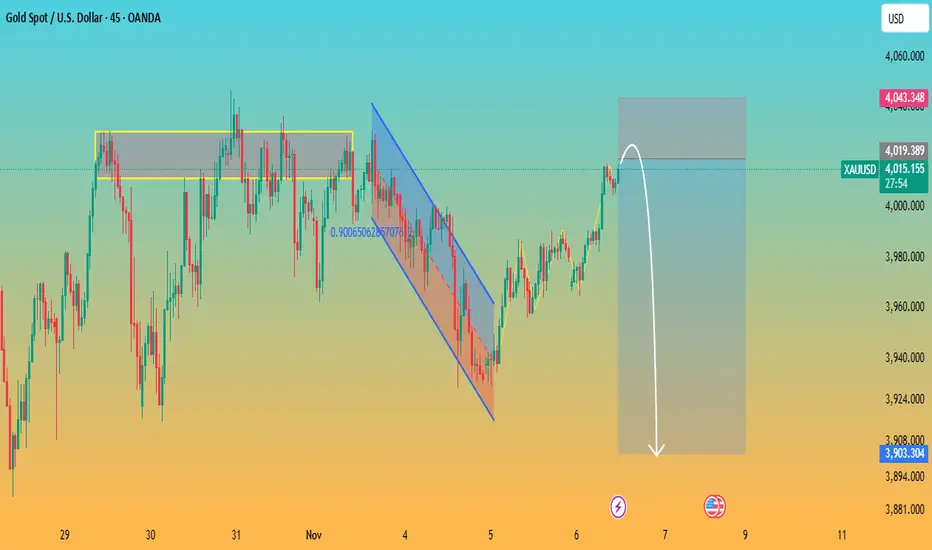
Gold Rejection at Resistance – Bearish Channel Targeting 3930📉 Analysis:
The chart shows a clear shift from an uptrend into a bearish correctional channel:
1. Uptrend Broken
Price previously followed a clean uptrend channel, making BOS (Break of Structure) swings upward.
A ChoCH (Change of Character) occurred, confirming momentum weakening.
2. Strong Resistance Zone
Price entered the 4018–4030 resistance level, marked as a weak high.
This zone acted as a reaction area, causing multiple rejections.
3. Bearish Channel Formation
After hitting resistance, price began forming lower highs and lower lows inside a falling channel.
The rejection line confirms sellers defending the zone.
4. Expected Bearish Leg
The projected path shows consolidation inside the channel followed by a sharp downward impulsive move.
Clean liquidity below supports the bearish scenario.
5. Targets
Major target: 3930
(Highlighted as the trader's target and matches channel support + demand zone.)
📌 Summary
Gold is rejecting the 4020–4030 resistance and forming a bearish channel. A continuation downward toward 3930 remains likely unless price breaks above the resistance with strong momentum.

Gold Rejection at Resistance with Potential Bearish PullbackAnalysis:
The chart shows XAUUSD approaching a strong horizontal resistance zone around 4015–4020, a level where price has previously been rejected multiple times (highlighted in yellow). The market recently broke out of a falling channel, showing short-term bullish momentum, but now price is stalling again at this key resistance.
The grey zone above suggests a supply area, and the white arrow indicates a projected bearish move. As long as gold stays below this resistance, the probability of a downward correction increases.
A potential bearish target appears around 3900–3920 (previous support zone), where buyers may re-enter.
Key Points:
Strong multi-touch resistance at 4015–4020
Price showing early rejection signs
Bearish correction likely if price fails to break above resistance
Downside targets: 3920, possibly 3900
Gold Faces Strong Rejection at Supply Zone – Bearish ContinuatioThe chart shows Gold testing a strong supply zone around 4000–4025. Price attempted to push higher but failed, forming a clear rejection wick followed by consolidation.
Key observations:
Supply Zone (Resistance): 4000–4025 area has repeatedly rejected price, showing strong seller presence.
Structure: Market is forming lower highs, indicating weakening bullish momentum.
Break & Retest: Price pulled back to the broken structure level and is now reacting bearishly.
Projected Move: The arrow suggests a potential drop toward the 3900–3910 demand zone.
Momentum: Candlestick rhythm supports a bearish continuation scenario as long as price stays below 4000.
✅ Bearish Bias
If the rejection holds:
Downside target: 3900–3910
Invalidate bearish idea: A 4H close above 4025
