XAUUSD (Gold) 45-Minute Chart – Strong Bullish Continuation AbovTrend:
Gold is in a clear bullish trend. Price has made higher highs and higher lows, accelerating strongly on Jan 28 with a breakout and momentum expansion.
Market Structure:
Earlier consolidation zones (value areas) were broken to the upside, followed by acceptance above prior ranges.
The most recent move shows impulsive buying, suggesting institutional participation rather than a weak breakout.
Volume Profile (VCP):
Previous High Volume Nodes (HVN) around 5,080–5,120 acted as resistance, now flipped into support.
Current price is trading above the Point of Control (POC), which confirms bullish control.
Low volume above indicates price discovery, meaning less resistance overhead.
Key Levels:
Resistance: 5,270–5,300 (current highs / psychological zone)
Immediate Support: 5,120–5,100 (previous value area high)
Deeper Support: 5,020–4,980 (range low & demand zone)
Bias:
Bullish while above 5,100
Pullbacks into previous value areas are likely to attract buyers.
Trading Insight:
Best opportunities are buy-the-dip setups rather than chasing highs.
A rejection with high volume below 5,100 would be the first warning sign of a deeper correction.
Xauusdbuy

Three White Soldiers Pattern Gold Buy Projection 27.01.26🔍 Technical Breakdown
Market Structure:
Overall structure remains bullish. Price already broke the neckline and a successful retest is completed, confirming continuation bias.
Retracement Zone:
Price has completed a 50% Fibonacci retracement, which is a high-probability buy zone in an uptrend.
Candlestick Confirmation:
Formation of Three White Soldiers indicates strong bullish momentum returning after the pullback.
📍 Key Levels
Entry for Buy:
Near 5065 – 5070 (Support + Retest zone)
Support Levels:
Support: ~5070
Support S1: ~5050
Targets / Resistance:
R1 / Target Zone: 5095 – 5105
Further upside possible if R1 breaks with volume
🎯 Trade Idea (Projection)
Bias: BUY on dips
Logic:
✔ Break & retest confirmed
✔ 50% retracement respected
✔ Bullish candle pattern
✔ Strong rejection from support
⚠️ Risk Note
If price sustains below 5050, bullish projection may fail and consolidation / deeper correction is possible.

BTCUSD Daily Chart – Corrective Phase with Potential Trendline BPrice Structure:
Bitcoin is trading around $88,800, coming off a strong rejection from the $95k–$97k area. The broader structure since November shows a downtrend transitioning into consolidation, with recent price action respecting a rising diagonal trendline support (blue dashed line). Price is currently testing this trendline, making this a decision zone.
Trend & Key Levels:
Immediate Support: $87,500 – $88,000 (trendline + recent swing lows)
Major Support: $83,000 – $85,000 (range bottom / demand zone)
Immediate Resistance: $91,000 – $92,500
Major Resistance: $95,000 – $100,000
RSI (14):
RSI is around 41.7, below the 50 midline but above oversold. This suggests weak momentum, yet not exhaustion. No strong bullish divergence is confirmed yet, but downside momentum is slowing.
Awesome Oscillator (AO):
AO remains negative, though histogram bars are flattening. This indicates bearish momentum is losing strength, not yet reversed.
MACD (12,26,9):
MACD is still below the zero line with a bearish crossover, but the histogram is contracting. This often precedes either sideways consolidation or a potential bullish reversal if price holds support.
Overall Bias:
Neutral to cautiously bullish if the trendline holds.
A daily close below $87k would invalidate the trendline and open the door toward $83k–$80k.
A strong bounce with volume could target $92k → $95k initially.
Scenario Outlook:
Bullish Scenario: Trendline holds → RSI curls up → MACD histogram flips positive → move toward $95k+
Bearish Scenario: Trendline breaks → increased selling pressure → retest of $83k support zone
Conclusion:
BTC is at a critical inflection point. Momentum indicators are weak but stabilizing, suggesting a possible short-term bounce, though confirmation requires a strong bullish daily close above $91k. Until then, expect choppy price action near support.

XAUUSD (Gold) – Short-Term Bullish Rebound Within Broader ConsolPrice Action
Gold has rebounded from the recent swing low near 4775–4780, forming higher lows.
Price is moving along an ascending trendline (blue dashed line), indicating short-term bullish momentum.
However, the broader structure still looks like a range / consolidation after a prior impulsive move.
RSI (14)
RSI is around 54, back above the mid-line (50).
Earlier bearish RSI divergence played out, but momentum is now recovering, suggesting buyers are regaining control.
No overbought condition yet → room for further upside.
Awesome Oscillator (AO)
AO remains below zero, but red bars are shrinking.
This signals waning bearish momentum and a potential shift toward bullish pressure.
MACD (12,26,9)
MACD is still slightly below the signal line, but histogram is contracting upward.
Early signs of a bullish crossover forming if momentum continues.
Key Levels
Immediate Support: 4800 / 4775
Trend Support: Rising trendline from recent low
Resistance: 4850 → 4875
Upside Extension: 4900+ if bullish continuation confirms

XAUUSD 45-Minute Chart – Strong Uptrend with Overbought MomentumMarket Structure & Trend
XAUUSD is in a clear bullish trend, respecting a rising trendline on the 45-minute timeframe.
Price is making higher highs and higher lows, confirming strong upside momentum.
Recent candles show continuation strength, not a reversal pattern yet.
2. RSI (14)
RSI is around 75.8, firmly in overbought territory.
Multiple bearish divergence labels are visible:
Price makes higher highs
RSI makes lower or flat highs
This suggests bullish momentum is weakening, not that price must immediately fall.
Interpretation:
Overbought + divergence = risk of pullback or consolidation, especially near resistance.
3. Awesome Oscillator (AO)
AO is strongly positive (~88) and rising.
Green histogram dominance confirms bullish momentum is still active.
Slight flattening at the top hints momentum may be peaking.
4. MACD (12,26)
MACD line above signal line → bullish continuation
Histogram is positive but losing expansion, aligning with RSI divergence.
This often precedes pause or shallow correction, not an instant reversal.
5. Price Behavior
Price is still above trendline support
No decisive bearish engulfing or breakdown candle yet
Buyers remain in control, but late buyers face higher risk

SKY ROCKET XAUUSD/GOLD BUY PROJECTION 21.01.26rend = Strong Bullish
Price uptrend channel la travel pannudhu ✅
Bullish momentum candle confirm pannudhu ✅
Break + retest idea perfect ✅
Fair Value Gap (FVG) zone la re-entry buy chance iruku ✅
📌 Trade Plan (Based on your chart)
🟦 BUY AREA (Entry Zones)
✅ Zone 1 (Best Entry):
📍 FVG + retest area around 4720 – 4680
✅ Zone 2 (Aggressive Entry):
📍 Breakout retest near 4750 – 4720
🛑 STOPLOSS (Chart la marked)
📍 Below structure support / zone
✅ Stoploss: 4660 – 4640
🎯 Targets (As per Projection)
🎯 Target 1: ~4850 (Target Price 1)
🎯 Target 2: ~5000 (Target Price 2 / Major resistance + Fib retracement)
📌 Confirmation Checklist (Signal)
Buy confirm panna:
✅ Retest candle + rejection wick
✅ Bullish close above retest zone
✅ Trendline hold

XAUUSD (Gold) 45-Minute Chart – Bullish Trend Holding with MomenTrend & Structure:
Gold remains above the ascending trendline, confirming a valid short-term bullish trend. The recent candles show sideways consolidation after a strong impulsive rise, which typically favors continuation as long as support holds.
Price Action:
The market is forming higher lows while compressing below recent highs. This price behavior suggests indecision, not rejection—buyers are still defending dips.
RSI (14):
RSI is around 57–58, holding above the 50 level. This indicates bullish momentum, though momentum has stabilized rather than accelerated, consistent with consolidation.
Awesome Oscillator (AO):
AO bars remain above zero but decreasing, signaling that bullish momentum is cooling, not reversing. A fresh green expansion would confirm continuation.
MACD:
MACD histogram is slightly negative and contracting, while lines are flattening. This supports a pause within trend, not a confirmed bearish crossover.
Key Levels:
Immediate Support: Rising trendline / recent higher-low zone
Resistance: Consolidation highs near the recent swing top
Trend Failure: Strong close below the trendline

GOLD SHOWING A GOOD UP MOVE WITH 1:8 RISK REWARD GOLD SHOWING A GOOD UP MOVE WITH 1:8 RISK REWARD
DUE TO THESE REASON
A. its following a rectangle pattern that stocked the market
which preventing the market to move any one direction now it trying to break the strong resistant lable
B. after the break of this rectangle it will boost the market potential for break
C. also its resisting from a strong neckline the neckline also got weeker ald the price is ready to break in the outer region
all of these reason are indicating the same thing its ready for breakout BREAKOUT trading are follws good risk reward
please dont use more than one percentage of your capitalfollow risk reward and tradeing rules
that will help you to to become a bettertrader
thank you

XAUUSD/GOLD 1H SELL LIMIT PROJECTION 19.01.26✅ XAUUSD / GOLD (1H) – SELL LIMIT PROJECTION (19.01.26)
Gold is currently respecting the 1H downtrend line, and price is moving in a bearish structure. Even though we saw a bullish engulfing reaction from demand, this move is likely a pullback before bearish continuation.
📌 Key Levels
🔴 Supply / Resistance Zone: 4615.608
This level is acting as a premium zone + resistance area.
⚫ Key Mid Support/Resistance: 4585.679
Important reaction level. Price must reclaim & hold above this for further upside push.
🔵 Demand / Support Zone: 4576 – 4578
Strong demand region where buyers previously entered and formed engulfing.
📍 Current Market Price: 4596.320
📉 Trade Idea (Sell Limit Setup)
✅ Sell Limit Entry: 4610 – 4615 (inside supply + trendline confluence)
🛑 Stoploss: 4628 – 4630 (above supply highs)
🎯 Targets:
TP1: 4585.679
TP2: 4576 – 4578 (Demand zone)
📊 Risk-Reward: 1:2
🧠 Setup Logic
✔ 1H trendline still bearish
✔ Entry at premium / supply zone (4615.608)
✔ Target into support/demand zone (4576 – 4578)
✔ High probability continuation after pullback
⚠️ Confirmation: Watch for bearish rejection / wick near 4615 zone

XAUUSD Daily Chart – Bullish Trend Intact, Momentum ModeratingTrend Structure
Price remains firmly above the rising trendline, confirming a strong medium- to long-term bullish trend.
The sequence of higher highs and higher lows is still intact.
No confirmed trendline break so far → buyers remain in control.
2. Price Action
Current price is consolidating near recent highs rather than selling off aggressively — a bullish continuation characteristic.
The latest pullback appears corrective, not impulsive.
As long as price holds above the trendline and recent higher low, upside bias remains.
3. RSI (14)
RSI is around 68, just below overbought territory.
Previous bearish divergences appeared earlier in the trend, but none are currently active.
RSI holding above 50 supports bullish momentum, though upside may slow short term.
4. Awesome Oscillator (AO)
AO remains positive, indicating bullish momentum is still present.
Histogram shows some fluctuation → momentum is moderating, not reversing.
5. MACD
MACD lines are above the zero line, reinforcing bullish market structure.
Momentum has cooled slightly, suggesting consolidation before the next directional move rather than a trend reversal.
Key Levels
Immediate Support: Rising trendline / recent higher low
Major Support: Prior consolidation zone (mid-range of the trend)
Resistance: Psychological and projected trendline extension toward the upper channel / 5,000 zone
Outlook
Bias: Bullish
Short-term: Sideways to mild pullback possible
Medium-term: Trend continuation favored unless trendline breaks decisively
Bullish continuation remains the higher-probability scenario, with any dips toward trend support likely to attract buyers.

XAUUSD Momentum Bullish /Dollar Weakness & Geopolitical Risks!Hello traders ,
The momentum of gold is still bullish , the recent weakness in the US Dollar continues to support upside momentum in Gold. Additionally, US tensions with Venezuela and Russian attack on Ukraine has increased geopolitical uncertainty,
the Russia-Ukraine war remains unresolved and periodically escalates — maintaining risk premiums in markets, and
✔ political uncertainty (including issues surrounding Trump and U.S. leadership stability) increases overall market volatility and fear sentiment,
Gold is likely to stay in an upward trend as investors continue seeking protection from risk, making it a compelling safe-haven asset in the current global environment.
now gold is heading towards (ATH) All time high but this time it may form a new All time high as Price recently broke structure to the upside and price is respecting an ascending trendline.
here we can plan a upside entry at 4,480–4,460 demand area (previous structure flip) our targets will be
Targets
TP1: ~4,549 (first resistance)
TP2: ~4,582 (higher resistance zone)
TP3: Breakout extension above 4,600

XAUUSD H1 – Bullish Continuation After Strong Break of StructureMarket Structure Analysis
Trend: Clear bullish market structure on H1.
Structure Signals: Multiple BOS (Break of Structure) to the upside confirm trend strength. Prior CHoCH marked the shift from pullback to continuation.
Impulse Move: Strong bullish displacement broke above previous highs, showing institutional participation.
Current Phase: Price is consolidating above a key demand / prior resistance, suggesting acceptance at higher levels.
Key Levels
Immediate Support: ~4,569 (prior structure / demand zone).
Intraday Support: Minor pullback levels within the recent impulse leg (purple lines).
Resistance / Targets:
TP1: ~4,610 – 4,625
TP2: Extension toward 4,650+ if momentum continues.
Bias & Scenarios
Primary Bias (Bullish):
Hold above 4,569 → look for pullback buys into demand with continuation to higher highs.
Alternative (Caution):
Clean break and close below 4,569 → deeper retracement toward lower H1 demand before bullish continuation resumes.
Execution Notes
Prefer buy-on-dip setups after minor retracements.
Watch for liquidity sweep + bullish confirmation on lower timeframes (M5–M15).
Avoid chasing highs; let price come into structure.

“Gold Base Holds — Ready for Breakout?”📊 Technical Chart Analysis (XAU/USD)
📌 Key Levels
Strong Support Zone (Red Box) – Price has been respecting this area and has bounced multiple times — signaling accumulation/support.
Mitigated FVG & CHoCH Area (Green Zone) – This area shows prior imbalance and a possible change of character, now acting as resistance.
Higher Resistance Region (Dark Grey) – A key supply zone the price may target if bullish momentum continues.
Important Horizontal Levels:
• Around ~4300—support (green line)
• Around ~4258—deeper support (red horizontal)
📈 Bullish Scenario (Preferred)
✔ Price is holding above support.
✔ A potential CHoCH (Change of Character) indicates buyers may be stepping in.
✔ The mitigated FVG zone above ~4375/4400 is a logical target if bullish momentum resumes.
✔ The black dashed path on your chart suggests a retest of the support before continuation.
Bullish Path:
Retest support
Bounce and clear local resistance
Rally up toward the grey supply zone above ~4400–4500
📉 Bearish Alternative
If support breaks decisively:
Price could revisit the deeper support ~4258 (red horizontal)
Then possibly resume higher momentum from that level (red dashed path)
🧠 Fundamental Reasons Supporting Bullish Gold (2026)
Here are core macro drivers that could push gold prices higher:
✔ 1. Central Bank Buying & Safe-Haven Demand
Major central banks have been accumulating gold reserves aggressively, reinforcing structural demand and reducing available supply.
The Times of India
✔ 2. Anticipated Monetary Easing
Markets increasingly expect interest rate cuts or easier policy from major central banks in 2026. Lower rates reduce the opportunity cost of holding gold (which doesn’t yield interest).
State Street Global Advisors
✔ 3. Weakening U.S. Dollar
Gold is priced in USD — a weaker dollar typically boosts gold due to increased purchasing power for foreign buyers.
State Street Global Advisors
✔ 4. Geopolitical & Economic Uncertainty
Inflation risk, geopolitical tensions, and global macro instability have historically driven capital into gold as a hedge and safe-haven asset.
Financial Times
✔ 5. Portfolio Diversification & ETF Inflows
Record flows into gold ETFs and strategic institutional allocations have supported price strength.
Morgan Stanley
🟢 Bullish Fundamental Summary
Gold’s fundamentals point to a continued structural bull cycle — even if price consolidates in the short term. Central bank demand, possible rate cuts, USD weakness, and geopolitical uncertainty all provide strong backing for a continued uptrend into 2026.
State Street Global Advisors
+1
📌 Technical + Fundamental Confluence
Bullish Scenario is stronger if:
• Support holds above ~4300–4258
• Price breaks above mitigation zone around ~4400
• Volume increases on upward moves

XAUUSD (Gold) H1 – Bullish Structure Shift with FVG SupportTechnical Analysis (H1)
Market Structure
The chart shows a clear bullish shift after a prior bearish leg.
A CHoCH (Change of Character) to the upside confirms the transition from bearish to bullish market structure.
Multiple BOS (Break of Structure) levels to the upside indicate strengthening bullish momentum.
Order Flow & Liquidity
Price respected a bullish BOS after sweeping sell-side liquidity near the recent lows.
The impulsive bullish move created stacked Fair Value Gaps (FVGs) below current price, suggesting strong institutional participation.
These FVGs act as premium demand zones for potential pullbacks.
Key Zones
Bullish FVG / Demand Zone: ~4,330 – 4,380
→ Ideal area for bullish continuation if price retraces.
Current Price: ~4,439
Upside Liquidity / Target: ~4,500 – 4,550
→ Equal highs and external liquidity resting above.
Bias
Bullish continuation bias as long as price holds above the most recent BOS and FVG support.
Shallow pullbacks into FVGs are likely to be bought.
Invalidation
A strong H1 close below the lowest FVG (~4,330) would weaken the bullish bias and suggest deeper retracement.
Trade Idea (Conceptual)
Buy on retracement into FVG zone
Targets: 4,485 → 4,520 → 4,550
Risk: Invalidation below demand structure

2026 XAUUSD/GOLD YEARLY ANALYSISXAUUSD / GOLD – 2026 Yearly Buy Plan
With Entry, Stop Loss & Targets
🔹 Market Bias
Gold (XAUUSD) is bullish for 2026 based on:
Global economic uncertainty
Central bank gold accumulation
Expected US interest-rate cuts
Strong long-term bullish structure on the daily chart
🔹 Buy Zones (Entries)
✅ Major Buy Zone (Best Risk–Reward)
Entry: 3,250 – 3,300
This zone is near:
Golden Fibonacci retracement
Yearly swing low
Strong institutional demand area
👉 Suitable for positional & long-term investors
✅ First Confirmation Buy
Entry: 3,950 – 4,050
Buy only if price holds above support and shows bullish candles
👉 Suitable for safe swing traders
🔴 Stop Loss (Risk Control)
🛑 Stop Loss Placement
Stop Loss: Below 3,150
Reason:
Break of yearly structure
Bullish view invalid below this level
📌 Risk should be 1–2% per trade, not more.
🎯 Take Profit Targets (2026)
🎯 Target 1
4,800 – 5,000
Partial profit booking recommended (30–40%)
🎯 Target 2
5,800 – 6,000
Trail stop loss to cost or profit
🎯 Target 3 (Long-Term Extreme Target)
7,500 – 7,800
Only for patient positional holders
🔹 Trade Management Plan
Buy only on pullbacks, not at highs
Book partial profits at each target
Move stop loss gradually as price moves up
Avoid over-leverage

XAUUSD Structure Shift After Resistance RejectionXAUUSD earlier showed a clear bullish structure, supported by a rising trendline and consistent higher highs. The price moved steadily until reaching the 4550 resistance level, a zone historically attracting strong selling. Multiple rejections here showed buying exhaustion and growing seller activity.
Market sentiment changed when price could not stay above the trendline. A clear break below dynamic support confirmed a short-term structure change, followed by a strong bearish move. The speed and strength suggest active distribution, not just a minor pullback, showing sellers temporarily in control.
After the sharp decline, price reached key support, where bearish momentum slowed and candles compressed. This shows temporary balance as the market absorbs previous volatility. Such pauses are common after strong moves and act as decision points for the next phase.
From a broader view, this area now indicates market intent. Staying above support may allow stabilisation and corrective recovery, while dropping below maintains downside pressure. Overall, XAUUSD moved from trend continuation to a rebalancing phase, making patience and confirmation vital before the next move.

Gold (XAU/USD) — Bullish Continuation Setup on 1H📊 Technical Analysis
1. Overall Trend
The market remains in an uptrend, confirmed by higher highs and higher lows.
A trend line drawn from lower left is supporting price structure nicely.
Price is above both the 9 EMA and 15 EMA, indicating short-term bullish momentum.
2. Key Levels
Resistance Zones
Immediate resistance (red box): Currently challenging this level — price is struggling to break above.
Larger supply area above: A wider grey zone above the immediate resistance — likely the next target once cleared.
Major target: ~4580 — marked as the next significant upside.
Support Zones
Minor support (thin horizontal): Around ~4510, could act as intraday support.
Strong demand zone: Around ~4475–4490 — significant buyers previously entered here.
Trend line support beneath the candles — dynamic support reinforcing bullish bias.
3. Price Action & Structure
Recent Break of Structure (BOS) to the upside indicates buyers are in control.
After the BOS, price retraced slightly then resumed higher, a sign of healthy bullish behavior.
Current consolidation at resistance suggests a potential shakeout / liquidity hunt before continuation.
4. Possible Scenarios (as annotated)
Bullish Scenario (favored):
Price consolidates slightly, retests support ~4510–trendline zone,
Then breaks above the red resistance box,
Targets the larger grey supply zone and then ~4580+.
Alternative Short Pullback:
Minor pullback into support,
Then bounce for continuation.
The dotted projected line on your chart reflects this potential pullback → rally sequence.
📉 Volume Context
Buying volume tends to increase on bullish moves,
Showing participation from demand zones — supportive of upside continuation.

GOLD Rise Up to $5000 Gold will be rising up to 5K dollors and its EWT seems 2nd wave is pushing to 3rd wave in my PoV .Gold Position Traders Holds Gold for 2026 and May returns High . Flippers can do buy at the current price and forward upwards to the market

XAUUSD (Gold Spot vs USD) – Daily Chart Analysis: Strong UptrendOverall Trend
Gold (XAUUSD) remains in a strong long-term uptrend on the daily timeframe.
Price is making higher highs and higher lows, trading near the upper range around 4,485.
The broader bullish structure is intact despite minor pullbacks.
Price Action
Recent candles show steady bullish continuation, but momentum is slightly slowing.
Price is approaching a descending trendline resistance (blue dashed line), which could act as a short-term cap.
A breakout above this trendline would confirm further upside continuation.
RSI (Relative Strength Index)
RSI is around 81, clearly in the overbought zone.
Previous “Bear” divergence labels suggest that momentum has weakened before at similar RSI levels.
This increases the probability of a short-term correction or consolidation, even if the main trend remains bullish.
Volume
Volume has picked up recently, supporting the latest price advance.
However, volume is not expanding aggressively, hinting at possible buyer exhaustion near current highs.
MACD
MACD remains above the signal line and in positive territory, confirming bullish momentum.
The histogram is modest, suggesting momentum is positive but not accelerating strongly.
Key Levels
Resistance: 4,500 – 4,550 zone and the descending trendline.
Support: 4,350 – 4,300 (previous consolidation zone).
A daily close below support could trigger a deeper pullback toward 4,100–4,200.
Outlook:
Bullish bias remains dominant, but conditions are overbought.
Short-term traders should be cautious of a pullback or sideways consolidation.
Medium- to long-term traders may look for buy-the-dip opportunities as long as price holds above key support.

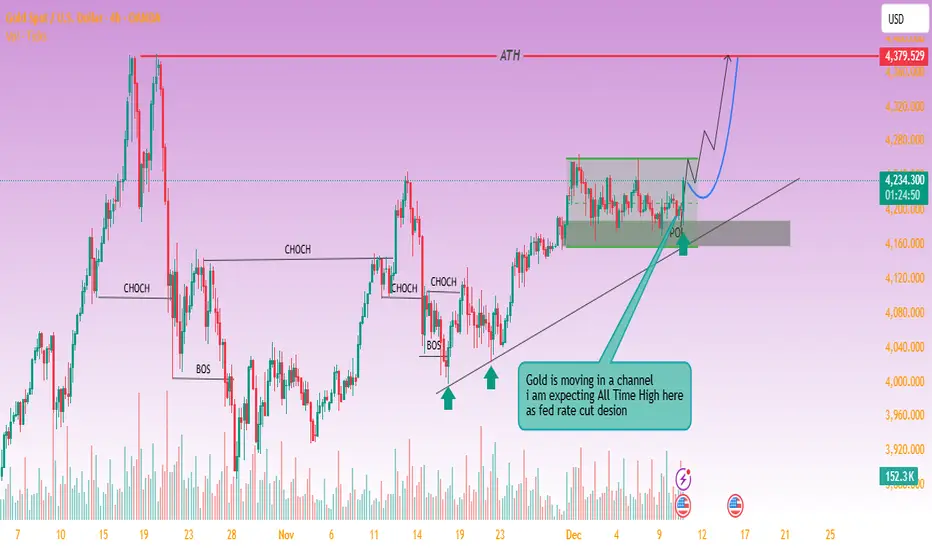
Gold Looks Prime for All-Time High Breakout📈 Technical Analysis of the Chart
The chart shows XAU/USD (Gold vs. USD) moving in what appears to be an upward-sloping channel — higher lows are marked by trend-line support.
Price recently revisited the lower boundary (support zone + trendline) and appears to have held firm — a bullish signal (i.e. a “retest & bounce”).
The annotation “POI” (Point of Interest) near that bounce suggests a probable pivot from support → initiating the next leg up.
On the upside, the chart projects a move toward a new all-time high (ATH) — the red horizontal line — implying a breakout of the current consolidation zone.
If gold breaks above current resistance and stays above the channel’s upper boundary, that increase could accelerate with bullish momentum. This aligns with typical breakout + retest strategies often used in gold trading.
Conversely, if price fails to hold this support zone and drops below the trendline, the bullish setup would be invalidated — a risk to watch, especially if sentiment shifts.
Technical conclusion: The chart shows a classic channel-retest setup — if upward momentum continues, a move toward the all-time high is well justified. The current bounce from support provides a favorable entry setup for bulls, with manageable risk if a stop-loss is set just below the channel support.
🌍 Fundamental & Macro Context
Gold’s recent strength is driven by expectations of lower interest rates: as a non-yielding asset, gold tends to benefit when rates fall because the opportunity cost of holding gold decreases.
A weaker U.S. dollar — often accompanying potential rate cuts — makes gold cheaper for foreign buyers, adding further demand support.
Broad economic context: unsteady global growth, geopolitical uncertainty, and rising demand for safe-haven assets help maintain strong gold demand.
Market forecasts remain bullish: some analysts see gold reaching as high as $4,950/oz by 2026, with a more likely base-case target around $4,500/oz — assuming rate cuts and continued macroeconomic uncertainty.
That said, the key risk remains in a potential rebound of the U.S. Dollar or abrupt shift in monetary policy (e.g. fewer rate cuts than expected) — either could undercut gold’s rally.
Fundamental conclusion: The macro backdrop — rate-cut expectations, weak USD, and global uncertainty — strongly supports a continuation of gold’s upward trajectory. If these tailwinds persist, gold’s push toward new highs is fundamentally justified.
✅ What This Setup Means & What to Watch
If bullish scenario plays out
Expect price to challenge the all-time high. A breakout may target or even exceed prior ATHs.
A bounce-and-run scenario may attract momentum traders, fueling further upside.
Key triggers to monitor
Keep an eye on announcements from Federal Reserve: rate-cut decisions or dovish signals accelerate gold demand.
Watch USD strength: a strong dollar could cap gains or reverse the uptrend.
Monitor global risk sentiment — geopolitical events or economic slowdown fears tend to push money into gold.
Risk control considerations
Use the channel support / trendline as a stop-loss anchor. A breakdown below could invalidate the bullish bias.
Consider that strong moves in the dollar or surprising inflation data might compress gold’s upside or spark a pullback.
Gold (XAU/USD) 30-Minute: Liquidity Grab Setup with Order Block1. Current Price Structure
Price is trending upward on the 30-min timeframe.
Recent candles show higher highs and higher lows, indicating short-term bullish pressure.
2. Liquidity Zone & Order Block
The grey shaded area marked as “liquidity + orderblock” is a confluence zone where stops and institutional orders are likely clustered.
Expect price to revisit this area for a shake-out of weak hands before moving higher.
The up arrow suggests that this zone could act as a launchpad for the next bullish leg.
3. Potential Pullback and Continuation
The scrawled black path shows a probable scenario:
Minor pullback to liquidity/order block area
Support test on the trendline or zone
Followed by a rejection and bullish continuation
4. Key Indicators
EMA 9 (blue) is below current price — supports short-term bullish momentum.
Ichimoku cloud is mostly supportive, with price above key lines (suggests trend stamina).
5. Resistance Ahead
The horizontal red zone near ~4,353 to 4,382 is a major supply area.
A breakout above this would confirm bullish continuation.
However, failure there could lead to deeper pullbacks.
🔥 Summary Bias
Bullish (higher probability setup)
Price is likely to:
Pull back to the support or order block area
Grab liquidity
Rally toward or above the resistance zone
🎯 Key Levels to Watch
Level Significance
~4,353 – 4,382 Major resistance / breakout target
Order Block Zone Liquidity grab & support
Trendline (rising) Dynamic support
EMA 9 Short-term support

XAUUSD Bullish Reversal Setup Toward 4252 – Smart Money StructurChart Analysis
1. Market Structure
Price previously formed a strong swing high near 4252, marked with the red circle.
After that, the market corrected downward and consolidated in a sideways range (highlighted box).
Price has since broken out of that range and is now retesting the breakout zone.
2. Current Zone
Price is hovering around 4198–4200, which appears to be:
A support retest level
A higher-low formation, indicating bullish intent
3. Bullish Expectation
Your arrows and markup suggest:
A small pullback
Followed by a bullish move toward:
First target: ~4219
Main target: 4252, the previous liquidity grab area
This aligns with:
Break of structure (BOS)
Imbalance fill
Smart money concepts (liquidity resting at prior highs)
4. Stop Loss
SL marked near 4180
This sits below the retest zone and protected liquidity — a logical invalidation area.
5. Overall Bias
Bullish, with expectation of:
Retest → Higher-low → Move toward major liquidity at previous highs

XAUUSD Breakout Retest – Bearish Continuation SetupChart Analysis (XAUUSD)
Here’s a clear breakdown of what the chart shows and what the setup implies:
1. Market Structure
Price previously made a strong push upward, then entered a sideways consolidation zone (highlighted in yellow).
This zone represents accumulation/distribution, where buyers and sellers balanced out before a breakout.
2. Breakout & Retest
Price broke down below the consolidation zone, indicating bearish intent.
After the drop, price is currently doing a retest of the breakout level (where the red horizontal line sits at around 4191.953).
This retest commonly acts as a point where sellers look to re-enter.
3. Trade Setup
A sell position is plotted from the retest area.
The shaded region above represents stop-loss territory.
The two blue arrows mark:
Half Take-Profit (TP 50%) — a mid-level target for partial exit
Full Target — deeper downward continuation expectation
4. Bias
The structure, breakout, and retest all favor a bearish continuation as long as price stays below the retest zone.
The chart suggests a momentum continuation to the downside, targeting the lower green line.
5. Risk Considerations
If price closes back above the red line, the setup becomes invalid.
Consolidation after the breakdown shows indecision — strong bearish confirmation may come only after a clean push down.
