Gold Price Awaits FOMC – Liquidity Levels in PlayGold price continued to slide into liquidity zones during the late US session yesterday and reacted perfectly at the MMFLOW BUY ZONE 3314 – 3316, delivering over +70 pips profit to traders ✅.
At present, on M5–M15, Gold is showing signs of a short-term recovery. However, for a strong upside move, buyers must break through the 3320 – 3322 resistance zone. A confirmed breakout here could trigger momentum towards higher KeyLevels, allowing price to retest important supply zones.
📈 Upside Targets (Intraday): 333x and 334x remain the key areas to watch for take-profits or potential reversal setups.
🔔 Why This Week Matters – The FOMC Decision
The highlight of the week is the FOMC meeting during the US session. Markets are awaiting clarity on the Fed’s next move. Any hint towards a September rate cut could trigger massive bullish momentum, breaking Gold out of its corrective channel.
👉 Asian & European sessions: Focus remains bullish toward 333x – 334x, with potential SELL setups at resistance.
⚠️ US session with FOMC: Expect extreme volatility – risk management is critical.
📉 MMFLOW Technical Trading Plan
🔹 BUY Scalp Setup
Entry: 3311 – 3309
SL: 3305
TP: 3315 → 3320 → 3325 → 3330 → 3340 → 3350 → 3360+
🔹 BUY Zone (FOMC Plan)
Entry: 3290 – 3288
SL: 3282
TP: 3295 → 3330 → 3335 → 3340 → 3350 → 3360 → 3370+
🔸 SELL Scalp Setup
Entry: 3342 – 3344
SL: 3348
TP: 3338 → 3332 → 3328 → 3324 → 3320
🔸 SELL Zone (FOMC Plan)
Entry: 3360 – 3362
SL: 3368
TP: 3355 → 3350 → 3345 → 3340 → 3330
⚠️ Key Notes for Indian Traders
FOMC = high volatility event – manage your exposure carefully.
Stick to strict TP/SL discipline to protect capital.
Smart traders know: KeyLevels = Profits ✅
🔥 Follow MMFLOW TRADING for daily Gold price analysis, liquidity maps, and Smart Money insights – designed for Forex & Gold traders in India.
Xauusdbuy

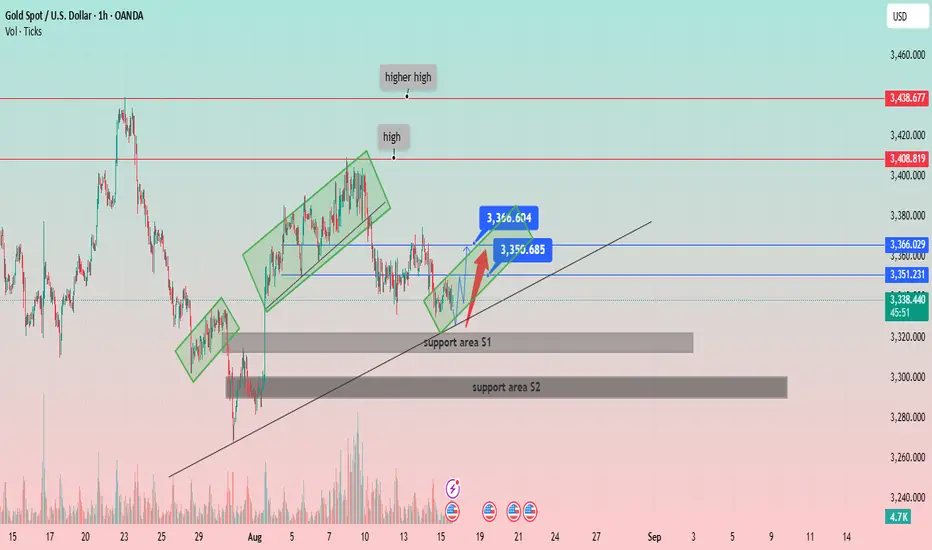
XAU/USD: Navigating the Uptrend and Key Support LevelsPrice Structure: Gold has been forming a series of higher highs and higher lows, indicative of a general uptrend. The chart labels a "high" and a "higher high," confirming this bullish structure.
Support and Resistance:
Two key support areas are identified:
Support area S1: A narrow zone around 3,320 USD. The price recently bounced off this area.
Support area S2: A broader, more significant zone around 3,290 USD, which appears to have been a strong support level in the past.
Several horizontal resistance levels are marked:
Immediate resistance: Around 3,351.231 USD and 3,366.029 USD.
Higher resistance: At 3,408.819 USD and 3,438.677 USD.
Channels and Trendlines:
The price has been moving within a series of ascending channels (highlighted in green rectangles), suggesting a stair-step upward movement.
A primary ascending trendline (black line) serves as a long-term support, with the price currently hovering just above it.
Recent Price Action and Projections:
The price recently broke out of a small downtrend and is showing signs of recovery from the "support area S1."
A potential price path is drawn with a red arrow, indicating a possible move towards the immediate resistance levels around 3,351 USD and 3,366 USD.
The chart highlights two specific price points, 3,360.604 USD and 3,350.685 USD, which likely represent a short-term trading range or target.
Volume: The volume spikes visible at key price points (e.g., at the low on July 30 and during the recent drop) indicate strong market activity.
XAUUSD Bullish Trend Continuation: Potential Move to $3,400!The price action shows a higher high ("high") and a higher low ("low"), which are characteristic of an uptrend. An upward trendline has been established, connecting a series of higher lows, which is acting as a dynamic support level. A significant horizontal support zone has also been identified around the $3,260 - $3,280 price range, where the price previously found support.
Recently, the price experienced a pullback and bounced off the upward trendline. The analysis anticipates a continuation of the upward momentum toward a key resistance zone. This resistance zone is located around the $3,400 - $3,420 level. A specific target price of $3,408.833 is highlighted within this zone, suggesting a potential area where the upward movement might pause or reverse.
The chart includes a potential corrective wave pattern labeled with "C"s, indicating a recent three-wave pullback within the larger trend. The current price is shown at $3,353.520, positioned above both the horizontal support and the upward trendline, reinforcing the bullish sentiment.

XAU/USD Bullish Bounce from Demand Zone !Gold (XAU/USD) on the 4H chart is showing a potential bullish reversal setup. Price has pulled back into a Fair Value Gap (FVG) and high supply/demand zone near 3,329–3,315, aligning with the 0.382–0.5 Fibonacci retracement.
Key Points:
Support Zone: 3,329–3,315 (demand + FVG).
Bullish Rejection Expected: Price may bounce from this zone, targeting upper resistance levels.
Upside Targets:
TP1: 3,356
TP2: 3,375
TP3: 3,440–3,459 (major resistance)
Invalidation: A daily close below 3,315 could open room for deeper downside toward 3,278–3,245.
Indicators: EMA(9) and Ichimoku showing potential for trend resumption if price closes above 3,362.
Overall, the chart suggests a buy setup on bullish confirmation, aiming for the 3,375–3,459 zone.

Buy Gold 3385OMG 😳 Yesterday All Target hit 🎯🤟
Nect buy now 3378,3380,3383,3385
Target 🎯 3390,3392,3399,3405,3420
So please don't sell gold
Only Buy side Active

07/08/2025 XAUUSD GOLD ANALYSIS Hello xauusd gold analysis price given a good move in morning (Asian session) opening now price taking resistance to 3384 level my view now if price comes 3370 and making bullish candles we plan for buy no selling plan till price break 3360 level

maintain uptrend, buy gold 3350Plan XAU day: 04 August 2025
Related Information:!!!
Gold prices (XAU/USD) retain a subdued tone during the first half of the European session on Monday, although the absence of sustained selling pressure keeps the metal within reach of the one-week high recorded earlier in the day. The US Dollar (USD) begins the new week with a modest recovery, partially retracing Friday’s decline triggered by softer-than-expected US employment data, supported in part by a rebound in US Treasury yields. This recovery exerts downward pressure on demand for the precious metal.
Nevertheless, the USD's upside remains limited amid increasing expectations that the Federal Reserve (Fed) will resume interest rate cuts as early as September. This anticipation continues to provide support for the non-yielding yellow metal. In addition, a broadly cautious market mood—driven by persistent trade uncertainties and heightened geopolitical tensions—reinforces the appeal of Gold as a safe-haven asset and advises restraint among bearish market participants
personal opinion:!!!
Accumulated price zone around 3350 - 3364, buying power maintained. Gold buying point following the uptrend line today
Important price zone to consider : !!!
Support zone point: 3350 zone
Sustainable trading to beat the market

Breaking 3322, gold price continues to recoverPlan XAU day: 29 July 2025
Related Information:!!!
Gold prices (XAU/USD) advance to a new intraday high during the first half of the European session on Tuesday, recovering from the nearly three-week low around the $3,300 level reached the previous day. As market participants absorb the latest wave of trade-related optimism, lingering uncertainty ahead of this week’s key central bank events and high-impact US macroeconomic releases continues to lend support to the safe-haven precious metal.
At the same time, the US Dollar (USD) has eased slightly from its highest level since June 23, providing an additional tailwind for gold. Nonetheless, the increasingly widespread expectation that the Federal Reserve (Fed) will maintain elevated interest rates for an extended period is likely to limit any significant USD correction. Consequently, this may act as a headwind for the XAU/USD pair as attention turns to the highly anticipated FOMC meeting set to commence later today.
personal opinion:!!!
Gold price recovered, broke 3322. Good buying power, continued to recover and accumulate above 3300
Important price zone to consider : !!!
Support zone point: 3322, 3302 zone
Sustainable trading to beat the market

Gold price increased, broke 3360Plan XAU day: 21 July 2025
Related Information:!!!
Gold prices (XAU/USD) are extending their upward momentum for the second consecutive session on Monday, as buyers remain cautiously optimistic and await a decisive breakout above a multi-week trading range before committing to further gains. The US Dollar (USD) begins the new week on a softer footing amid mixed signals regarding the Federal Reserve’s (Fed) interest rate outlook—an important factor currently supporting the precious metal.
Additionally, persistent concerns over the potential economic consequences of former President Donald Trump’s unpredictable trade policies are bolstering gold’s appeal as a safe-haven asset.
personal opinion:!!!
Short term H1 frame, gold price breaks 3360 forming bullish structure. Uptrend continues to maintain
Important price zone to consider : !!!
resistance zone point: 3377 zone
Sustainable trading to beat the market

Elliott Wave Analysis – XAUUSD | July 14, 2025
🔍 Momentum Analysis
D1 Timeframe: Momentum is currently reversing to the upside, indicating that the bullish trend may continue into early next week (Monday).
H4 Timeframe: Momentum has entered the overbought zone, suggesting that a short-term correction is likely to bring momentum back down into oversold territory.
🌀 Elliott Wave Structure
On the H4 chart, we observe a contracting triangle pattern (abcde) approaching its final stages.
In the Friday trading plan, we anticipated that the corrective phase had ended and price was entering a new impulsive wave. However, there are two irregularities worth noting:
A pin bar candle with high volume has appeared at the resistance zone near 3365, while H4 momentum is overbought. This signals a likely short-term correction — something that ideally should not happen if price is already in wave 3. Ideally, price should have surged to 3402 on Friday to strengthen the bullish case.
On the H1 chart, bullish candles are small and overlapping, reflecting weak bullish momentum and a lack of conviction from buyers.
These two signs suggest that the market may still be within the correction phase, and the 3402 level will serve as a key confirmation zone to determine whether the correction has truly ended.
💡 Trading Outlook
The bullish momentum on the D1 chart still supports BUY positions for the coming week.
However, since the H4 chart is overbought, a short-term pullback is likely.
We will look to buy on dips toward lower support zones, targeting a move toward 3393 – 3402, which remains the target area as outlined in Friday’s plan with the original entry at 3332 – 3330.
📊 Trading Plan
BUY Zone: 3342 – 3340
Stop Loss (SL): 3330
Take Profit 1 (TP1): 3370
Take Profit 2 (TP2): 3393

price increase, gold price towards 3385Plan XAU day: 14 July 2025
Related Information:!!!
An already fragile global risk sentiment has deteriorated further in response to renewed tariff threats from US President Donald Trump targeting two of the country’s major trade partners—Mexico and the European Union. In separate letters sent on Saturday to European Commission President Ursula von der Leyen and Mexican President Claudia Sheinbaum, President Trump announced the potential for new tariffs, adding to more than 20 similar notices issued since last Monday.
This latest development has dampened investor appetite for riskier assets, as reflected in the broadly weaker tone across global equity markets, and may continue to provide support for safe-haven assets such as gold. However, mixed signals regarding the Federal Reserve’s near-term interest rate trajectory are preventing XAU/USD bulls from making aggressive moves or extending the recent rally to multi-week highs
personal opinion:!!!
Trade tensions between two major regions: the US and the EU, have made gold prices positive again, and market concerns that DXY and EURO will restrain each other's value.
Important price zone to consider : !!!
resistance zone point: 3385 zone
Sustainable trading to beat the market

Gold Price Setup: Bullish Continuation or Rejection? 🧠 Chart Analysis (XAU/USD – 1H):
Key Structure Highlights:
CHoCH (Change of Character) zones marked both up and down indicate a battle between bulls and bears.
Recent bullish CHoCH followed by a fair value gap (FVG) retest suggests potential continuation to the upside.
Price recently bounced strongly from demand zone, shown by the green arrows and strong candle reaction.
Ichimoku Cloud:
Price is trying to break back above the Kumo (cloud), a sign of bullish momentum building.
However, resistance is still present with the Kijun and Tenkan lines converging.
FVG (Fair Value Gap):
The current price is attempting to fill and break above the FVG zone.
A successful breakout above this area confirms bullish intention.
Fibonacci Levels:
Price is hovering around the 0.5 - 0.618 retracement zone, often a strong reversal or continuation point.
Upside targets lie near the 0.786 retracement (3352) and ultimate target at 3391, a major resistance level.
Risk Management:
Trade setup shows an excellent Risk:Reward ratio.
Stop-loss placed just below the last structure low.
Potential downside to 3290–3258 if breakout fails.
🟢 Possible Next Move:
Bullish Scenario: If price clears the FVG and breaks above 3353, expect continuation to 3391.
Bearish Rejection: If rejected at FVG/0.618 level, watch for a drop back to 3290 or even 3259.

NF news and gold buying pressurePlan XAU day: 03 July 2025
Related Information:!!!
Gold prices (XAU/USD) are struggling to build on a modest intraday rebound from the $3,340 area, holding relatively steady near the upper boundary of the weekly range during the first half of the European session. Market participants appear cautious, opting to await the release of the US Nonfarm Payrolls (NFP) report for further clarity on the Federal Reserve’s (Fed) potential rate-cut trajectory. This data is expected to play a pivotal role in shaping near-term demand for the US Dollar (USD) and could provide significant directional impetus for the non-yielding yellow metal.
personal opinion:!!!
Weak DXY is still the driving force for gold price to increase and recover around 3400, along with NF news not very positive for USD
Important price zone to consider : !!!
SELL point: 3395 zone
Sustainable trading to beat the market

Policy instability, DXY falls sharply, gold recoversPlan XAU day: 01 July 2025
Related Information:!!!
Gold Demand in China Expected to Rise Further
"In the first quarter of the year, China recorded a net export of 36 tons of gold to Hong Kong, reflecting a growing domestic demand for gold despite elevated prices. The uncertainty surrounding U.S. tariff policy has likely been a significant contributing factor. As a result, gold has seen increased appeal among Chinese investors as both an investment asset and a safe-haven store of value. In contrast, demand for gold jewellery likely remained subdued due to persistently high prices."
"China aims to expand its exploitable gold reserves by 5 to 10 percent by 2027, potentially in response to rising domestic demand, according to a statement from the Ministry of Industry and Information Technology released early last week. The country also plans to boost gold production by more than 5 percent over the next two years. While China is already the world’s largest gold producer, it continues to rely on imports to satisfy internal demand.
personal opinion:!!!
Trump administration's policy instability caused the dollar to lose value and gold to fall sharply. Gold is on the way to recovery, returning to the price range of 3366.
Important price zone to consider : !!!
SELL point: 3366 zone
Sustainable trading to beat the market

Double Top Breakdown at Resistance ZoneThe chart reveals a classic Double Top pattern formation near the 3,360–3,480 resistance zone, followed by a clear bearish rejection (highlighted with red arrows). This confirms the presence of strong supply pressure in that region.
🔍 Key Technical Highlights:
🔺 Double Top Pattern
The price formed two swing highs near the resistance zone, failing to break above.
After the second peak, the price started declining, confirming the reversal pattern.
📉 Bearish Channel
The recent downtrend is contained within a descending channel, with consistent lower highs and lower lows.
Price broke below the neckline of the double top pattern around 3,270.
🎯 Target Projection
Based on the height of the double top pattern, the projected downside target is near 3,207.5, aligning perfectly with the support zone marked below.
🟠 Historical Support Areas
The large orange circles indicate key reaction points, confirming that the 3,207–3,220 area has acted as support in the past.
📊 Outlook:
If the current bearish momentum continues, price is likely to head towards the support target zone at 3,207.5. Any pullback toward 3,320–3,350 could provide a shorting opportunity with stops above the recent highs.
🔧 Bias: Bearish
📍 Resistance: 3,360–3,480
📍 Support: 3,207–3,220
📍 Target: 3,207.5

XAUUSD! LongHey traders! I'm currently looking for a bullish setup. The market structure is still showing strong bullish signs, so I'm not looking to short at this point. I'm targeting a 1:2 risk-to-reward trade—let's see how it plays out! Staying patient and letting the setup come to me. Let’s go!

Bears up 3366 , waiting for GDP ! XAUUSDPlan XAU day: 26 June 2025
Related Information:!!!
Gold price (XAU/USD) attracts some buyers for the second consecutive day on Thursday and maintains its positive momentum during the first half of the European session. The US Dollar (USD) continues to face strong selling pressure amid reports that US President Donald Trump is considering replacing Federal Reserve (Fed) Chair Jerome Powell, raising concerns about the central bank’s future independence. Additionally, growing expectations that the Fed may resume its rate-cutting cycle as early as July have pushed the USD to a more than three-year low, which supports demand for the non-yielding yellow metal.
personal opinion:!!!
European session buying pressure helped gold price successfully break 3340, continuing the upward trend 3366
Important price zone to consider : !!!
SELL point: 3367 zone
Sustainable trading to beat the market
Gold price short growth: price zone 3345Plan XAU day: 25 June 2025
Related Information:!!!
US President Donald Trump criticized both Israel and Iran for violating a full ceasefire agreement shortly after it was announced. Moreover, media reports indicated that the recent US airstrikes on Iran’s nuclear facilities likely did not destroy the core components but only delayed Tehran’s program by a few months. Trump, however, reiterated that Iran’s nuclear sites were completely destroyed.
Nonetheless, the ceasefire between Israel and Iran appears to be holding for now, with both sides declaring victory in the conflict and warning that they are prepared to resume hostilities if attacked. This keeps the geopolitical risk premium in play and is likely to continue supporting the safe-haven appeal of Gold ahead of key US macroeconomic data releases later in the week.
personal opinion:!!!
Accumulation price zone: 3300 - 3335 is being maintained in the Asian and European sessions. Pay attention to selling pressure in the liquidity zone 3345.
Important price zone to consider : !!!
SELL point: 3345; 3367 zone
Sustainable trading to beat the market

tXAU/USD Bullish Reversal from Key SupportXAU/USD Bullish Reversal from Key Suppor 📈🟢
📊 Chart Analysis:
Rounded Bottom Structure ⬆️
The price has formed a rounded bottom pattern, indicating potential trend reversal from bearish to bullish.
Multiple bounces (🟠 circles) from the curved support trendline confirm the validity of this structure.
Support Zone Rejection ✅
Price recently rejected from a major horizontal support zone (around 3,303.796 USD) with a strong bullish wick.
This zone has acted as a springboard for prior upward moves.
Falling Wedge Breakout 💥
A falling wedge (bullish pattern) has formed and is breaking to the upside.
Breakout confirmation is underway, indicating momentum shift.
Target Projection 🎯
The projected move from the breakout suggests a potential target at 3,385.820 USD.
This aligns with previous resistance areas.
Key Levels to Watch:
Resistance: 3,385.820 USD (target) and 3,425–3,450 USD (major resistance zone)
Support: 3,303.796 USD (short-term), followed by 3,225–3,250 USD zone
🔔 Conclusion:
Price action suggests a bullish bias with a possible upward continuation if it sustains above the wedge breakout.
Confirmation above 3,330 USD with volume can fuel a rally toward the 3,385–3,400 USD target zone.
📌 Risk Management Tip: Watch for fakeouts near wedge resistance or a re-test of 3,303 USD for better entries.

XAU/USD Bearish Pattern Analysis XAU/USD Bearish Pattern Analysis 📉
The chart presents a potential bearish continuation setup in the XAU/USD pair, highlighted by technical structures and key price levels:
📊 Technical Breakdown:
🔸 Bearish Rejection from Resistance
Price rejected strongly from the 3,440.000 resistance zone, marked with a red arrow.
This area has acted as a historical supply zone, triggering repeated reversals.
🔸 Descending Channel Formation 📉
A clear bearish flag/channel structure is visible post-rejection.
Price action broke down from the channel, signaling potential trend continuation.
🔸 Target Level 🎯
The expected target is around 3,304.374, aligning with previous support zones and structure lows.
This level coincides with a measured move from the channel breakdown.
🔸 Higher Lows Pattern Before Reversal ⭕
Prior to the current decline, the market formed a series of higher lows, highlighted with orange circles — suggesting a buildup before reversal.
🧭 Key Levels to Watch:
Resistance: 3,440.000 – 3,420.000 🔼
Current Price: 3,368.750
Short-Term Target: 3,304.374 🎯
Major Support: 3,140.000 – 3,160.000 🛡️
📌 Outlook:
The rejection from resistance coupled with the descending channel breakdown indicates bearish momentum. If the market maintains below the recent high, further downside towards 3,304 is expected. Break below this may expose deeper support zones.
📉 Bias: Bearish
⏳ Short-term Action: Watch for breakdown confirmation and momentum continuation.
📉
The chart presents a potential bearish continuation setup in the XAU/USD pair, highlighted by technical structures and key price levels:
📊 Technical Breakdown:
🔸 Bearish Rejection from Resistance
Price rejected strongly from the 3,440.000 resistance zone, marked with a red arrow.
This area has acted as a historical supply zone, triggering repeated reversals.
🔸 Descending Channel Formation 📉
A clear bearish flag/channel structure is visible post-rejection.
Price action broke down from the channel, signaling potential trend continuation.
🔸 Target Level 🎯
The expected target is around 3,304.374, aligning with previous support zones and structure lows.
This level coincides with a measured move from the channel breakdown.
🔸 Higher Lows Pattern Before Reversal ⭕
Prior to the current decline, the market formed a series of higher lows, highlighted with orange circles — suggesting a buildup before reversal.
🧭 Key Levels to Watch:
Resistance: 3,440.000 – 3,420.000 🔼
Current Price: 3,368.750
Short-Term Target: 3,304.374 🎯
Major Support: 3,140.000 – 3,160.000 🛡️
📌 Outlook:
The rejection from resistance coupled with the descending channel breakdown indicates bearish momentum. If the market maintains below the recent high, further downside towards 3,304 is expected. Break below this may expose deeper support zones.
📉 Bias: Bearish
⏳ Short-term Action: Watch for breakdown confirmation and momentum continuation.

BUY 3375 , sideway H1, gold price accumulatesPlan XAU day: 18 June 2025
Related Information:!!!
Heading into the key central bank event risk, the disappointing US macro data released on Tuesday pointed to a softening economy and reaffirmed bets that the Fed will lower borrowing costs in September. This keeps a lid on the overnight US Dollar rally to the weekly peak.
The US Census Bureau reported that Retail Sales declined by 0.9% in May, compared to a 0.7% contraction expected and a 0.1% dip in April. Moreover, US Industrial Production fell short of estimates and contracted by 0.2% in May, following a revised 0.1% increase the previous month
personal opinion:!!!
sideways fluctuation in the price range of 3370 - 3395, gold price waiting for the result of keeping interest rates unchanged and continuing to accumulate around 3400
Important price zone to consider : !!!
Buy point: 3375 , 3338
Sustainable trading to beat the market
GOLD (XAU/USD) 4H CHART – BULLISH BREAKOUT TRADE SETUP🔵 Trendline Breakout 📈
📏 Price broke above a descending trendline, signaling a potential bullish reversal.
🔼 This breakout is often seen as a buy signal by traders.
🧱 Resistance Area 🛑
🔹 Price has entered and broken through a horizontal resistance zone.
🔄 This zone may now flip into support, adding confidence to the long setup.
🟧 Demand Zone 📦
📍 Marked between 3,267 – 3,298.
🛡️ Strong buying interest historically observed in this area.
📉 EMA (70) at 3,298.065 acts as dynamic support.
🟦 Entry Point 🚪
🎯 Entry Level: 3,322.930
🔄 Enter after retest confirmation or bullish candle above resistance.
🔴 Stop Loss ⛔
⚠️ SL Level: 3,267.993
💣 Below the demand zone and EMA — protecting against false breakouts.
🟩 Target Point 🎯
🚀 TP Level: 3,490.000
📌 Prior high zone — strong historical resistance expected here.
💰 Trade Setup Summary
✅ Buy Above: 3,322.930
❌ Stop Loss: 3,267.993
🎯 Target: 3,490.000
📊 Risk/Reward Ratio: Favorable (approx. 1:3)
🔎 Technical Confidence Levels
🔵 EMA Support ✅
🔵 Trendline Breakout ✅
🔵 Resistance Flip ✅
🔴 False Breakout Risk

XAU/USD Price Action Analysis – June 12, 2025 XAU/USD Price Action Analysis – June 12, 2025 🪙📈
📊 Technical Overview:
The chart presents a clear range-bound market structure with well-defined zones of support and resistance:
📍 Key Levels:
🔴 Resistance Zone: $3,380 – $3,400
Price has been rejected multiple times from this level, as indicated by red arrows. It marks a strong supply zone.
🟢 Support Zone: $3,280 – $3,300
Price has bounced several times from this demand area, forming a reliable support base.
📏 Intermediate Level: $3,319.38
Marked with a purple line, this is likely a mid-range liquidity zone or a previous minor structure level.
🔄 Price Action Insights:
Double Bottom Formation: Notable at the support zone, confirming strong buying interest (highlighted with orange circles and green arrows). This pattern often signals a bullish reversal.
Current Price: Trading near $3,375.645, approaching the resistance area again.
Projected Scenarios:
Bullish Continuation 📈: Break and close above the resistance could trigger momentum to the upside — watch for a breakout with strong volume.
Pullback Scenario 🔁: A rejection from resistance could cause a retest of $3,319.38 or even the support zone, forming a higher low before a potential rally.
🧠 Strategy Outlook:
Bullish Bias 🐂 as long as price holds above $3,319.38.
Watch for Breakout 🚀 above resistance with volume confirmation for long entries.
Caution ⚠️ near resistance; ideal to wait for either a breakout or clear rejection.
📌 Conclusion:
The chart reflects accumulation within a range, with bullish structure emerging. A break above $3,400 could shift market sentiment decisively upward, while a failure at resistance invites a deeper pullback.
