Gold on it’s target - Next Move BullishOur yesterday analysis went TRUE . As expected after reaching high gold came down for correction. As you all know today there is PMI news today, so market will come down and after that take upward momentum. So do wait for it and after that execute the trade.
Key point.
Support - 3348, 3335, 3329
Resistance - 3354, 3362, 3371
Any Query Reach Us or comment down
Rudra Vasaikar Wishes You A Great And Very Amazing Trading Life. Trade Safe, Trade Right.
RISK WARNING 🔴 🔴 🔴
There is high risk of loss in Trading Forex, Crypto, Indices, CFDs, Features and Stocks. Choose your trade wisely and confidently, please see if such trading is appropriate for you or not. Past performance is not indicative of future results. Highly recommended - Information provided by Pro Trading Point are for Educational purpose only. Do your investment according to your own risk. Any type of loss is not our responsibility.
HAPPY TRADING.
#gold #xauusd #xauusdtrading #goldtrading #goldanalysis #forextrading #forex #trendline #goldsignals #goldnews goldlatestanalysis #xauusdtradesetup #forextradingguide #fxgold
Xauusdbuy

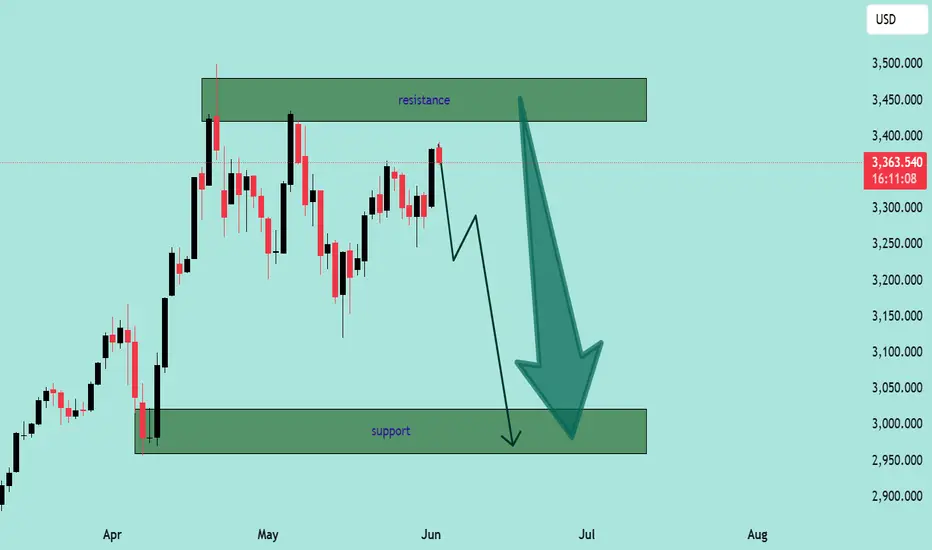
XAU/USD Bearish Rejection at Resistance – Potential Drop Ahead!XAU/USD Bearish Rejection at Resistance – Potential Drop Ahead! 💥
🔍 Technical Analysis:
Instrument: Gold vs US Dollar (XAU/USD)
Timeframe: Daily
Current Price: $3,363.26
Resistance Zone: $3,380 – $3,470
Support Zone: $2,970 – $3,100
🧠 Market Context:
Gold has recently approached a well-defined resistance zone near the $3,380–$3,470 range. Price action shows multiple rejection wicks and failed attempts to break above this level, indicating strong selling pressure from bears. 🐻
The current candlestick structure suggests the market is printing lower highs, which may indicate a transition from a consolidation phase into a potential bearish trend.
📉 Projection:
The chart projects a move down toward the support zone, around $2,970–$3,100, possibly due to:
Repeated rejections at the resistance zone 🔄
Lack of bullish momentum near highs ⚠️
Bearish engulfing or reversal candlestick formations 🔻
✅ Key Levels to Watch:
Level Type Price Zone Action
🔴 Resistance $3,380 – $3,470 Strong rejection expected
🟢 Support $2,970 – $3,100 Major demand zone; potential bounce
🧭 Trading Outlook:
⚠️ If price fails to break above the resistance zone, short opportunities may develop with a target near the support zone. A confirmed break and close below $3,300 would strengthen bearish sentiment.
📌 Bearish Bias Maintained Until Resistance Breaks
XAU/USD Price Action Analysis – Bullish Breakout Setup XAU/USD Price Action Analysis – Bullish Breakout Setup 🚀
🔍 Chart Overview:
This chart illustrates the price movement of XAU/USD (Gold vs USD) on a mid-term time frame, highlighting a potential bullish breakout scenario from a key resistance zone.
🟩 Key Levels:
Support Zone: 🛡️
➤ $3,140 – $3,200
This zone has acted as a strong support multiple times, preventing further declines and serving as a springboard for bullish moves.
Breakout Zone (Current Level): ⚡
➤ $3,340 – $3,390
Price is currently testing this crucial resistance-turned-potential-breakout zone. A successful close above this level could confirm bullish continuation.
First Target: 🎯
➤ $3,435.87
This intermediate resistance aligns with a previously tested high. It may act as the first barrier after the breakout.
Second Target: 🥇
➤ $3,502.13
This is the major resistance zone. If bulls maintain momentum, this area will likely be tested.
🧭 Market Structure & Bias:
Price is forming higher lows, signaling growing bullish strength.
The chart shows a bullish breakout of a sideways consolidation zone.
The upward arrows and curved projection suggest a potential pullback-retest scenario at the breakout level before rallying towards targets.
🧠 Trading Plan (Illustrated by Chart):
📈 Breakout Entry:
Wait for confirmation above $3,390 with strong bullish candles and volume.
🔁 Retest Opportunity:
If price pulls back to the breakout zone ($3,340 – $3,390), this may serve as a solid re-entry point for long positions.
🎯 Profit Targets:
TP1: $3,435
TP2: $3,502
🛑 Invalidation:
A strong close back below $3,320 may invalidate the bullish bias.
📌 Conclusion:
The chart indicates a bullish continuation setup for XAU/USD with clearly defined breakout, retest, and target zones. Traders should monitor price action closely around the breakout area for confirmation before entering long positions. Risk management remains key. 🧮⚖️

Gold (XAU/USD) – Inverse Head & Shoulders Breakout Setup🧠 Chart Pattern Identified: Inverse Head & Shoulders
🟡 Left Shoulder ➡️ Formed at a local dip.
⚫ Head ⬇️ Deepest low around 3,274.103.
🟡 Right Shoulder ➡️ Bouncing near the same zone.
🔁 This is a classic bullish reversal pattern — a break above the neckline could signal a strong upside move.
📊 Key Levels & Zones
🔵 Support Zone:
🟦 Area: 3,274 – 3,294
✅ Strong bounce seen here (highlighted by the head and shoulders base)
🔵 Resistance Zone:
📏 Just below 3,305 (marked as neckline)
✋ Price must break this to confirm the reversal
🔵 Target Point:
🎯 3360 📈
📏 Based on the height from head to neckline
🔵 Stop Loss Zone:
❌ 3,274.526
🔻 Below the head for safe risk control
⚙️ Trading Setup Summary
🔹 📍 Entry Point:
📌 Around 3,294.449
🚪 Enter on breakout above neckline
🔹 🎯 Target Point:
🏁 3360
🔹 🛑 Stop Loss:
🚫 3,274.526
🔹 Risk-Reward Setup:
🔍 Targeting a move of ~65 points
⚖️ Risk of ~20 points → solid R/R ratio
📈 Indicator:
🧮 EMA 70 ➡️ 3,305.005
⏳ Price currently testing it — a break above EMA would boost bullish confirmation.
📅 Economic Events:
📆 Multiple event icons suggest upcoming news — expect volatility!
⚠️ Be cautious during these times.
✅ Final Thoughts:
📊 Pattern suggests a bullish breakout is near 🚀
🔒 Use stop-loss and enter after breakout to manage risk effectively
🎯 Keep an eye on volume during breakout — it confirms strength

XAUUSD/GOLD SELL PROJECTION 30.05.25The red zone above the entry point marks the risk (stop loss), while the larger green zone below indicates the potential reward (profit targets TP1 and TP2), implying a favorable risk-to-reward ratio.
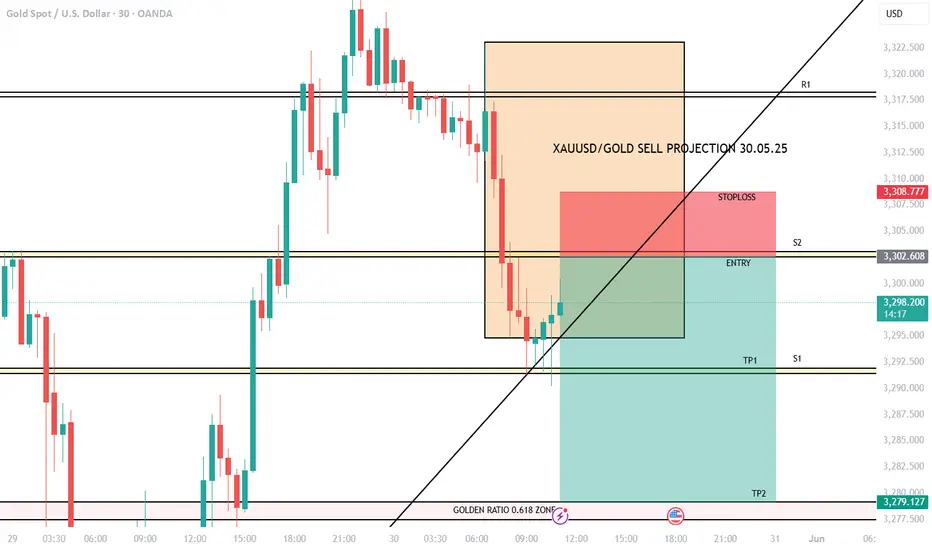
XAUUSD/GOLD SELL PROJECTION 29.05.25R1 (Resistance): Just above entry, marking the recent high.
S1 & S2 (Support levels): Intermediate levels where price might pause or bounce.
Low Zone: Aligns with TP2, marking a significant potential support zone.

XAUUSD/GOLD 4H BUY PROJECTION 25.05.25🟢 Overall Bias: BUY Projection
The chart suggests a bullish outlook, predicting that gold will rise significantly after a breakout and retest pattern.
🔍 Key Technical Elements:
Trendlines:
4H Downtrendline: This was a significant resistance trendline that has now been broken.
4H Uptrendline: Indicates a recent shift to bullish momentum.
Support & Resistance Zones:
Support S1: A solid demand zone around 3,275–3,300 USD.
Immediate Support: Zone around 3,325 USD.
Resistance R1, R2, and R3: Key resistance levels.
R1: ~3,375 USD
R2: ~3,425 USD
R3 & ATH (All-Time High): ~3,500+ USD
Breakout Confirmation:
The price broke above the 4H Downtrendline and Resistance, and then retested that area successfully, confirming it as new support (highlighted by the box labeled "BREAKER RESISTANCE RETESTED AND BROKE TRENDLINE").
Change of Character:
Marked in the zone labeled "CHANGE OF CHARACTER APPEARED HERE", indicating a shift from bearish to bullish market structure.
📈 Price Projection:
The price is projected to move upwards through multiple resistance zones, eventually targeting the 3,500 USD+ region.
Arrows indicate a bullish path with minor pullbacks, moving towards:
Resistance R1 → Resistance R2 → Resistance R3 (ATH).
🟥🟩 Risk Management:
Stop-Loss Zone (Red Area): Below 3,300 USD – in case the breakout fails and the price re-enters the downtrend.
Target Zone (Green Area): Extends to 3,500+ USD – aligning with historical highs.

XAUUSD/GOLD 30 MIN SELL PROJECTION 20.05.25The price is expected to rise into the entry zone.
If the setup holds, it should reject from this resistance and fall toward TP1.
A deeper push would target TP2, with the golden ratio zone acting as a potential reaction area.

XAUUSD/GOLD 15 MIN BUY PROJECTION 19.05.25Entry Zone: Around 3,216.325
Breakout + Retest Zone: Around 3,212.500
Stoploss: Just below 3,210.000 (specifically marked at 3,209.969)
TP1 (Take Profit 1): Around 3,230.000

XAUUSD/GOLD BUY PROJECTION 19.05.25Entry Point: Around 3,216 (marked as "ENTRY + SUPPORT 2")
Stop Loss: Just below 3,191.916
Take Profit Levels:
TP1 (R1): ~3,260
TP2 (R2): ~3,285
TP3 (R3): ~3,340
TP4 (R4): ~3,383.921

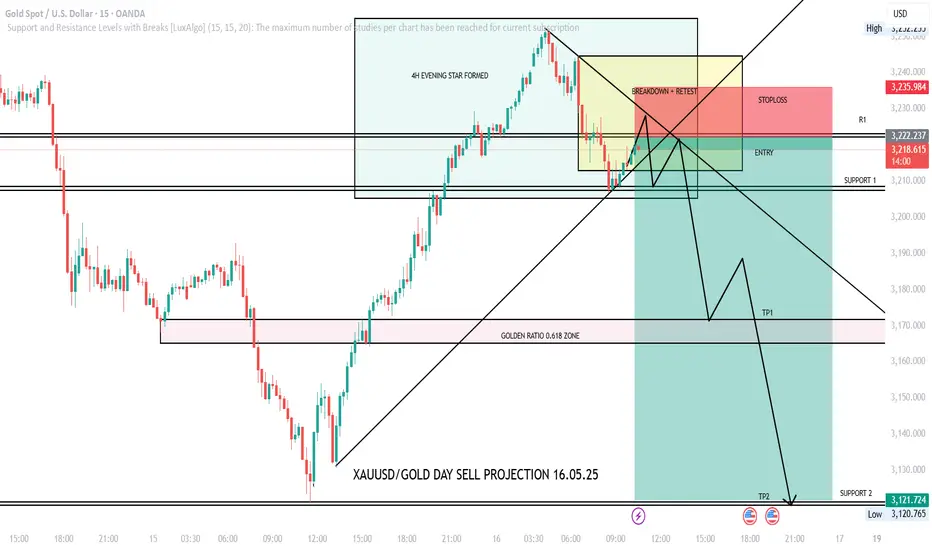
XAUUSD/GOLD DAY SELL PROJECTION 16.05.25📉 Sell Setup Overview:
Pattern Identified:
4H Evening Star — a bearish reversal pattern indicating potential downside.
Trade Setup:
Entry Zone: Around 3,219.970
Stop Loss: Above 3,235.984
Targets:
TP1 (Take Profit 1): Around 3,170.000 (Golden Ratio 0.618 zone)
TP2: Around 3,121.724 (near Support 2)
Technical Zones:
Breakdown + Retest zone highlighted in yellow (indicating confirmation of bearish reversal).
Golden Ratio (0.618) support/fib zone — used as a significant level for TP1.
Support 1 and Support 2 are drawn as potential price stalling or reversal zones.
XAUUSD/GOLD WEEKLY SELL PROJECTION 10.05.25From easing tariffs to strong labor data, multiple factors are shaping gold's short-term corrections. Gold prices fall as US jobs data beats expectations and trade talks ease global tension. Spot gold slips from record highs amid China's holiday, but long-term support remains strong

XAUUSD/GOLD WEEKLY SELL PROJECTION 04.05.25Leaving technical factors aside, in layman's view, gold is falling because investors have realized the high valuation of gold compared to other precious metals and are booking profits.1 day ago
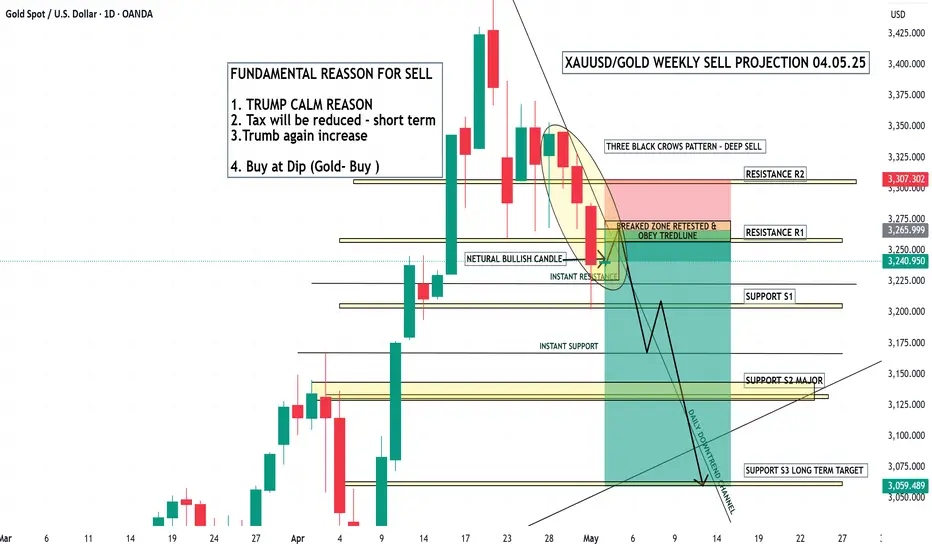
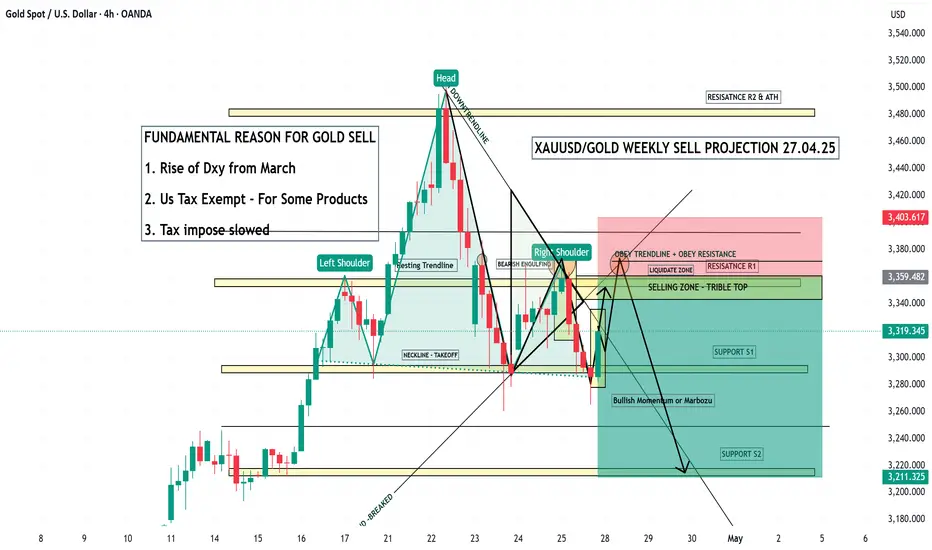
XAUUSD/GOLD WEEKLY PROJECTION 27.04.25Rise of the DXY (US Dollar Index) since March.
US Tax exemptions for some products.
Slower imposition of new taxes.
Technical Chart Summary:
Pattern: Head and Shoulders (classic bearish reversal setup).
Key Zones:
Selling Zone: Identified between Resistance R1 and Triple Top area.
Resistance Levels:
R1 near 3359–3400
Major resistance at around 3480–3500 (All-Time High zone).
> "Gold (XAU/USD) - Demand Zone Bounce Targeting 3500 "Current Price: $3,319.59
Indicator: 70 EMA at $3,324.95 ➡️ 📈 (still slightly above price = bearish pressure)
---
Main Observations:
🔵 Demand Zone (📦 Buyers' Area):
Between $3,253 - $3,280
Every time price dips here ➡️ buyers react!
✏️ Descending Trendline:
⬇️ Short-term trend is bearish
Price is trying to break above it now (watch closely!)
🎯 Target Point:
$3,500 🏹 (Big upside if breakout succeeds!)
🛡️ Stop-Loss:
$3,253 🔥 (just below the demand zone = good protection)
Trade Idea:
✅ Buy near demand zone 🔵 after breakout confirmation 📈
✅ Target: $3,500 🎯
✅ Stop-Loss: $3,253 🛡️
Quick Dots Summary:
🔵 Demand zone is strong (buyers defending)
🔻 Still under 70 EMA (bearish until breakout)
✏️ Watching for breakout of trendline = key signal
🎯 Massive Risk:Reward ratio if it works
⚡ If no breakout and price falls, stop-loss saves capital.

(XAU/USD) 1H Chart – Bullish Reversal Setup from RBS + RBR Zone1. Current Price:
$3,317.27
● Price is currently in a downtrend after a recent high.
● EMA (9) is at $3,333.80 — acting as dynamic resistance.
⚠️ Watch for potential reversal!
2. Support Zone:
📦 Blue box marked as "RBS + RBR zone!"
● This is a key support area where price might bounce.
● RBS = Resistance Becomes Support
● RBR = Rally-Base-Rally
● Expecting buyers to step in here.
3. Trade Idea:
● Buy near $3,280 - $3,270 (inside the support box)
● Stop Loss: ❌ Below $3,258.00
● Target: 🎯 $3,500.13
4. Risk-Reward Ratio:
● Target: 🟦 +205.62 points (6.25%)
● Stop: 🔻 Small risk below support
● Good R:R setup if price respects the zone!
Scenario Summary
📉 Price is retracing
⬇️ Approaching strong support zone
📈 Possible bounce to $3,500
✅ High-probability reversal area
❗ Manage risk with tight stop below zone

"(XAU/USD) Bullish Setup: Demand Zone Bounce with 5.89% tgr ptnl🔵 Current Price: $3,451.03
🟡 EMA (9): $3,457.20
🔻 Price is just below EMA — short-term pressure.
Zones & Key Levels:
🟦 Demand Zone:
🔽 Price bounced here before — strong buyer interest!
📍 Zone Range:
* Top: $3,442.38
* Bottom (Stop Loss): $3,395.87
* 🔴 Stop Loss set here to limit risk.
🟨 Entry Point:
* Entry suggested at $3,457.20
* Just above the current price and EMA — needs confirmation
* ⚠️ Wait for bullish candle or price action signal above EMA
🟩 Target Point:
🎯 Target: $3,645
* 📈 Potential gain: +202.78 pts (5.89% upside)
* 🚀 Aiming to break previous ATH (All-Time High)
Visual Trade Plan Summary:
* ✅ Buy Entry: $3,457.20
* ❌ Stop Loss: $3,395.87
* 🎯 Target: $3,645.00
* ⚖️ Risk-to-Reward: Solid, over 3:1
Sentiment:
* If price respects demand zone and reclaims EMA — bullish setup
* 🕵️♂️ Watch for volume or confirmation candle near entry

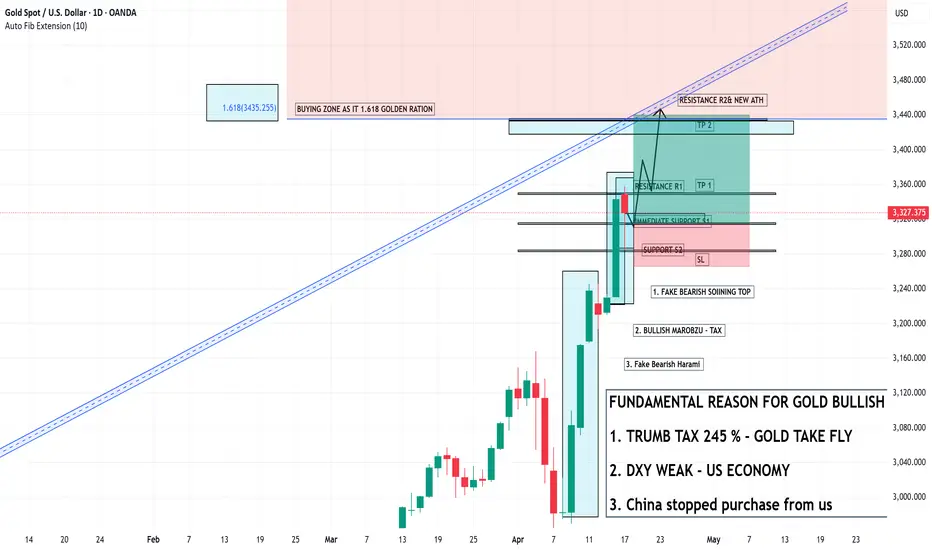
XAUUSD/GOLD WEEKLY PROJECTION 20.04.25Buying Zone around the 1.618 Golden Ratio (3435.255) – A classic Fibonacci extension target indicating a strong potential reversal or take-profit zone.
Price Movement Forecast:
Price is expected to test the Immediate Support (S1) and bounce back.
Resistance levels: R1, then R2 & New ATH (All-Time High).
Take Profits (TP1 & TP2): Clearly marked targets for bullish momentum continuation.
Candlestick Patterns:
Fake Bearish Spinning Top
Bullish Marubozu
Fake Bearish Harami
These patterns typically suggest false bearish signals and continuation of the uptrend.
"Gold Demand Zone Bounce – High R:R Long Setup!"📈 This is a bullish setup using a demand zone bounce strategy on the 15-minute timeframe.
Key Zones & Levels
🔵 Demand Zone:
The blue box is where price previously bounced strongly.
Buyers are likely to step in again here.
✳️ Entry Point:
3,292.38
Just above the demand zone – a safe place to catch the next bounce.
⛔ Stop Loss:
3,280.93
Below the demand zone to protect against a breakdown.
🎯 Target Point:
3,345.09
Near a previous resistance area.
Potential gain: +51.94 pts / 1.58%
Indicators
🟡 EMA (7):
Current value: 3,303.63
Price hovering around EMA = consolidation or setup for a bounce.
Risk-Reward Calculation
⚠️ Risk: 11.45 points
✅ Reward: 52.71 points
⭐ Risk-Reward Ratio: ~4.6:1
Very favorable!
Price Action Summary
📊 Strong uptrend into demand zone
🔁 Minor pullback = potential setup
✅ Ideal entry after bullish confirmation (e.g., bullish candle pattern)
Conclusion
This setup looks solid:
✅ Clear demand zone support
✅ High R:R ratio
✅ Clean target above
Just wait for a bullish signal inside the zone and ride it up!

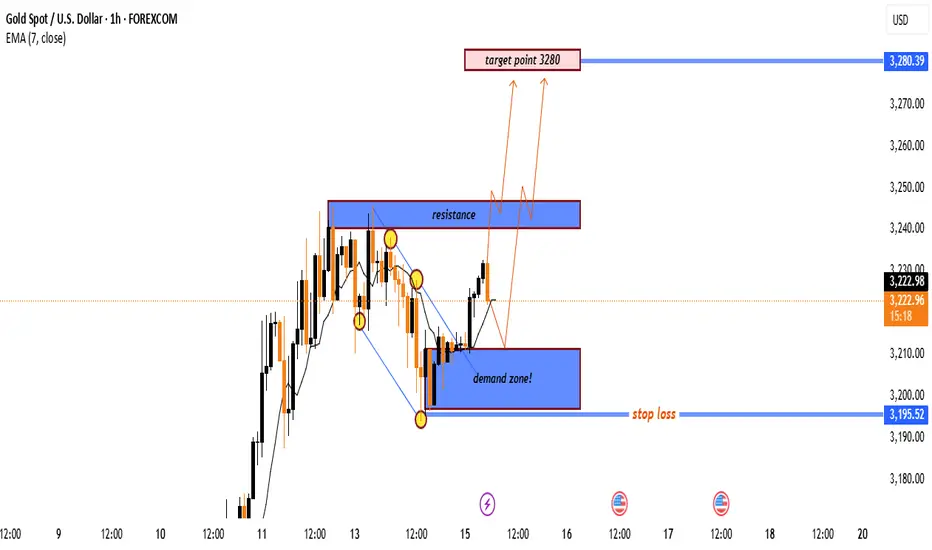
"Gold Bullish Setup: From Demand Zone to 3280 Target!"🟦 Key Zones
🔵 Demand Zone (Support):
📍 Around 3,210 – 3,200
🟢 Buyers stepped in here previously, forming a base for a potential upmove.
🔴 Resistance Zone:
📍 Around 3,240 – 3,250
🚫 Sellers have rejected price from this level several times.
🎯 Target Point:
📍 3280
🚀 If price breaks resistance, this is the expected move.
❌ Stop Loss:
📍 3,195.52
🛡️ Placed just below the demand zone to minimize downside risk.
📊 Price Action & Indicators
* 🟠 Current Price: 3,225.32
* 📉 EMA (7): 3,223.57 – providing dynamic support
* 🔼 Trend: Short-term uptrend with higher lows
🧠 Trade Idea
* ✅ Entry: Around 3,220–3,225
* ❌ Stop Loss: 3,195.52
* 🎯 Take Profit: 3,280
* 📌 Risk-Reward: Favorable if resistance breaks
📈 Possible Scenarios
🔸 Scenario 1:
✨ Immediate breakout through resistance → target 3,280
🔸 Scenario 2:
🔁 Pullback to demand zone → bounce → then move toward 3,280
(XAU/USD) 15-Min Chart –Bullish Setup with RBR Zone& Breakout T🔷 Chart Structure
* 📊 Ascending Channel
↗️ Price is moving within an upward-sloping channel
• Higher Highs
• Higher Lows
* 🔍 Short-Term Trend: Bullish momentum is intact
🟦 Key Zones
* 🟦 RBR Zone (Rally-Base-Rally)
📌 Support area where buyers stepped in
🔄 Price bounced from this zone
* 🟥 Resistance Zone
🚫 Around 3,250 – sellers previously active here
👀 Watch for breakout confirmation
✅ Trade Setup
* 🎯 Entry Point: 3,226.38
* ⛔ Stop Loss: 3,216.30
* 🥅 Target: 3,267.00
* 💰 Potential Gain: 38.67 points (1.20%)
📊 Risk-Reward Ratio: ~1:3 — very favorable!
📍 Indicators
* 📉 EMA (7) — acts as short-term support
🟡 Price is consolidating near EMA — possible setup for next move.
📌 Outlook
* 🟢 Bullish Bias – As long as price stays above RBR zone
* 🔔 Breakout Alert – A break above resistance may lead to sharp upside move toward the target.

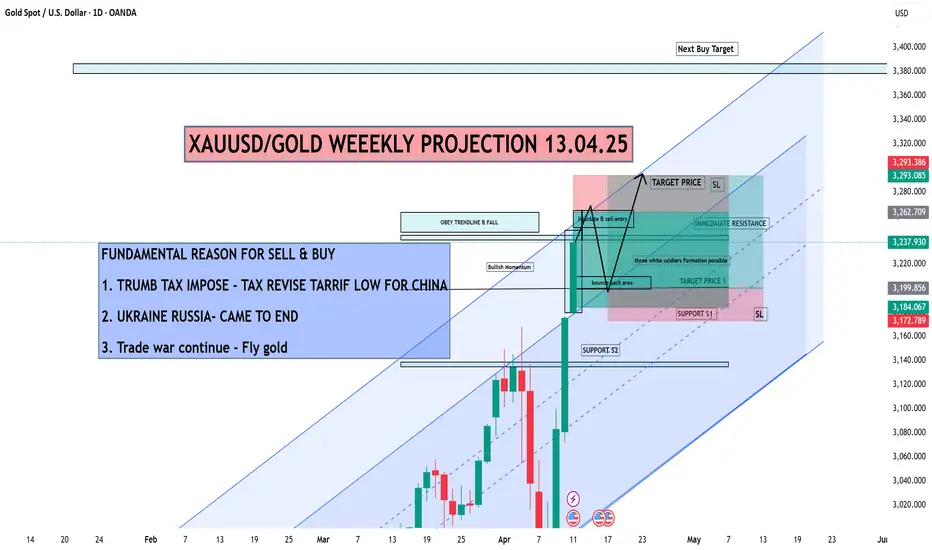
XAUUSD/GOLD WEEKLY PROJECTION 13.04.25Trend: Price is following a clear bullish trend channel.
Bullish Indicators:
"Three White Soldiers" candlestick pattern suggests continued bullish momentum.
"Bounce back area" suggests a buying opportunity after a dip.
Price Targets:
Target Price 1: Around 3,200–3,240
Main Target Price: Near 3,293
Support Zones:
Support S1: ~3,184
Support S2: ~3,140
Resistance:
Immediate Resistance: Just below the target price zone.
Gold (XAU/USD) Trade Setup –Bullish RBR Zone & High Reward Poten🔹 Key Levels:
📍 Entry Point: 3211 🔵
📍 Stop Loss: 3185.109 🔴
📍 Target Point: 3300 🟢
🔹 Market Structure:
📈 The price has formed a Rally-Base-Rally (RBR) zone 📊, which is a bullish continuation pattern 🚀.
🔄 The market surged and is now consolidating within the RBR zone 📦 before potentially resuming its uptrend 📢.
🔹 Trading Plan:
✅ Buy Entry: If price retraces into the RBR zone (around 3211), consider a buy position. 🛒📊
🔻 Stop Loss: Set below the base at 3185.109 to limit risk. ⚠️🚫
🎯 Take Profit: Aiming for 3300, a major resistance level. 🎯📈
🔹 Indicators & Confluence:
📏 DEMA (9): 3223.297 (Currently acting as resistance 🛑)
💰 Risk-Reward Ratio: Favorable setup (High Reward Potential ✅)
🔹 Potential Risks:
⚠️ If price drops below 3185, it could indicate a trend reversal 🔄⛔.
🌎 Economic News & Geopolitical Factors may impact Gold prices significantly. 📰📉
🔹 Conclusion:
📊 Bullish Opportunity 🦅📈 – If the price respects the RBR zone, it may continue upwards towards 3300! 🚀💰
