Gold (XAU/USD) Breakout Setup – Bullish Reversal from RBR Zone!🔹 Trade Idea: Long (Buy) Setup
📈 Targeting a price rally from a demand zone!
---
🔵 .ENTRY ZONE (Buy Area)
🟦 Marked between 3,039.773 – 3,043.052
📍 Located in the RBS + RBR zone (Resistance becomes Support + Rally-Base-Rally)
💡 Price dipped here and bounced — showing bullish intent
🔻 .STOP LOSS
🚨 Placed at 3,014.537
🛡️ Protects you in case the price drops below the zone
✋ Risk is clearly defined here
🎯 .TARGET POINT (Take Profit)
🚀 Aiming for 3,115.910
💸 A high reward area if momentum continues
🔥 Great R:R ratio (~1:3) — solid risk/reward
📊 .Technical Confirmation
📌 Price has moved above the 9-period DEMA (3,043.052)
⚡ Signals bullish momentum
🕯️ Strong bullish candles forming after the bounce — confirming entry.
🔍 .Market Structure Notes
⬇️ Previous trend was down
🔄 Now forming a potential reversal
🧱 Support holding strong near 3,014–3,030
✅ Summary: 💥 Buy idea from demand zone
🔝 Targeting new highs
🛑 Stop loss tightly managed
⚖️ Clean setup with momentum on your side
Xauusdbuy

XAUUSD 1H SELL PROJECTION 08.04.25Instrument: Gold Spot / U.S. Dollar (XAUUSD)
Timeframe: 1 Hour (1H)
Current Price: ~$2,995.25
Projection Date: April 8, 2025
Analysis Type: Bearish/Sell Projection
📊 Technical Elements:
🔹 Trend Analysis:
A 1H downtrend is marked with a descending trendline.
Price previously broke a key support zone, retested it (now acting as resistance), and is expected to drop again.
🔹 Trade Setup:
Entry: Near current price ($2,995.25)
Stop Loss: Above Resistance R1 at $3,010.27
Take Profit Targets:
TP1: At Support S1 (~$2,980)
TP2: At Support S2 (~$2,957)
📈 Indicators:
📍 Stochastic Oscillator (5, 3, 3):
Reading: 79.61 (green) and 80.17 (red)
Interpretation: Just above 80 → Overbought Zone
Signal: Potential reversal downwards
📍 Relative Strength Index (RSI - 14):
Value: 44.84
Interpretation: Below neutral 50, not oversold
Signal: Bearish momentum building
🧠 Conclusion / Strategy:
The chart suggests a short/sell setup for XAUUSD.
The price has retested the broken support (now resistance) and formed a rejection candle at the trendline.
Indicators support a potential downward move (Stochastic overbought + RSI weak).
Targeting lower supports for potential exit points.

XAUUSD READY TO FLY 22 POINTS IN INTRADAYXAUUSD strong zone above 3032
There is no resistance upto 3048....16 points
CURRENT MKT PRICE 3028.70
wait for active zone
Buy above 3032
Stoploss..........3024....8 points
Target1..............3038...6 points
Target2...............3048...16 points
Target3...Risk..........22 points
Disclaimer - This level only for education purpose and papertrade purpose only. Do ur own analysis

XAUUSD/GOLD WEEKLY PROJECTION 06.04.25April 10 – China to impose 34% tax on US goods
→ Trade tension increases risk-off sentiment, potentially lowering gold prices if USD strengthens.
US Manufacturing Tax (NO - 37%)
→ Negative manufacturing data or tax burden could weaken USD sentiment but also stir market uncertainty.
BRICS exploring an alternative currency (moving away from USD)
→ Could signal reduced demand for USD-backed assets like gold in the long term.

Gold Price Analysis:Key Supply & Demand Zones with Potential Bkl🔥 Key Levels & Zones
🔵 Supply Zone (3,135-3,140 USD) 📉
Acts as resistance where selling pressure increases.
If price reaches here, expect a potential pullback.
🟢 Demand Zone (3,085-3,095 USD) 📈
Strong support area with buying interest.
Price has tested this zone multiple times = accumulation.
🎯 Target Point (~3,167 USD) 🚀
If price breaks out, it may rally towards this level!
❌ Stop Loss (~3,080 USD) ⛔
Marked below demand zone to limit risk.
---
📊 Trend Analysis
🔹 Trend Line Break ⚡
The price broke the previous uptrend = potential reversal or deeper correction.
🔹 Market Structure 🏗️
Price consolidating inside the demand zone = possible bullish move ahead.
🔹 Double Bottom Formation (DBF) at Supply Zone 🔄
Shows failed breakout attempts = strong resistance.
---
🔍 Indicators & Insights
📌 DEMA (9 close) at 3,099 USD 📈
Price hovering around this moving average = market indecision.
---
🚦 Possible Scenarios
✅ Bullish Scenario:
If price holds the demand zone & breaks above 3,110 USD, it could rally to supply zone (~3,135 USD).
A breakout above 3,140 USD could lead to the target zone (~3,167 USD) 🚀.
❌ Bearish Scenario:
If price breaks below 3,085 USD, it may hit stop loss (3,080 USD) and continue lower.
---
🎯 Trading Plan
🟩 Long Entry ➡️ Around 3,090-3,100 USD 📊
🛑 Stop Loss ➡️ Below 3,080 USD 🚨
🎯 Target ➡️ 3,135-3,167 USD 🎉

XAUUSD HUGE 36 POINTS UPSIDE POSSIBLE NEW ALL TIME HIGH 3171++XAUUSD strong again buy mode chance above 3134.60
there is no resistance upto new all time high 3171++++
wait for active zone
Buy above 3134.60
Stoploss...............3124.....10 points
Target1.........3141.......6 points+++
Target2.........3151.......16 points+++
Target3..........3161.......26 points+++
Target4...........3171+++ new all time high ....upto 3178+++
Disclaimer - This level only for educationa purpose and papertrade . Do ur own analysis. Thank u

Gold (XAU/USD) Bullish trend Demand Zone – Trend Analysis🔵 Demand Zone (Support Area):
This blue zone represents a strong buying area where buyers are expected to step in.
If the price touches this zone and bounces, it confirms bullish strength.
📉 Trend Line Break:
The previous trendline has been broken ⛔, signaling a possible retest before a move up.
🛑 Stop Loss (Risk Management):
Positioned at 3,108.52 🔴, meaning if the price drops below this, the trade setup becomes invalid.
🎯 Target Point (Take Profit Level):
3,167.77 ✅ is the potential profit zone if the price moves upward from the demand area.
🟠 Expected Price Movement:
The orange dotted line 🔶 suggests a likely move:
1. Price dips into the demand zone (🔵).
2. Bounces back up 🔄.
3. Breaks minor resistance 🟦.
4. Rallies to the target zone 🎯.
Overall, bullish movement 📈 is expected if the demand zone holds! 🚀

Gold (XAU/USD) : Bullish Setup with Key Demand Zone🔹 Trend Line & Demand Zone 📈
* The trend line shows an upward trend. 🚀
* The demand zone 🟦 acts as strong support, where buyers are likely to step in.
🔹 Price Action 🔍
* Price is bouncing off the demand zone ➡️ Bullish Signal 📊🔥
* Higher lows forming, indicating potential upward momentum.
🔹 Trade Setup 🎯
✅ Entry Point: Near the demand zone 🟦
❌ Stop Loss: 🔽 3,099.26 (Below demand zone)
🎯 Target Point: ⬆️ 3,148.58 (Key resistance area)
🔹 Expected Movement 🏆
* A slight pullback 📉 before a strong push up 📈💪
* If price holds the demand zone, 🚀 potential rally ahead!
🔹 Risk-to-Reward Ratio ⚖️
* Favorable trade setup ✅ High reward, controlled risk 🎯
🔹 Final Verdict 🔥
📊 Bullish Bias ✅ As long as demand zone holds!
🚨 Warning: If price breaks below 3,099.26, expect further downside!

XAUUSD/GOLD 1H SELL PROJECTION 02.04.25When the central bank raises interest rates, this is known as monetary tightening. The currency becomes stronger and “worth” more. In practice, it is possible to buy more gold metal, a tangible asset, for the same amount of money. The result is a fall in the price of gold.

XAUUSD/GOLD WEEKLY BUY PROJECTION 30.03.25Gold is showing a bullish trend due to factors like geopolitical uncertainty, rising inflation, and increasing central bank demand for the precious metal.

XAUUSD/GOLD 4H SELL PROJECTION 28.03.25Trendline Resistance: The price is projected to reverse after reaching this resistance level.
Sell Entry: Positioned near the trendline resistance, anticipating a downward move.
Take Profit (TP) Levels:
TP 1: First target near the Support S1 level.
TP 2: Second target near the Support S2 level.
Stop Loss (SL): Positioned above the trendline resistance in a red zone to limit risk.
Breakout Zone Retest: Potential price action area before further movement.
Parallel Trendline: The price is moving within a channel, and a possible break could indicate further downside momentum.

XAU/USD (Gold) Bullish Trade Setup – Key Levels & Targets📊 XAU/USD (Gold vs. USD) - 1H Chart Analysis
🔹 Entry & Risk-Reward Setup
🟢 Buy Zone: $3,015 - $3,017 ✅
🛑 Stop Loss: $3,003.14 ❌ (Protects against downside risk)
🎯 Target Point: $3,045.40 🚀
🔹 Take Profit Levels (TP)
🟡 TP1: $3,021.01 🥇 (First checkpoint)
🟡 TP2: $3,029.73 🥈 (Second target, stronger resistance)
🔵 Final Target: $3,045.40 🏆 (Major resistance level)
🔹 Market Structure & Price Action
📉 Recent Drop: Found support near $3,003 📌
📈 Potential Upside: Price attempting a bullish reversal 📊
⚠️ Watch for breakout at $3,021+ for confirmation! 🚀📊

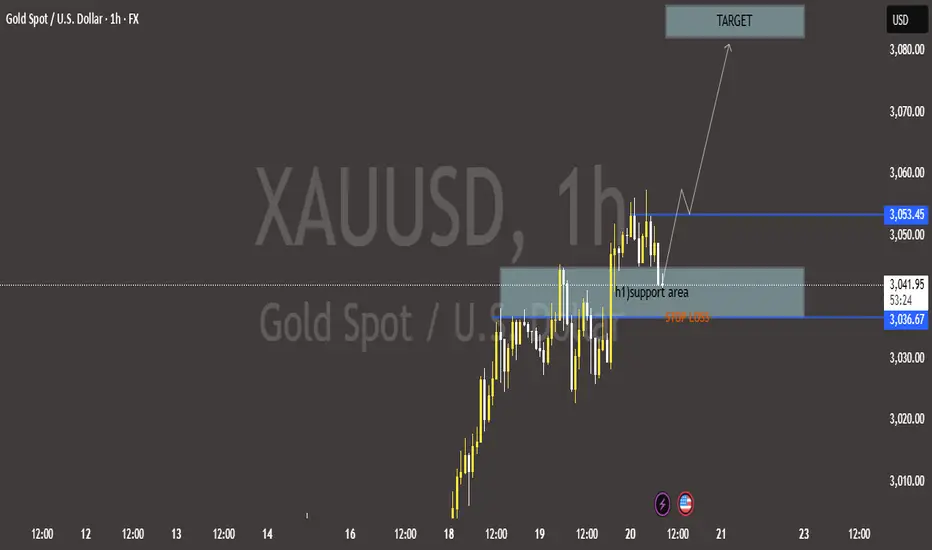
XAU/USD Bullish Breakout Setup – Gold Price Analysis🔍 Key Observations:
🟢 Support Zone:
H1 Support Area 📉: $3,036.67 - $3,044
Price is currently testing this zone (🔵).
🔴 Resistance Level:
$3,053.45 (🛑 Immediate Barrier)
📈 Trade Setup:
✅ Potential Buy Entry near support (🟢)
🎯 Target Zone: $3,080 - $3,090 (📍🚀)
❌ Stop-loss: Below $3,036.67 (⚠️🔴)
📊 Price Action:
If support holds 🟩, price could move UP (⬆️) toward the target 🎯
If it breaks down ⬇️, price may fall further (⚠️📉).
📌 Conclusion:
Bullish 📈 if the price respects support (🟢)
Bearish 📉 if it breaks below stop-loss (⚠️).
4-hour price projection for XAUUSD (Gold vs. US Dollar) on MarchKey Observations:
Current Market Price:
The price is around $3,046.450 at the time of analysis.
The high and low of the period are $3,053.485 and $3,045.005, respectively.
Technical Analysis & Patterns:
Rising Wedge Pattern has been identified.
A Bullish Engulfing Candlestick has formed, indicating potential upward momentum.
Break and Retest Strategy:
The chart suggests a breakout zone retest while respecting the trendline before further upward movement.
Key Levels:
Resistance 1: Around $3,054.264.
Target Price 1: Between $3,054 - $3,070.
Resistance 2 & Trendline Resistance: Near $3,076 - $3,080.
Stop-Loss: Set at a weekly low around $3,025 - $3,016.
Price Projection:
Expected price movement suggests a pullback to support levels before continuing its bullish trajectory.
A potential move toward $3,076+ is anticipated.
This chart analysis suggests a buying opportunity, with key resistance levels to monitor for profit-taking.

Gold (XAU/USD) Trade Setup – Bullish Momentum Ahead?Gold Spot (XAU/USD) 1H Chart Analysis
🔹 Entry Point: 3,026.90 🔵
🔹 Stop Loss: 3,019.58 - 3,019.07 ❌ (Risk Zone)
🔹 Take Profit Levels:
TP1: 3,034.64 🎯
TP2: 3,041.72 🚀
Final Target: 3,053.04 🏆
📈 Trend Analysis:
🔸 The market has been in a strong uptrend 📈 before pulling back to the entry zone.
🔸 The trade setup suggests a buy (long) position, aiming for higher levels.
🔸 If momentum continues, price may reach TP1 → TP2 → Final Target.
⚠️ Risk-Reward Ratio:
✅ Potential Reward: ~27 points 🏅
❌ Risk: ~7-8 points 🚨
💰 Risk-to-Reward Ratio: 1:3 (Favorable setup)
🔻 Risk Factor:
If price drops below 3,019.58, the trade will hit stop loss and may indicate a trend reversal 🔄.
📢 Conclusion:
Bullish trade setup looking promising if price holds above the entry point and moves towards TP targets! 🚀🔥

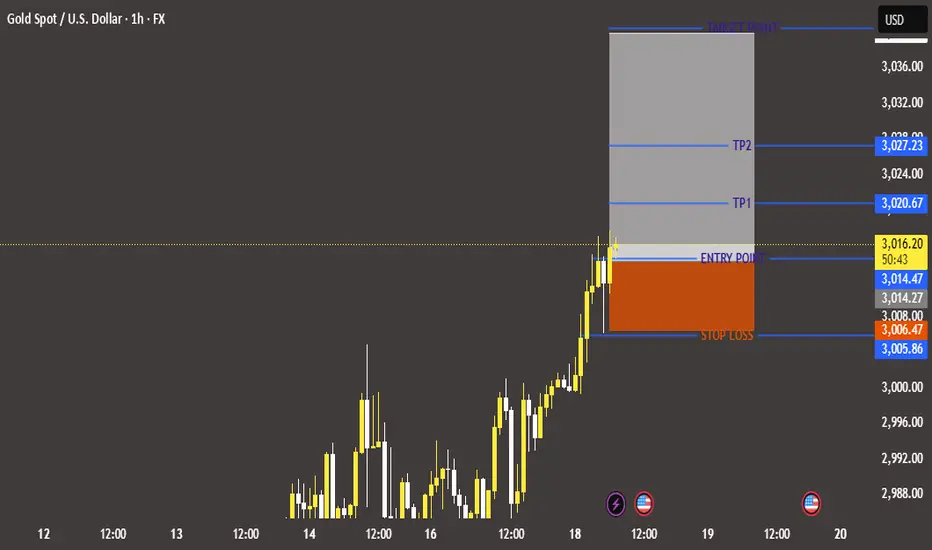
Gold (XAU/USD) Trade Setup – Bullish Breakout AnalysisGold Spot (XAU/USD) 1-Hour Chart Analysis
🔹 Entry Point: $3,014.47 - $3,017.24 ✨ 🔹 Stop Loss: $3,005.86 ❌ 🔹 Take Profit Levels: ✅ TP1: $3,020.67 📈 ✅ TP2: $3,027.23 🚀 ✅ Final Target: Above $3,036 🎯
📉 Trend Analysis
🔸 Strong Bullish Momentum 📊🔥 🔸 Price Breakout from Consolidation 📢✅ 🔸 Higher Highs Formation ⬆️📈
⚖️ Risk-Reward Ratio
✔️ Low Risk: Tight Stop Loss 📉🚨 ✔️ High Reward Potential: Profit targets significantly higher 📊💰 ✔️ Favorable Risk-to-Reward Setup ⚖️🔄
🚀 Trading Plan
🟢 Bullish Scenario: ✔️ If price holds above $3,014.47, it could hit TP1 & TP2 🎯🚀
🔴 Bearish Scenario: ❌ If price drops below $3,005.86, stop-loss triggers & trade is invalidated ⚠️📉
💡 Conclusion: This setup suggests a long (buy) trade with a strong bullish bias 📊💎. A breakout above $3,017 could push the price towards higher profit levels 🚀💰.
15-minute (15M) analysis of XAU/USD (Gold vs. USD) with a "W" paHere's a breakdown:
W Pattern Formation: A bullish reversal pattern has been identified.
Entry Point: The price has broken above the resistance zone, confirming the pattern.
Stop-Loss (SL): Placed below the recent low at 2,985.73.
Take Profit (TP) Targets:
TP1: Around 2,994 (Resistance R1).
TP2: Around 3,002.02 (Resistance R2 & All-Time High).
The projected path suggests a breakout and retest of Resistance R1 before pushing towards TP2.

IS GOLD HEADING FOR A NEW ALL-TIME HIGH? USD LOSING GROUND!📌 Market Overview
For the past three months, the US Dollar (USD) has been consistently weakening, signaling a significant shift in the financial markets. With the latest CPI report showing weaker-than-expected figures, USD remains under pressure in the short term. However, long-term indicators suggest a potential recovery, implying short-term weakness but long-term strength for the dollar.
Meanwhile, GOLD continues to benefit from this USD downturn, both fundamentally and technically. As previously highlighted, our bullish bias remains intact, and we will continue to look for early buy opportunities at key support zones while monitoring the next resistance levels at all-time highs (ATH).
📊 CPI Impact on USD & GOLD – What’s Next?
🔹 USD’s Short-Term Weakness vs. Long-Term Resilience
The weaker-than-expected CPI figures have put immediate downside pressure on the USD.
However, in the long run, this could signal a bottoming phase for the dollar, setting the stage for future strength.
For now, USD weakness supports GOLD's bullish momentum, allowing for further upside potential.
🔸 GOLD’s Continued Strength – Aiming for New Highs?
With weaker USD and a risk-off sentiment, GOLD remains a preferred asset for investors.
Our strategy stays focused on buying dips, particularly around key support zones.
The upcoming PPI report (Producer Price Index) will be another crucial factor influencing inflation expectations and USD movement.
📉 Key Technical Levels for GOLD
🔹 Major Resistance Levels:
2,945 - 2,956 - 2,972 - 2,988
🔻 Major Support Levels:
2,931 - 2,922 - 2,914 - 2,906 - 2,898
🎯 Trading Plan for Today
🟢 BUY ZONE: 2,922 - 2,920
📍 SL: 2,916
🎯 TP: 2,926 - 2,930 - 2,935 - 2,940 - 2,950
🔴 SELL ZONE: 2,955 - 2,957
📍 SL: 2,961
🎯 TP: 2,950 - 2,946 - 2,942 - 2,938 - 2,930
⚡ PPI Data Tonight – Another Market Mover!
📌 Tonight, the PPI (Producer Price Index) report will be released, measuring inflation at the production level.
📌 A weak PPI print could add short-term bearish pressure on USD, further supporting GOLD’s bullish bias.
📌 However, in the long run, stable inflation could provide support for USD, reinforcing its recovery trend.
📢 Traders, be prepared for increased volatility! Stick to TP/SL levels to protect your capital. 🚀🔥
💬 What’s your view? Do you think GOLD will hit new ATH levels, or will USD start its recovery soon? Let’s discuss in the comments!

XAUUSD H2 : Analysis GOLD!📈 #BUY GOLD: 2893/2890
Stoploss: 2885 / Target: 2940
📉 #SELL GOLD: 2944/2947
Stoploss: 2952 / Target: 2920
Analysis: If Gold price runs into offers, immediate support is seen at the 2850 psychological barrier as the 21-day SMA at 2911 gives way.
The demand area near 2835 could be a tough nut to crack for sellers.

XAUUSD/GOLD WEEKLY PROJECTION 09.03.25When traders say "gold is bullish," it means they anticipate the price of gold to increase, suggesting a positive outlook for the metal's performance.

XAUUSD/GOLD WEEKLY PROJECTION 09.03.25When traders say "gold is bullish," it means they anticipate the price of gold to increase, suggesting a positive outlook for the metal's performance.

Weekly Buy Projection for XAUUSD (Gold) as of March 9, 2025This chart presents a **weekly buy projection** for **XAUUSD (Gold) as of March 9, 2025**. Here are some key takeaways:
### **Key Zones & Levels:**
- **Entry Zone:** Around **2,892.189 - 2,892.277** (aligned with a major trendline and support).
- **Support Levels:**
- **S1:** Weekly low acting as support.
- **S2:** Stronger support at **2,859.812** (also the stop-loss level).
- **Resistance Levels:**
- **R1:** Weekly high acting as resistance.
- **R2:** **2,956.190** (all-time high resistance).
- **Target Prices:**
- **Target 1:** **2,929.162**
- **Target 2:** **2,956.190** (major resistance zone).
### **Trend Analysis:**
- The chart highlights a **V-pattern formation**, confirming a **buy signal**.
- The **4H uptrend line was breached**, but the **daily timeframe trendline remains intact**.
- **Sideways movement** expected before continuation upwards.
- **Braked resistance retest** suggests a bullish continuation if price holds above support.
### **Trade Plan:**
- **Buy Entry:** Around **2,892.189 - 2,892.277** (as long as it respects the trendline and support).
- **Stop Loss:** Below **2,859.812** to manage risk.
- **Take Profit:**
- **Target 1:** 2,929.162 (first resistance)
- **Target 2:** 2,956.190 (major resistance & ATH)

XAUUSDOANDA:XAUUSD
Hi guys, As you can see that XAUUSD has created an inverse Head and Shoulder pattern in 1Hr Time frame. if it breaks the drawn level we can go for buy side. so, plan your trade accordingly.
