A-Book vs B-Book: What Every Retail Trader Needs to KnowMost retail CFD traders have never even heard the terms “A-Book” and “B-Book,” yet almost all of them are directly affected by how these models work. Your broker’s choice between the two can change the prices you see, how your orders are filled, and even whether your stop loss gets hit. Let’s break it down so you know exactly what’s going on behind the scenes.
█ What is A-Book?
An A-Book broker routes your orders straight to external liquidity providers, such as banks, market makers, or directly to an exchange in the case of futures or spot markets. Your broker is essentially the middleman, passing your trade along and matching it with a real counterparty.
⚪ How they make money:
Spreads (the difference between the bid and ask prices).
Commissions on each trade.
Occasionally a small markup on the feed.
Because they don’t profit when you lose, an A-Book broker’s ideal client is a trader who trades frequently and consistently, your activity is their revenue stream.
█ What is B-Book?
A B-Book broker keeps your trades “in-house,” meaning they take the other side of your position. If you buy, they sell; if you sell, they buy, but all within their own system. Your trades don’t reach the real market at all.
⚪ How they make money:
Your losses are their profits.
They may still earn on spreads and commissions, but the main income is the net loss of their client base.
Xauusddaily

XAUUSD (Gold Spot vs USD) – Daily Chart Analysis: Strong UptrendOverall Trend
Gold (XAUUSD) remains in a strong long-term uptrend on the daily timeframe.
Price is making higher highs and higher lows, trading near the upper range around 4,485.
The broader bullish structure is intact despite minor pullbacks.
Price Action
Recent candles show steady bullish continuation, but momentum is slightly slowing.
Price is approaching a descending trendline resistance (blue dashed line), which could act as a short-term cap.
A breakout above this trendline would confirm further upside continuation.
RSI (Relative Strength Index)
RSI is around 81, clearly in the overbought zone.
Previous “Bear” divergence labels suggest that momentum has weakened before at similar RSI levels.
This increases the probability of a short-term correction or consolidation, even if the main trend remains bullish.
Volume
Volume has picked up recently, supporting the latest price advance.
However, volume is not expanding aggressively, hinting at possible buyer exhaustion near current highs.
MACD
MACD remains above the signal line and in positive territory, confirming bullish momentum.
The histogram is modest, suggesting momentum is positive but not accelerating strongly.
Key Levels
Resistance: 4,500 – 4,550 zone and the descending trendline.
Support: 4,350 – 4,300 (previous consolidation zone).
A daily close below support could trigger a deeper pullback toward 4,100–4,200.
Outlook:
Bullish bias remains dominant, but conditions are overbought.
Short-term traders should be cautious of a pullback or sideways consolidation.
Medium- to long-term traders may look for buy-the-dip opportunities as long as price holds above key support.

XAUSD/GOLD 4H SELL PROJECTION 07.12.251. Major Rejection Zone
Price tapped into the Huge Liquidity Collection Zone (yellow zone).
Strong rejection with bearish candlestick formations (Engulfing + Spinning Top).
2. Pattern Confirmation
Double Top formation at Resistance R1–R2.
Neckline broken and candle closed below – confirming trend reversal.
Break of a major triangle pattern also supports bearish continuation.
3. Entry Zone
Entry marked at 4,207.97 zone after retest and bearish confirmation.
Confluence with:
Resistance Rejection
Structure Break
Bearish candle patterns
4. Stop Loss (SL)
SL placed at 4,243.17, above the wick and liquidity grab zone.
5. Take Profit (TP)
Targeting Premium Zone around 4,146.62.
Risk–Reward Ratio: 1 : 2
🎯 Final Sell Projection
Expecting price to drop towards 4,146–4,150 zone after rejection from liquidity and break of structure.
Bearish candlestick confirmation increases probability of continuation move.

Gold Faces Rejection at Resistance Zone – Potential Bearish CorrAnalysis:
The gold price (XAU/USD) is currently testing a strong resistance zone near $4,235–$4,240, where previous bullish momentum appears to be slowing down. Sellers are showing interest in this area, suggesting a potential bearish reversal or correction phase.
A clear support zone lies around $4,140–$4,150, which serves as the target for the expected downward move. If price breaks below this support, further declines could extend toward the next demand zone.
However, if gold breaks and closes above the resistance zone with strong volume, it could invalidate this bearish setup and open the path to new highs.
Key Points:
Resistance Zone: $4,235 – $4,240
Support Zone: $4,140 – $4,150
Short-term Bias: Bearish correction expected
Target: Support zone near $4,145

XAU/USD: Powell vs. The Discount ZoneHello, Traders! Let's dive deep into Gold (XAU/USD). The price is currently caught in a crucial tug-of-war: a hawkish US Federal Reserve (Fed) is strengthening the Dollar, while the political risk of a potential US government shutdown offers strong support to Gold. This is where the opportunity lies!
📰 Key Fundamental Drivers (Watch Closely):
The Fed & Powell's Stance: The likelihood of a US rate cut in December has decreased significantly. This signals a Hawkish view, which generally makes the USD stronger and places DOWNWARD pressure on Gold prices.
US Government Shutdown Risk: Concerns are rising that a prolonged government closure could harm the US economy. This economic uncertainty acts as a strong tailwind for Gold, as it is a premier safe-haven asset.
📉 Technical Analysis (The Chart View):
We observe XAU/USD moving within a Rising Wedge pattern (often a signal for a bearish reversal) and is now heading towards a critical price level we call the Strategic Support Zone.
🔥 Strategic Support Zone (The Discount Zone): $3,941 - $3,953. This is the key zone where patient buyers typically look to enter Buy (Long) trades, ensuring a favourable risk/reward profile.
Major Resistance Zone: $4,004 - $4,025.
🎯 Our Two-Sided Trading Strategy:
1. The Bullish Scenario (Long):
Action: Wait for the price to test and show a strong reversal signal (like a rejection candlestick) from the $3,941 - $3,953 support area.
Target: $4,004 - $4,025.
2. The Bearish Scenario (Short):
Action: SELL (SHORT) if the price is strongly rejected at the $4,004 - $4,025 resistance zone, OR if it decisively breaks and closes below $3,941.
Target: Below $3,900.
🚨 Important Note: We must closely monitor any further statements from FOMC members this week. They will dictate the short-term direction. Trade wisely and always use a Stop Loss!
#xauusd #forexindia #powell #fomc #technicalanalysis #gold #usd #indiaforex #tradingview #marketanalysis

GOLD (XAU/USD): SHORT OPPORTUNITY — RIDING THE FINAL BEAR LEG!1. MACRO VIEW: THE FED DECISION & MARKET TENSION
The Gold market is currently caught in a tug-of-war:
Downside Pressure (USD): Positive developments in the US-China trade talks are easing global risk concerns, which often reduces demand for safe-haven Gold.
Upside Support (Gold): Traders are fully pricing in a 25bps Fed rate cut on Wednesday, putting downward pressure on the US Dollar (which is supportive of Gold). Geopolitical tensions (Russia-US) add further safe-haven appeal.
Key Takeaway: While USD weakness is supportive, our Technicals strongly suggest a corrective move needs to conclude first. The FOMC decision is the ultimate game-changer.
2. TECHNICALS: STRUCTURE CONFIRMS THE BEARISH BIAS
Trend Shift: Gold’s strong previous rally has ended. The structure has been clearly broken, confirming a Bearish Shift for the short-term trend.
Expected Move: We are looking for a classic technical pullback (Retest) to the newly formed resistance zone. Following this retest, we expect sellers to push the price down to complete the correction.
3. 💡 TRADE STRATEGY (THE SHORT SETUP)
We are positioning for a SELL (SHORT) trade, anticipating the end of the corrective phase:
Ideal Entry Zone (Entry): 3,949.849 (Retesting the previous major Support, now acting as Resistance)
Take Profit (TP1): 3,929.793
Take Profit (TP2): 3,878.287 – 3,811.333 (The Major Demand Zone Target below)
Stop Loss (SL): Above 3,949.849 (Placed above the confirmed resistance)
⚠️ Important Note: The FED rate decision on Wednesday guarantees high volatility. Trade cautiously and ALWAYS prioritize risk management!
What is your view on Gold's bottom? Share your thoughts below! 👇
#Gold #XAUUSD #FOMC #TradePlan

#xauusd gold dumping is going to 3600 this is my gold analysis#xauusd gold dumping is going to 3600 this is my gold analysis #xauusd gold dumping is going to 3600 this is my gold analysis
v
#xauusd gold dumping is going to 3600 this is my gold analysis#xauusd gold dumping is going to 3600 this is my gold analysis#xauusd gold dumping is going to 3600 this is my gold analysis#xauusd gold dumping is going to 3600 this is my gold analysis
#xauusd gold dumping is going to 3600 this is my gold analysis
why the reason you can sea on my previous public post of #gold
#xauusd

GOLD (XAU/USD): THE FED AND THE FINAL DIP – GET READY TO SHORT1. MACRO SCENARIO: KYA HO RAHA HAI?
Pull Factor (For Sellers): The US-China deal framework is good news, reducing those 100% tariff fears. This is putting some halki halki (slight) pressure on Gold.
Push Factor (For Buyers): CPI figures are weak (3% inflation), which pakka (surely) means the Fed will cut rates soon. Plus, the Russia-Ukraine jhamela (trouble) is a serious safe-haven booster.
The Main Event: The FOMC decision this Wednesday is the baap (father/boss) of all events. This will decide the long-term rasta (path) for Gold.
2. TECHNICAL ANALYSIS: STRUCTURE KA RAAZ (Secret of the Structure)
Current Scene: Gold had a solid run, but now it's in a big sydeway correction. The main price trend has been broken, confirming that the immediate sentiment is bearish. Zyada (More) selling pressure is expected.
Expected Plan: Gold has likely finished its upward natak (drama) and is ready for the final, sharp dip to complete this correction phase.
The Target (Magnet): The critical Value Gap on the Daily chart (around $3,880 – $3,920) is the strongest magnet. Pakka (Definitely), the price is heading here before taking a u-turn.
ENTRY WAITING: We might see a small comeback (retest) towards the broken structure area before the big fall starts. Pura dhyan udhar hi rakhna (Keep full attention there only).
3. 💡 TRADING STRATEGY (SHORT SIDE)
We are focusing on a SHORT trade for this final correctional wave:
Best Entry Zone: $4,080 – $4,100 (Retest of the broken zone).
Booking Profit (TP1): $3,970 (Nearest Demand Zone).
Booking Profit (TP2): $3,880 (The final target at the major Daily Value Gap).
Stop Loss (SL): $4,135 (Above the main Supply Zone, for safety).
A Serious Note: Please keep your Stop Loss tight before the FOMC on Wednesday. Mazaak nahi (No joke)! This short could be the last dance before a long-term rally!
Where do you think Gold will find asra (shelter/support)? Drop your comments below!
#Gold #XAUUSD #FOMC #Trading #TradePlan

XAU/USD: GEMING! US-RUSSIA TENSION DI MANA MAU ENTRY?Gold ($4,140/oz) has bounced back nicely after a big drop from the top. This strength is mostly because of the new US sanctions on Russia (more geopolitical heat!) and everyone is waiting for the key US Inflation Data (today, 24/10). Basically, the fundamentals are giving Gold a strong support!
📌 TECHNICALS & THE GAME PLAN (H1)
Crucial Resistance (Level Berat): $4,180 - $4,186
Action: Jual (Sell) if price reaches this level and gets rejected. Beli (Buy) only if it breaks decisively above $4,186 for a big continuation.
The 'Sweet Spot' Support (Area Cuan): $4,085 - $4,091
Action: Bias BUY. This is the 'Buy The Dip' opportunity. Watch for bullish confirmation here—this is a high-value area.
Safety Net (SL Aman): Below $4,057
If this level is lost, watch out! Pressure will mount to push Gold towards $4,000.
💡 VERDICT & STRATEGY
Gold is currently consolidating. With all this strong news backing it up, the best strategy is to look for BUY entries around the established support zone.
Ideal Entry: $4,085 - $4,091
Stop Loss (SL): Below $4,057
Target (TP): Aim for $4,180
Yuk, trading hati-hati! Don't forget to keep an eye on US Inflation later! 🚀
#XAUUSD #Emas #ForexIndonesia #TradingViewID #Geopolitik #AnalisaTeknikal #BuyTheDip #TradingStrategy #SinyalEmas

Gold Maintains Upward Channel Toward $4320 TargetAnalysis:
The XAU/USD 45-minute chart shows gold continuing its steady rise within a well-defined ascending channel. The price action maintains higher highs and higher lows, confirming a sustained bullish trend.
Currently, gold is testing the midline of the channel, suggesting a possible minor pullback before resuming upward momentum toward the projected resistance near $4320. This level aligns with the upper boundary of the channel, acting as the next potential target zone for buyers.
As long as the price remains above the lower channel support, the bullish structure remains intact. A breakout above $4320 could open further upside potential, while a drop below the channel could signal early weakness or short-term consolidation.

Gold Correction: Fed Warning vs. Massive Safe-Haven Flows Hello, traders!
Gold pulled back to $3,845.78/oz after Dallas Fed President Lorie Logan called for caution regarding further rate cuts.
Fundamentals: Fed Warns, But the Buying Wave is Unstoppable
The market stands at a crossroads:
Downward Pressure: The caution signal from Fed's Logan.
Upward Momentum: Government shutdown (increases instability, delays jobs report), weak private sector jobs data (down 32k), and SPDR Gold Trust ETF holdings rising to the highest level since 2022.
Conclusion: Political instability and weak economic data continue to reinforce the likelihood of a Fed rate cut. Massive safe-haven capital is flowing into Gold.
Technical Analysis & Strategy
Gold retreated to the FIBO 0.618 - 0.5 zone, indicating a healthy technical correction after the sharp rally. Priority remains Buy if the price holds above $3861. Be cautious of Stop Loss hunting.
Resistance: $3870, $3884, $3894
Support: $3855, $3833, $3798
Trading Strategy (Tight SL):
BUY SCALP: $3838 - $3836 / SL: $3832 / TP: $3846 - $3857
BUY ZONE: $3798 - $3796 / SL: $3788 / TP: $3816 - $3836
SELL ZONE: $3888 - $3890 / SL: $3898 / TP: $3870 - $3850
Do you think the Fed's warning is strong enough to reverse this trend? 👇
#Gold #XAUUSD #Fed #GovernmentShutdown #TradingView #PhânTíchVàng #ETF

Gold Record: Shutdown 'Blinds' the Fed Hello, traders!
Gold shows absolutely no sign of slowing down, closing the October 1st session at $3,866.66/oz, while futures contracts hit a record high of $3,897.50/oz. The precious metal has climbed nearly 50% year-to-date and just set its 39th record high this year!
Fundamental Analysis: Shutdown Risk Hits at the Worst Time
While government shutdowns usually have a minor impact, the timing of this one is critical:
Delayed Jobs Data: The crucial jobs report (scheduled for Oct 3rd) will be postponed. This uncertainty will leave the market and the Fed 'blind' regarding the economy's health just weeks before the next policy meeting, triggering strong demand for safe-haven assets (Gold).
Threat of Staff Cuts: President Trump threatened to use the shutdown to cut "a lot of" federal employees, escalating tensions beyond typical closures and increasing political instability.
Technical Analysis & Trading Strategy
Gold accelerated past the $387x region during the US session, confirming the upward momentum is still very strong. However, the market is prone to more "Stop Loss hunting" (liquidity sweeps). Continue to Prioritize Buy, but manage SL carefully due to wider price swings.
Resistance: $3887, $3895, $3904
Support: $3870, $3854, $3843
Suggested Trading Strategy (Absolute Risk Management):
BUY ZONE
Zone: $3870 - $3868 / SL: $3860
TP: $3878 - $3888 - $3898 - $3908
SELL ZONE (High Risk)
Zone: $3903 - $3905 / SL: $3913
TP: $3895 - $3885 - $3875
Gold is running on a foundation of fear. Do you think the $3900 mark will be breached this session? 👇
#Gold #XAUUSD #ATH #Fed #GovernmentShutdown #TradingView #FinancialMarkets #RecordHigh

Gold Smashes Records: Trade the Fed Drama & Rate Cut Hype!Fundamental Analysis: Why Gold Keeps Breaking Records! 🌟
New Peaks: Spot gold hit a record $3,527.5/oz on September 2, with analysts predicting a climb to $3,600-$3,900 this year, potentially surpassing $4,000 by 2026 if economic and geopolitical uncertainty persists. Reuters polls show 2025 average price forecasts rising from $2,756/oz (January) to $3,220/oz (July). 📈
Fed Rate Cut Buzz: Fed Chair Jerome Powell acknowledged rising job market risks, boosting bets for a September rate cut. “A weakening USD, fueled by rate cut expectations, investor aversion to US assets, and tariff-related economic uncertainty, supports gold,” says Ricardo Evangelista from ActivTrades. Gold thrives in low-rate environments! 🏦
USD Weakness: The USD has lost nearly 11% since Trump’s return to the White House in January 2025, making gold more attractive to foreign currency holders. 📉
Fed Drama: Trump’s criticism of Powell and attempts to oust Fed Governor Lisa Cook have raised fears about Fed independence, driving safe-haven gold demand. “Speculative bullishness stems from potential Fed interference and concerns over the USD’s safe status,” notes Carsten Menke from Julius Baer. ⚖️🇺🇸
Other Drivers: Middle East tensions, Russia-Ukraine conflict, and central bank buying (e.g., China’s PBOC added gold for the 9th consecutive month in July 2025). The World Gold Council (WGC) reports central banks plan to increase gold reserves while reducing USD holdings. “Rising gold prices and central bank accumulation are boosting gold’s share in reserves,” says Michael Hsueh from Deutsche Bank. Gold ETFs like SPDR Gold Trust saw holdings rise 12% YTD to 977.68 tons, the highest since August 2022.
Technical Analysis: Bullish Surge Continues, Prioritize BUY but Watch for Pullbacks! 📉
Gold keeps setting new highs, breaking through the round 3,500 level, dipping briefly to 3,469, then surging to 3,54x—near the Fibonacci extension 0.618. No clear reversal signals yet, so prioritize BUY if gold retraces to 3,52x or 3,51x. Bulls remain in control!
Key Resistance: 3,554 - 3,564 - 3,574
Key Support: 3,521 - 3,508 - 3,450 - 3,475
Trading Opportunities:
Sell Scalp : 3,543 - 3,545
SL: 3,549
TP: 3,540 - 3,535 - 3,530
Sell Zone : 3,571 - 3,573
SL: 3,581
TP: 3,563 - 3,553 - 3,543 - 3,523
Buy Scalp: 3,510 - 3,508
SL: 3,504
TP: 3,513 - 3,518 - 3,528
Buy Zone: 3,475 - 3,473
SL: 3,465
TP: 3,483 - 3,493 - 3,503 - 3,513 - Open
#Gold #XAUUSD #Fed #Trump #TradingView #MarketUpdate #Forex #Investing #TechnicalAnalysis #GoldTrading #Finance #Crypto

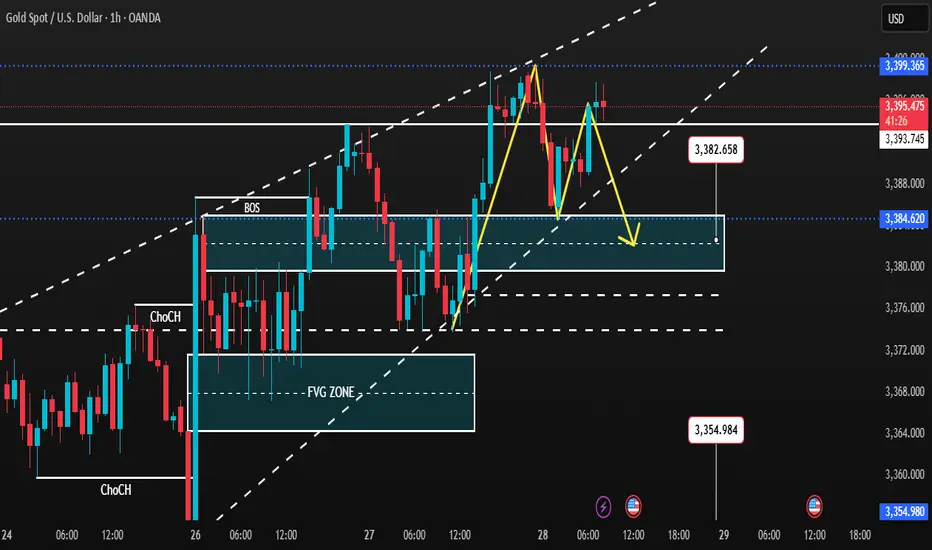
Divergence has appeared at H4 – TOP IS ABOUT TO BE FORMEDGold SMC Daily Plan – 28/08
Market Context (SMC view):
Gold is trading near 3395–3396 after a sharp bullish rally. Early bearish divergence is visible on H4, hinting at a short-term top.
Key resistance is at 3400 – a clean breakout above may trigger liquidity sweep towards 342x–343x, retesting the old ATH.
On the downside, if 3370 support breaks, price may correct deeper into 335x BUY zone for a strong bullish setup.
Key Levels:
Resistance: 3396–3400 (Sell Zone), 342x–343x (Liquidity sweep area)
Support: 3370, 3354–3352 (Buy Zone), 3325 (SL for longs)
SMC Zones & Liquidity Pools:
BUY ZONE 1: 3354–3352 (below liquidity sweep under 3370)
SL: 3347
TP: 3365 → 3375 → 3385 → 3395 → 3400+
BUY ZONE 2: 3380–3382
SL: 3374
TP: 3390 → 3400 → 3415 → 3430 → 3450+
SELL ZONE: 3408–3410 (above recent high)
SL: 3416
TP: 3390 → 3380 → 3375 → 3360
Trading Plan & Scenarios:
Sell Setup (Primary Bias – Divergence Play):
Look for liquidity grab above 3396–3399 (into resistance).
Enter short with SL above 3403.
Partial profits at 3390–3380–3375; keep runner towards 3360 if support breaks.
Buy Setup (Counter Play – Break & Retest):
If price dips into 3354–3352 BUY zone, wait for bullish confirmation (choch/BOS on lower TF).
Enter long with SL below 3347.
Targets: 3365 → 3375 → 3385 → 3395 → 3400+
Confluences:
H4 bearish divergence signalling possible exhaustion at top.
Liquidity pools above 3396 and below 3370 remain untapped.
FVG and imbalance align with 335x buy zone.
XAUUSD WEEKLY BUY PROJECTION its price increases in response to events that cause the value of paper investments, such as stocks and bonds, to decline.

XAUUSD SHOWING A GOOD DOWN MOVE WITH 1:10 RISK REWARDXAUUSD SHOWING A GOOD DOWN MOVE WITH 1:10 RISK REWARD DUE TO THESE REASON
A. its following a rectangle pattern that stocked the marketwhich preventing the market to move any one direction now it trying to break the strong resistant lable
B. after the break of this rectangle it will boost the market potential for breakC. also its resisting from a strong neckline the neckline also got weeker ald the price is ready to break in the outer region
all of these reason are indicating the same thing its ready for breakout BREAKOUT trading are follws good risk reward
please dont use more than one percentage of your capitalfollow risk reward and tradeing rules that will help you to to become a bettertrader
thank you

XAUUSD BUYLIMIT PROJECTIONOverall Possible Outcomes
XAUUD BUY @ 1975-80
SL 1955
TP 1 2010
TP 2030
Reason
Obey Stronger Support & Trendline @ 1970 which also act as Fib Retreacement of 0.5 Level

XAUUSD BUY PROJECTION|NEW HIGH EXEPECTEDReason Behind the Bullish
1. Bullish Inverted Hammer In Single Candlestick Pushes Higher
2. Three Outside Up candlestick Make the Buying Pressure and make continue of Uptrend
3. Breaked the Support 2045-50 last Week
Overall Possible Outcomes
XAUUSD Buy @ 2030-45
Sl 2015
TP 1 2060
TP2 2090
TP3 2150

XAUUSD CHART ANALYSIS ON DAILY TIMEFRAMEIn this chart i will trying to show you xauusd idea with
BOS-Break of structure
CHOCH-Change of character
Demand & Supply Zone

XAUUSD BUY TARGET 1730FX SIGNAL
GOLD BUY LIMIT 1620-25
Sl 1590.00
Tp 1730.50
Reaon For XAUUSD GOLD BUY
1. Retest Yearly Low and rebound the major Resistance
2. Fibonacci Indicates teg Bullish
3. RSI over sold an tends to be bullish

XAUUSD 1H SELL PROJECTION XAUUSD 1H SELL PROJECTION
Reason behind Fall
RSI 14 above 50 and make Bullish in 1H time Frame
stochastic Indicator indicates Overbought an tends to Fall
Possible Outcomes
GOLD SELL 1668.28
SL 1678.00
TP 1648.50

XAUUUSD LONG PROJECTION XAUUSD BUY PROJECTION
Technical and fundamental Reason for the XAUUSD LONG
1. Last week friday 1d candle closed above the support region of 1710 and denotes the bullish monemtum
2. single candle confirmation indicates bullish as it formed teh Inverted Bullish hammer (Bullish move continued)
3. Formed teh Triangle flag patterna and push higher
Fundamental Reason
DXY reached the 20 year High and retest teh montly low of 108.00 in the following days as expexted
Overall Projection
XAUUSD/GOLD BUY @ 1710-1715
Stoploss - 1690
Target - 1769
Target and stoploss will vary according to the market change and it just an financial advive not a confirm call

XAUUSD; DAILY DISTRIBUTIONWill be waiting for redistribution in LTF at POI as a confirmation for sell, until and unless market doesn't break UTAD, XU gonna drop. Seasonal'S say gold goes up in august, which is strong possibility; but I can’t tell if they're going below may'S low, 1786, then shoot up or just stay sideways then shoot up. Overall it's near to critical zones for decision bullish or bearish.
