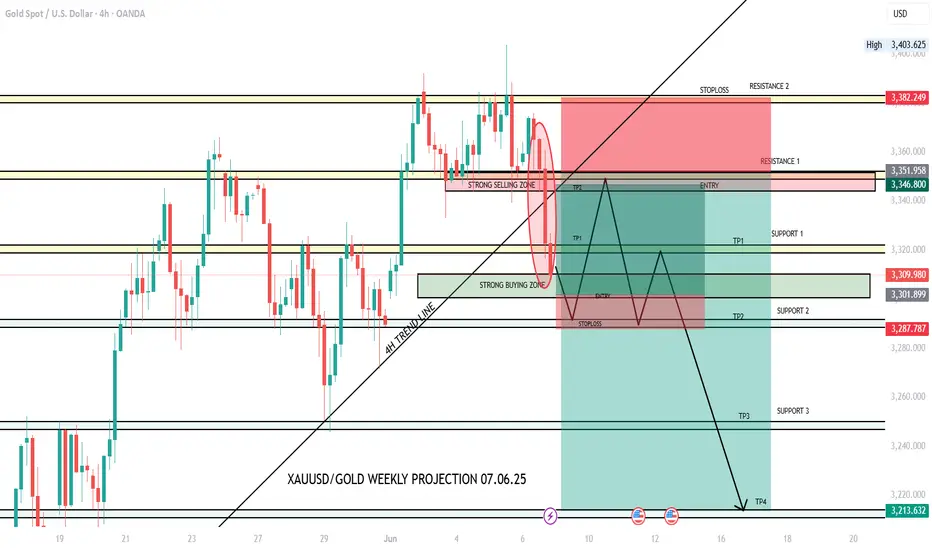
XAUUSD/GOLD WEEKLY PROJECTION 07.06.25Strong Selling Zone: Area near the top, where price has been rejected multiple times.
Strong Buying Zone: Area near the bottom, suggesting demand or potential price support.
Trend Line: Uptrend line intersecting around the strong buying zone — potential bounce area.
Resistance & Support Levels:
Resistance 1 & 2
Support 1, 2, & 3
Xauusdforex
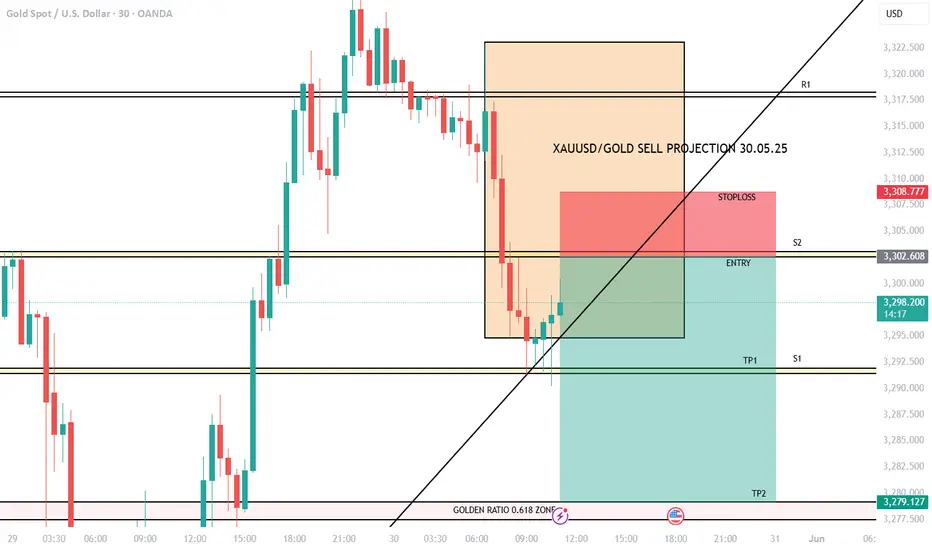
XAUUSD/GOLD SELL PROJECTION 30.05.25The red zone above the entry point marks the risk (stop loss), while the larger green zone below indicates the potential reward (profit targets TP1 and TP2), implying a favorable risk-to-reward ratio.
XAUUSD/GOLD SELL PROJECTION 29.05.25R1 (Resistance): Just above entry, marking the recent high.
S1 & S2 (Support levels): Intermediate levels where price might pause or bounce.
Low Zone: Aligns with TP2, marking a significant potential support zone.

XAUUSD/GOLD 30MIN SELL PROJECTION 28.05.25Bias: Bearish (Sell)
Pattern Identified: Evening Star (Bearish Reversal Pattern)
Entry Zone: Around 3,318.4 (just below the resistance marked S2)
Stop Loss: Just above the high of the Evening Star (~3,323.7)
Take Profits:
TP1: Around 3,311.0
TP2: Around 3,303.9 (near support S1)

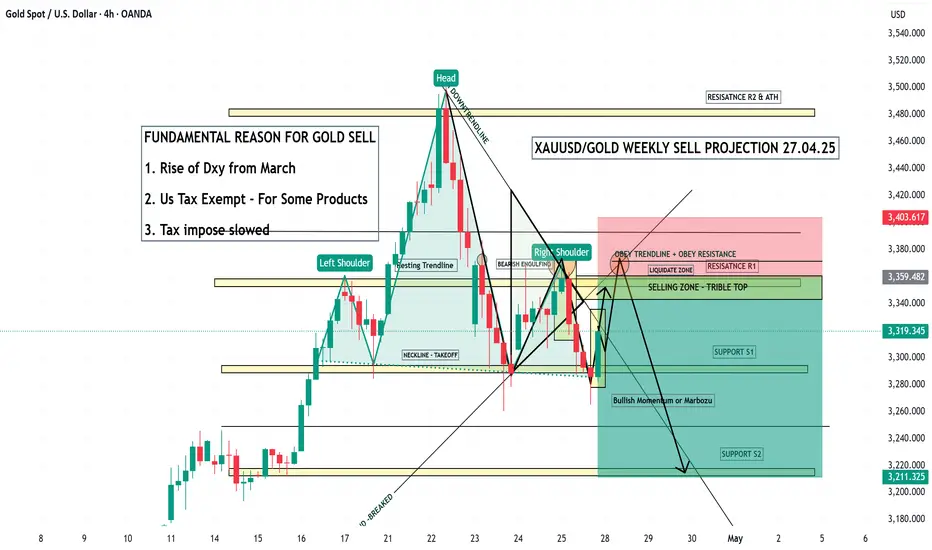
XAUUSD/GOLD WEEKLY PROJECTION 27.04.25Rise of the DXY (US Dollar Index) since March.
US Tax exemptions for some products.
Slower imposition of new taxes.
Technical Chart Summary:
Pattern: Head and Shoulders (classic bearish reversal setup).
Key Zones:
Selling Zone: Identified between Resistance R1 and Triple Top area.
Resistance Levels:
R1 near 3359–3400
Major resistance at around 3480–3500 (All-Time High zone).
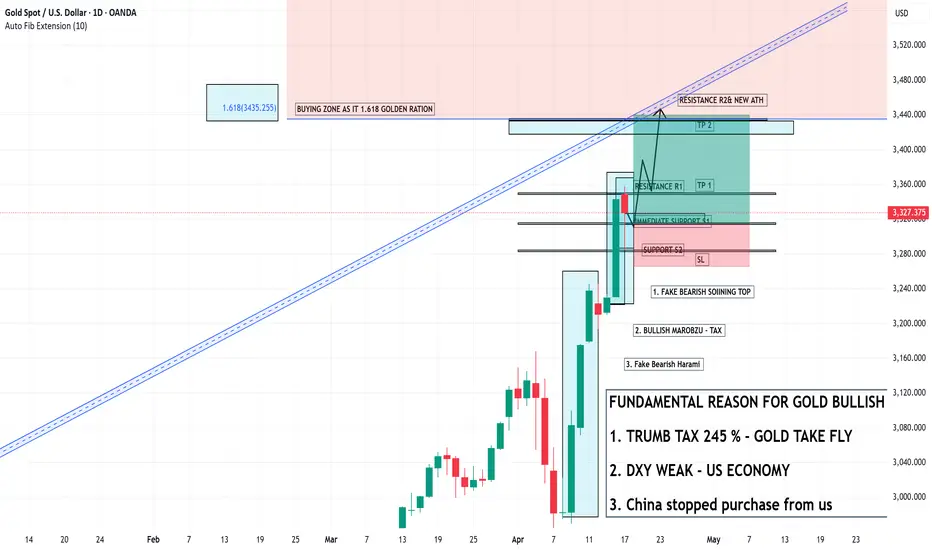
XAUUSD/GOLD WEEKLY PROJECTION 20.04.25Buying Zone around the 1.618 Golden Ratio (3435.255) – A classic Fibonacci extension target indicating a strong potential reversal or take-profit zone.
Price Movement Forecast:
Price is expected to test the Immediate Support (S1) and bounce back.
Resistance levels: R1, then R2 & New ATH (All-Time High).
Take Profits (TP1 & TP2): Clearly marked targets for bullish momentum continuation.
Candlestick Patterns:
Fake Bearish Spinning Top
Bullish Marubozu
Fake Bearish Harami
These patterns typically suggest false bearish signals and continuation of the uptrend.
Short idea This is just an idea 💡. No advice for trading
One can look for sell @2922-2925
And Tragets will be
T1- 2903
T2- 2888
T3- 2865
T4- 2845
SL- 2933
If anybody want to trade then trade as per your risk management 🙏🙏🙏
Thank you 🙂

XAUUSD/GOLD WEEKLY PROJECTION 03.03.25A primary reason for gold price falls is a strong US dollar, as gold has an inverse relationship with the dollar, meaning when the dollar strengthens, gold prices tend to decrease; other factors include rising interest rates, which can make alternative investments more attractive to investors, leading to decreased demand for gold, and a stable economic environment that reduces the need for gold as a safe haven asset

XAUUSD/GOLD WEEKLY BUY PROJECTION 26.01.25Gold prices are affected by many factors, including inflation, geopolitical tensions, and demand. When demand for gold increases, the price of gold also increases

XAUUSD/GOLD WEEKLY BUY PROJECTION 12.01.25According to market analysts, this steady rise in gold prices could be attributed to a combination of factors, including geopolitical tensions, changes in interest rates, and robust demand from key markets like India.

XAUUSD/GOLD WEEKLY SELL PROJECTIONA "gold sell-side movement" refers to a situation in the gold market where there is a significant selling pressure, meaning more investors are looking to sell their gold holdings than buy, causing the price of gold to decline; essentially, the "sell side" of the market is driving the price downward due to increased selling activity.

Gold Trading Levels for 09th December 2024Gold Trading Levels and Analysis
Gold has been consolidating for the past week, indicating a potential breakout is imminent.
Here are the key levels and details:
Buy Setup
Entry: Buy above 2,643 if the price breaks and closes above this level, signaling an upward breakout.
Targets:
2,700-2,710
Stop Loss: Below the low of the breakout candle for risk management.
Sell Setup
Entry: Sell below 2,624 if the price breaks and closes below this level, signaling a downward breakout.
Targets:
2,560-2,550
Stop Loss: Above the high of the breakdown candle.
Market Context
Gold has been trading in a tight range, creating pressure for a potential breakout in either direction. This week’s market movement could determine the direction, so watch for the key levels closely.
Disclaimer
The above analysis is provided for educational purposes only and is not intended as financial or investment advice.
Trading in commodities carries risk, and past performance is not indicative of future results.
Please perform your own research or consult a certified financial advisor before making any trading decisions.
Always trade responsibly and use proper risk management techniques.

XAUUSD WEEKLY BUY PROJECTION its price increases in response to events that cause the value of paper investments, such as stocks and bonds, to decline.

Gold Trading Strategy for 21st November 2024.Gold Price Strategy (1-Hour Candle Rejection and Breakout)
STRATEGY 1
Current Price: 2650.46
Sell Setup (Rejection at 2667-2668)
Condition: If the 1-hour candle closes below 2667-2668 (indicating rejection), look for a potential downside.
Entry: Enter a sell trade when the next 1-hour candle breaks the low of the rejected candle.
Targets:
T1: 2638 (first target for partial booking).
T2: 2618 (secondary target).
Stop-Loss: Place SL above the high of the rejected candle (e.g., 2675).
Buy Setup (Breakout Above 2668)
Condition: If the 1-hour candle closes above 2668, confirm bullish momentum.
Entry: Enter a buy trade when the next 1-hour candle breaks the high of the breakout candle.
Targets:
T1: 2685 (first target).
T2: 2700 (psychological resistance).
Stop-Loss: Place SL below the low of the breakout candle (e.g., 2660).
Risk Management
Risk no more than 1-2% of your trading capital per trade.
Adjust your position size based on the distance between your entry and stop-loss.
Example Scenarios:
Sell Setup Example:
Candle closes at 2665 after touching 2667-2668.
Next candle breaks 2660 (low of rejection candle).
Entry at 2660, SL at 2675, Targets: 2638 and 2618.
Buy Setup Example:
Candle closes at 2670 after breaking 2668.
Next candle breaks 2672 (high of breakout candle).
Entry at 2672, SL at 2660, Targets: 2685 and 2700.
STRATEGY 2
Gold Price Analysis
Current Price: 2650.46
Buy Above: 2668
Sell Below: 2618
Key Levels:
Resistance Levels:
R1: 2668
R2: 2685
R3: 2700
Support Levels:
S1: 2635
S2: 2618
S3: 2600
Disclaimer:
This analysis is for educational purposes and should not be considered as financial advice. Market movements can be volatile, and strategies must be backtested before use. Consult a financial advisor before executing trades. Trading involves significant risk, including the potential loss of your entire capital.

Gold Trading Strategy for 14th November 2024Gold Trading Strategy: Buy Above 2,586 / Sell Below 2,568
Current Price: 2,574.00 USD
Key Levels:
Buy Signal: If the price closes above 2,586 on the one-hour candle, it indicates a potential upward trend, suggesting a good time to consider buying.
Sell Signal: If the price closes below 2,568 on the one-hour candle, it suggests a potential downward trend, indicating it might be a good time to consider selling.
Market Analysis:
The current price is hovering around 2,574.00 USD, just below the buy signal level.
It's important to monitor the price closely, especially around the 2,570 to 2,590 levels, which could act as support or resistance.
Recommendations:
Buy: If the price sustains above 2,586 on the one-hour candle close, consider entering long positions. Book profit at regular intervals or use a trailing stop loss to protect your profit, with targets at 2,600 and 2,615.
Sell: If the price breaks below 2,568 on the one-hour candle close, consider short positions. Book profit at regular intervals or use a trailing stop loss to protect your profit, with targets at 2,550 and 2,535.
Disclaimer: This is only for educational purposes. You may do your own analysis before taking any trading decisions.

GOLD SHOWING A GOOD UP MOVE WITH 1:10 RISK REWARDGOLD SHOWING A GOOD UP MOVE WITH 1:10 RISK REWARD
DUE TO THESE REASON
A. its following a rectangle pattern that stocked the market
which preventing the market to move any one direction now it trying to break the strong resistant lable
B. after the break of this rectangle it will boost the market potential for break
C. also its resisting from a strong neckline the neckline also got weeker ald the price is ready to break in the outer region
all of these reason are indicating the same thing its ready for breakout BREAKOUT trading are follws good risk reward
please dont use more than one percentage of your capitalfollow risk reward and tradeing rules
that will help you to to become a bettertrader
thank you

Gold future PredictionI make 2 prediction for future for trade in gold curently gold touch the price all time high 2530.00 then after its make 2470.00 low and now i have 2 scenario for gold so if its break high then after a big spike in market 2590.00 and its falling down and its make 2 target 2407.00 2353.00.

XAUUSD SHOWING A GOOD DOWN MOVE WITH 1:7 RISK REWARDXAUUSD SHOWING A GOOD DOWN MOVE WITH 1:7 RISK REWARD
DUE TO THESE REASON
A. its following a rectangle pattern that stocked the market
which preventing the market to move any one direction now it trying to break the strong resistant lable
B. after the break of this rectangle it will boost the market potential for break
C. also its resisting from a strong neckline the neckline also got weeker ald the price is ready to break in the outer region
all of these reason are indicating the same thing its ready for breakout BREAKOUT trading are follws good risk reward
please dont use more than one percentage of your capitalfollow risk reward and tradeing rules
that will help you to to become a bettertrader
thank you
XAUUSD SHOWING A GOOD DOWN MOVE WITH 1:7 RISK REWARD
DUE TO THESE REASON
A. its following a rectangle pattern that stocked the market
which preventing the market to move any one direction now it trying to break the strong resistant lable
B. after the break of this rectangle it will boost the market potential for break
C. also its resisting from a strong neckline the neckline also got weeker ald the price is ready to break in the outer region
all of these reason are indicating the same thing its ready for breakout BREAKOUT trading are follws good risk reward

A decending triangle patterns showing on XAUUSD WITH 1:10 RRA decending triangle patterns showing on XAUUSD
A short term 15m tradeing setup showing on gold
Selling setup
With a risk reward ratio of 1:10
The setup giving clarity to selling because in longterm it's a Down TREND
Also in a pick top lable
And forming a DOWN setup
So according to the combine results of
15minit 1hour and daily chat
And the short term setup
All are of them indicating the same SELLING SETUP
A decending triangle patterns showing on XAUUSD
A short term 15m tradeing setup showing on gold
Selling setup
With a risk reward ratio of 1:10
The setup giving clarity to selling because in longterm it's a Down TREND
Also in a pick top lable
And forming a DOWN setup
So according to the combine results of
15minit 1hour and daily chat
And the short term setup
All are of them indicating the same SELLING SEUP

GOLD SHOWING A GOOD UP MOVE WITH 1:10RISK REWARDGOLD SHOWING A GOOD UP MOVE WITH 1:10RISK REWARD
DUE TO THESE REASON
A. its following a rectangle pattern that stocked the market
which preventing the market to move any one direction now it trying to break the strong resistant lable
B. after the break of this rectangle it will boost the market potential for break
C. also its resisting from a strong neckline the neckline also got weeker ald the price is ready to break in the outer region
all of these reason are indicating the same thing its ready for breakout BREAKOUT trading are follws good risk reward
please dont use more than one percentage of your capitalfollow risk reward and tradeing rules
that will help you to to become a bettertrader
thank you

XAUUSD/GOLD 04.08.24 DETAILED SELL PROJECTIONAfter coming within a touching distance of a new all-time high near $2,480 with the immediate reaction to disappointing US labor market data on Friday, Gold reversed its direction and declined below $2,420. Profit-taking ahead of the weekend might be weighing on XAU/USD

XAUUSD 1H Sell Projection Customs duty cuts: The Indian government announced cuts to customs duty on gold in the Union Budget 2024, reducing it from 15% to 6%.
Concerns over demand in China: Demand for gold in China may also have contributed to the price drop.
Better-than-expected US data: Better-than-expected US Q2 GDP and jobless claims data may have also put downward pressure on gold prices.

XAUUSD BUY & SELL PROJECTION 27.02.24Buy Reason
The allure of non-yielding bullion tends to increase when interest rates are lowered because the opportunity cost of holding gold decreases. Investor sentiment has played a significant role in the recent spike in gold prices. The current market positioning reflects a strong bullish outlook on gold.
Sell Reason
The reasons why gold prices may experience a fall in value include an excess of supply relative to demand and shifts in investor sentiment. A strong dollar and rising interest rates can also hurt the price of gold, as can low inflation.
