technical analysis for your chart on Gold (XAU/USDCurrent Price: $4,002
Trend Structure: The pair is showing a potential reversal setup after a completed downward channel.
Recent Pattern: Price has broken slightly above the descending channel and is now retesting the breakout zone around the support level ($3,950–$3,980).
🔹 Key Technical Levels
Support Zone: $3,940 – $3,980
→ Strong accumulation area shown by multiple rejections and previous demand.
Immediate Resistance: $4,080 – $4,120
→ Minor resistance expected as the first hurdle after breakout.
Major Resistance (Target): $4,385
→ Marked as the final bullish target on the chart.
📈 Bullish Scenario
If price sustains above $4,000, we can expect:
A short-term retest of $4,080–$4,120.
Once momentum confirms above $4,120, bullish continuation toward $4,200 → $4,385 (main target).
✅ Buy Confirmation:
Break and close above $4,050 with volume.
Retest of $4,000 zone followed by bullish rejection candle.
🎯 Bullish Targets:
TP1: $4,080
TP2: $4,200
TP3: $4,385
📉 Bearish Scenario
If price rejects $4,000 and closes below the support zone ($3,950):
Downside may resume toward $3,880 – $3,820 range.
That would invalidate the bullish breakout and confirm channel continuation.
🚫 Sell Trigger:
3H close below $3,940.
🎯 Bearish Targets:
TP1: $3,880
TP2: $3,820
📊 Conclusion
Structure is shifting from bearish to bullish after a channel breakout.
The $3,950–$4,000 area is key — a stronghold for bulls.
Expect a bullish rally if support holds, targeting $4,385 in the medium term. NSE:NIFTY1! NSEIX:NIFTY1! MCX:GOLD1! MCX:CRUDEOIL1! MCX:NATURALGAS1! MCX:SILVER1! NSE:BANKNIFTY1! CME_MINI:NQ1! MCX:GOLDM1! COMEX:GC1! MCX:SILVERM1! MCX:GOLDPETAL1!
Xauusdlong

XAU/USD — Rejection Expected from Resistance Zone for Bearish CoCurrent Price: $4,005
Resistance Zone: $4,020 – $4,040
Gold is approaching a strong resistance area that previously triggered a pullback.
Trend Structure:
The market is moving inside a short-term ascending channel, but momentum shows signs of exhaustion near the upper boundary.
Key Observation:
A false breakout or rejection at the resistance could initiate a downward correction.
Bearish Signal Setup:
Entry Zone (Sell): $4,015 – $4,035 (look for rejection candles or bearish engulfing near resistance)
Target 1: $3,960
Target 2 (Main Target): $3,913
Stop Loss: $4,045 above resistance zone EUREX:FDAX1! ICEEUR:RC1! ICEEUR:BRN1! ICEEUR:WBS1! EUREX:FESX1! EUREX:FGBL1! EUREX:FDXM1!
Risk/Reward Ratio: Approx. 1:2.5
Confirmation:
Wait for bearish confirmation candle on 15M or 30M timeframe.
Break below $3,980 will strengthen bearish momentum toward target.
Signal Summary (📉 Sell Setup):
Direction Entry TP1 TP2 SL ICEEUR:Z1! ICEEUR:W1! EUREX:FGBM1! EUREX:FGBS1! EUREX:FGBS1! ICEEUR:GWM1! EUREX:FXXP1! EUREX:DOWF1! ICEEUR:XZ1!
🔻 SELL 4,015 – 4,035 3,960 3,913 4,045

technical analysis for your XAU/USD (Gold vs USD) chart:XAU/USD (Gold) 15-Min Chart Analysis – 29 Oct 2025
Market Structure
The previous descending channel has been broken to the upside, indicating a potential trend reversal from bearish to bullish.
Price retraced back to a support level zone (≈ $3,920 – $3,940), where buyers are likely to defend.
Key Levels
Support Zone: 3,920 – 3,940
→ Price already tested this area with strong rejection wicks, showing buyer interest.
Resistance Zone: 3,980 – 4,020
→ Short-term resistance; a breakout above 4,020 confirms bullish momentum.
Target Level: 4,142
→ As marked on your chart, this is the projected bullish target after confirmation of upward continuation.
Price Action
After a downward correction, gold found support and formed a double-bottom-type pattern near the 3,940 level.
Price is currently consolidating above support, signaling potential accumulation before an upward push.
Momentum Outlook
If price holds above 3,940, expect a move towards 4,000 → 4,020, followed by a breakout to 4,142 (target).
However, if 3,920 support breaks, the price may retest 3,880–3,860, resuming short-term bearish momentum.
📈 Trading Bias
Bullish bias above 3,940 (target 4,142).
Bearish only below 3,920 (target 3,860). EURONEXT:NH7X2025 EURONEXT:PE6X2025 EURONEXT:PE7X2025 EURONEXT:A57X2025 EURONEXT:AJ7X2025 EURONEXT:AJ7X2025 EURONEXT:B16X2025 EURONEXT:B17X2025 EURONEXT:BC6X2025 EURONEXT:BC7X2025 EURONEXT:BC8Z2025 EURONEXT:FE6X2025 EURONEXT:MH7X2025

Gold (XAU/USD) 4H Chart Analysis – Short-Term Reversal from ?Technical Overview:
Gold has recently rebounded from a High Demand Zone around the $3,900–$3,910 region, showing clear signs of buyer re-entry after a prolonged bearish correction. The candle structure suggests strong bullish intent, with higher lows forming and a potential continuation toward the next liquidity area.
Key Observations:
🔹 High Demand Zone: Price reacted strongly here, indicating institutional buying pressure.
🔹 High Prop POI (Point of Interest): Served as a key accumulation level before the breakout.
🔹 SMC Trap: Indicates a prior liquidity grab, trapping late sellers before the move up.
🔹 Bullish Momentum Building: Consecutive bullish candles after rejection from the demand zone strengthen the reversal bias.
Target Projection:
🎯 Immediate Target: $4,080 – $4,100 (aligned with local resistance and liquidity grab zone).
🛑 Support: $3,905 (must hold to maintain bullish structure).
💎 Extended Target (if momentum continues): $4,160 – $4,180 (previous major swing high zone).
Summary:
Gold is showing a short-term recovery phase within a broader bullish structure. A confirmed 4H close above $4,030 would likely propel price toward the $4,100 region, while a drop below $3,900 would invalidate the bullish setup.
📊 Suggested Title:
"Gold Rebounds from Key Demand Zone, Eyes $4,100 Resistance 🔥"

“Gold Rebounds from Demand Zone — Short-Term Recovery Ahead”Analysis:
Gold (XAU/USD) on the 4-hour chart shows a strong corrective decline after forming an SMC trap near the 4,250–4,300 zone, where liquidity was swept before a sharp selloff. Price has now reached the High Probability POI (Point of Interest) around the 3,850–3,880 region, showing early signs of a bullish reaction.
The recent candle structure indicates buyers are stepping in from this demand zone, confirming a potential short-term reversal. If momentum sustains, the first target zone lies around 3,950–3,980, aligning with minor resistance and previous imbalance fill.
Outlook:
📈 Bias: Bullish correction (short-term)
🧭 Key Support: 3,850 – 3,880
🎯 Target: 3,950 – 3,980
⚠️ Invalidation: Break below 3,840 may reopen bearish continuation toward 3,780

Gold at Key Support — Will XAUUSD Bounce From 3900 - 3895?Gold is testing a crucial demand zone at 3900–3895, where buyers have previously stepped in.
If this level continues to hold, we could see a bullish intraday rebound play out.
📊 Trade Setup
Buy Zone: 3900 – 3895
Stop Loss: 3878
Target 1: 3924
Target 2: 3936
💡 Technical Outlook
Price action is hinting at renewed buying pressure around 3900, with candles showing wicks and slowing momentum on the downside.
This could indicate that bulls are defending this key zone, setting up for a short-term bounce toward the 3920–3935 area.
Watch for:
A bullish engulfing candle or strong rejection wick near 3895
Increasing volume confirmation on smaller timeframes (M15–H1)
🧭 Bias
✅ Expecting a bullish bounce from the 3900–3895 zone
❌ Invalidated if price closes below 3878
⚠️ Disclaimer
This is for educational purposes only — not financial advice. Always manage your risk and use proper position sizing.

Gold Breaks Key Support Zone — Bearish Momentum Builds Below $4,Analysis:
The XAU/USD (Gold vs. USD) 45-minute chart shows a clear breakdown below the established support zone, indicating a shift in market sentiment from consolidation to bearish momentum.
The support zone around $4,050 – $4,000 had previously held multiple times, acting as a strong demand area.
The recent breakout below this zone confirms a potential trend continuation to the downside.
Price action suggests a bearish pattern with lower highs and lower lows forming before the breakout.
A retest of the broken support (now resistance) may occur before the next leg lower.
The next major target lies near $3,900 – $3,850, aligning with the projected measured move.
Technical Outlook:
If gold fails to reclaim the $4,050 level, further downside pressure remains likely. However, a close back above this level could invalidate the bearish breakout and signal a possible false break.

Gold (XAU/USD) Technical AnalysisAnalysis:
Gold is currently trading around 4,120, showing a minor bullish correction within a descending channel. The price has bounced from the support buy zone (4,040–4,060), indicating buyer activity at this level. However, the structure remains bearish in the short term as long as the price stays below the descending trade line.
A possible scenario is a short-term pullback toward the upper trade line before another retest of the support zone. If the support holds again, a bullish reversal could target the 4,383 level, aligning with the upper boundary of the previous high.
Key Levels:
Support Zone: 4,040 – 4,060
Resistance (Trade Line): 4,180 – 4,200
Target (Bullish): 4,383
Outlook:
Neutral-to-bullish in the medium term if the support zone remains intact. A break below 4,040 would invalidate the bullish setup and signal further downside continuation. KSE:GFH KSE:AGLTY KSE:SENERGY KSE:KFH KSE:CLEANING KSE:NCCI KSE:EKTTITAB KSE:EQUIPMENT KSE:NIH KSE:THURAYA KSE:FUTUREKID KSE:ALEID KSE:URC KSE:URC KSE:ARKAN

Gold Rebounds from Extreme POI – Bullish Move Building UpAnalysis:
Gold (XAU/USD) has shown a strong recovery after tapping into the Extreme Point of Interest (POI) zone, signaling the potential start of a bullish reversal.
The chart indicates an SMC Trap (Smart Money Concept Trap), where liquidity was swept below previous lows to trigger sell stops before reversing upward — a classic smart money accumulation pattern.
Price reacted sharply from the Extreme POI, forming higher lows, which confirms renewed buyer interest.
The immediate target area lies around $4,180 – $4,200, aligning with the projected bullish arrow.
Below, the High Probability POI remains as a deeper demand zone — a strong confluence area if price retests.
📊 Conclusion:
Gold is showing signs of bullish structure recovery after liquidity sweep. Holding above the Extreme POI zone strengthens the case for continued upside movement toward $4,200 and possibly higher.

Gold Breakout Potential: Descending Wedge Signals Bullish ReversAnalysis:
The XAU/USD (Gold vs. USD) chart on the 45-minute timeframe shows price action forming a descending wedge pattern, a typically bullish reversal formation. The price has been compressing between lower highs and lower lows but is now testing the upper trendline resistance, indicating a possible breakout.
Key observations:
Trendline Breakout Zone: The narrowing wedge suggests weakening bearish momentum. A confirmed breakout above the trendline could trigger strong upward momentum.
Targets: The projected upside targets are around 4,300, 4,400, and 4,500, aligning with previous resistance zones.
Support Zone: Immediate support remains near 4,050–4,000, where the lower wedge boundary provides buying interest.
Momentum Indicator: Gradual bullish recovery and decreasing downside pressure indicate renewed buyer strength.
technical analysis for XAU/USD (Gold) based on your chart:Chart Summary
Current Price: Around $4,140
Trend Lines: A descending trade line shows the overall short-term bearish trend.
Support Zone: Clearly marked between $4,080 – $4,120 (“SUPPORT BUY ZONE”).
Target: The upside target is labeled near $4,383.
Technical Outlook
🔹 Support Zone Reaction
Price recently dipped into the support buy zone, forming a potential bullish reversal wick.
This area is acting as a strong demand zone, attracting buyers around $4,100.
🔹 Downtrend Channel
The pair remains under a downward-sloping trade line, suggesting the short-term market bias is still bearish.
However, a breakout above this trendline could trigger bullish continuation toward the $4,383 target.
🔹 Short-Term Scenario
Bullish Case (Primary Plan):
If gold holds above the support zone ($4,080–$4,120) and breaks the trendline resistance (~$4,200),
→ next target area: $4,300–$4,383.
Confirmation comes with a clear candle close above $4,200.
Bearish Case (Alternative Plan):
If price fails to break the descending trade line and drops below $4,080,
→ possible continuation toward $4,040 – $4,000.
Key Levels
Type Level (USD) Description
🎯 Target 4,383 Major resistance / profit zone
⚔️ Resistance 4,200 Descending trendline zone
🛒 Support Zone 4,080–4,120 Demand / Buy zone
❌ Invalid Below 4,080 Break below = bearish continuation
Summary
📈 Gold (XAU/USD) is currently retesting its support zone, showing early signs of a bullish rebound.
A confirmed breakout above the trendline could lead to a rally toward $4,380.
However, losing support below $4,080 would invalidate the bullish setup and reintroduce downside risk. EUREX:FDAX1! ICEEUR:BRN1! ICEEUR:WBS1! EUREX:FESX1! EUREX:FGBL1! EUREX:FDXM1! ICEEUR:GWM1! ICEEUR:Z1! EUREX:FDXS1! EUREX:FGBM1! ICEEUR:W1! ICEEUR:RC1!

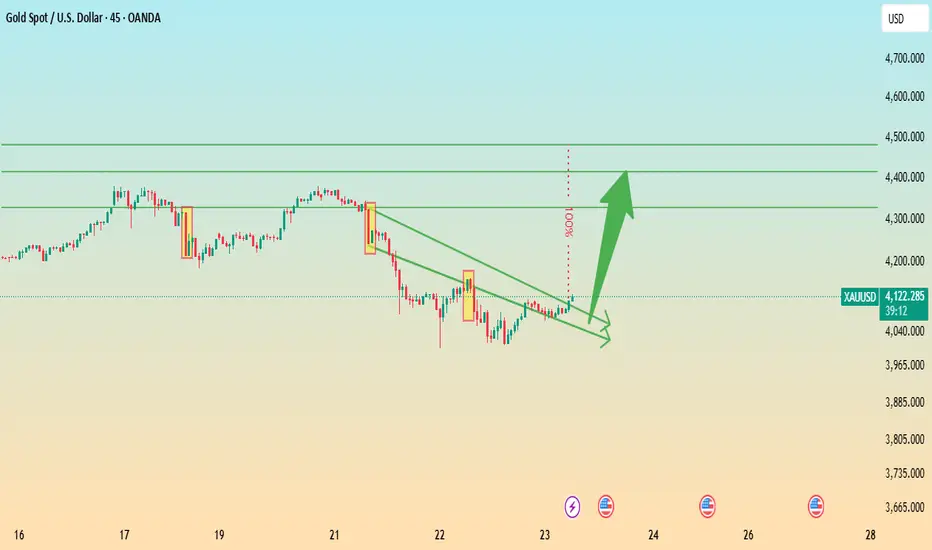
Gold (XAU/USD) Potential Bullish Reversal Setup – Entry Zone For**Analysis:**
The chart illustrates a possible bullish reversal scenario after a recent downward move in Gold (XAU/USD). The marked *Change of Character (ChoCH)* indicates an early sign of a trend shift from bearish to bullish momentum.
Price has entered a **consolidation zone** near the support area, where the **entry level** is highlighted. This zone suggests accumulation and potential preparation for an upward move.
The setup shows:
* **ENTRY:** Around current support, within the highlighted range.
* **STOP:** Below the recent low, providing risk control if the reversal fails.
* **TARGET:** The projection points to a **100% measured move**, aligning with a strong bullish continuation potential toward 4,700 levels.
If price maintains structure and confirms a breakout above the short-term resistance, it may initiate a new **bullish impulse phase**.

XAUUSD/GOLD WEEKLY SELL PROJECTION 19.10.25(XAUUSD/GOLD 4H Weekly Sell Projection — 19.10.25):
🟡 Chart Overview
Instrument: XAUUSD (Gold/USD)
Timeframe: 4H (4-hour)
Projection: Bearish/Sell
Pattern Date: 19 October 2025
📊 Key Technical Structure
Trend Channel:
The price has been moving in an upward trend channel.
It reached the upper boundary near the 4,448.371 level (All-Time High/Resistance R2).
Reversal Formation:
A Three Black Crows candlestick pattern is formed at the top — a classic bearish reversal signal indicating potential downtrend continuation.
Strong Bearish Momentum followed this pattern.
Breakout Zone:
Price broke below the ascending channel.
“Breakout Zone Retest & Obey” suggests the price tested the previous support as new resistance.
Support & Resistance Zones:
R2 / ATH: 4,448.371
R1 / Fair Value Gap: ~4,281.132
Last Week Low Support S1: ~4,175–4,225 zone
Support S2: ~4,093.117
Potential final target around the lower support zone.
📉 Trade Projection
Entry Zone: Around 4,281–4,321 (after retest confirmation).
Stop Loss: Above 4,321 (previous resistance area).
Take Profit Target: ~4,093 (Support S2 zone).
Risk/Reward: Favorable short setup if bearish momentum continues.
🧭 Additional Notes
“Three Black Crows” near the ATH level adds high probability for a deeper retracement.
If support at 4,175 breaks cleanly, continuation to 4,093 is expected.
Watch for lower-high formations confirming the bearish structure.
A failure to break S1 may lead to a short-term range or bullish pullback.

Gold (XAU/USD) Breakout Rally Toward New HighsAnalysis:
Gold (XAU/USD) continues its strong bullish momentum on the 4-hour chart, forming a series of higher highs and higher lows, confirming a sustained uptrend. The recent breakout above the resistance zone near $4,150–$4,170 indicates renewed buying interest and momentum buildup.
After a brief retest of the breakout area, price has started climbing again — a sign of trend continuation supported by bullish candle formations and strong market sentiment.
Technical Outlook:
Support Zone: $4,140 – $4,170 (previous resistance turned support)
Bullish Confirmation: Continuation pattern with clean structure and volume support
Momentum Bias: Strongly bullish while above $4,150
🎯 Target: $4,300 – $4,320 zone
🛑 Stop Loss: Below $4,140 to limit downside risk
📈 Summary:
As long as gold stays above the breakout level of $4,170, the market remains bullish, with upside potential toward $4,300–$4,320, aligning with the next major resistance area.

Gold Maintains Upward Channel Toward $4320 TargetAnalysis:
The XAU/USD 45-minute chart shows gold continuing its steady rise within a well-defined ascending channel. The price action maintains higher highs and higher lows, confirming a sustained bullish trend.
Currently, gold is testing the midline of the channel, suggesting a possible minor pullback before resuming upward momentum toward the projected resistance near $4320. This level aligns with the upper boundary of the channel, acting as the next potential target zone for buyers.
As long as the price remains above the lower channel support, the bullish structure remains intact. A breakout above $4320 could open further upside potential, while a drop below the channel could signal early weakness or short-term consolidation.

Gold Pullback Opportunity Within Strong Bullish MomentumAnalysis:
The XAU/USD chart shows that gold has maintained a powerful upward trajectory, breaking out of its previous consolidation channel (highlighted in purple). After the breakout, price surged to new highs near 4,120, confirming strong bullish momentum.
Currently, the market is showing a minor pullback toward the 4,090–4,060 zone — a region aligning with previous resistance turned support. This retracement appears healthy and could provide buyers a chance to re-enter before another leg up.
The bullish continuation setup is supported by:
Previous breakout retest: The price is testing the prior resistance area, which could now act as strong support.
Momentum structure: Higher highs and higher lows remain intact.
Favorable risk-reward ratio: The long position targets around 4,180, with stops below 4,060 support.

XAUUSD – Continues to set ATH XAUUSD – Continues to set ATH, prioritise buying according to POC 4,146–4,148 🟡
Gold continues to make higher highs after a strong rise in the Asian session; the upward channel structure remains intact. On H1, POC ~4,147–4,148 is the nearest support point; above is the resistance cluster according to FE 1.618 ~4,186 and the sell zone 4,221–4,240.
Key levels
Support: 4,146–4,148 (POC) • 4,140 (short-term invalid).
Resistance/targets: 4,166 • 4,186 (FE 1.618) • 4,188–4,200 • 4,221 (sell scalping) • 4,240 (sell zone).
Trading scenarios
Buy 1 – POC pullback
Entry 4,146–4,148 | SL 4,140 | TP 4,166 → 4,188 → 4,200 → 4,245.
If it pulls back to POC and H1 shows a confirmation candle/mid-trendline support, prioritise buying.
Buy 2 – Shallow retest
If the price only dips ~4,160–4,162 then rebounds above POC, additional buying is possible with SL 4,152, TP as above.
Sell reaction (higher risk)
Entry 4,240 | SL 4,250 | TP 4,222 → 4,200 → 4,188 → 4,160.
Only trigger when there is a clear rejection signal at 4,221–4,240; this is a counter-trend trade.
Invalidation & management
Buying bias weakens when H1 closes below 4,140 or breaks the lower channel edge.
After TP1, move SL to entry; avoid chasing price in the 4,18x–4,20x area when volume is thin. 🎯
Quick context
The upward momentum is maintained due to expectations of the Fed ending QT/looser conditions and safe haven flows; however, the 4,221–4,240 area may create a short-term reaction before the uptrend continues.
Trade well with this scenario!

Gold breaking new highs has become the norm, 4100 is within reacGold continues its bullish trend, breaking new highs as expected. Breaking new highs has become the norm for gold recently. So far, gold has reached a high of 4080 and is fluctuating around it. It is likely to reach 4100 tonight, and the current level of 4100 is within reach. Breaking new highs from above has become commonplace. Don't expect bears to hold out. After all, bulls are the main force. Looking at the hourly chart, various indicators are driving the bulls, and international news is also positive for gold prices. Therefore, we must maintain a bullish outlook for gold. Mr. Tian will also prioritize long positions. Keep an eye on the support at 4000. Trading strategies should focus on buying on dips.
Based on the 4-hour market trend, short-term support is currently at 4095-4100, with a focus on key support at 4075-4085. The bulls are rallying strongly and there is no end in sight. Trading strategies should prioritize buying on dips. In the intermediate range, be cautious and follow orders carefully, patiently waiting for key entry points. I will provide detailed trading strategies during the trading session, so stay tuned.
Gold Trading Strategy:
1. Buy gold at 4070-4080. Add to long positions if it dips back to 4060-65. Stop loss at 4060. Target at 4130-4150. Hold if it breaks through.

Gold (XAU/USD) Rebound Setup – Support Holding Strong!Analysis:
Gold (XAU/USD) is showing signs of bullish strength after testing the $4,000–$3,970 support zone, where buyers are stepping back in. The recent consolidation above support suggests a potential reversal and continuation of the uptrend.
The setup highlights:
Support Zone: Around $3,970 – $4,000, acting as a key accumulation area.
Bullish Trigger: A breakout above minor resistance could drive momentum higher.
Targets:
🎯 Target 1: $4,101
🎯 Target 2: $4,150
🎯 Target 3: $4,200
Stop Loss: Below $3,970 to protect against a downside breakout.
📈 Outlook: As long as price sustains above support, Gold remains bullish, aiming for a breakout towards $4,150 and $4,200 levels.

Gold Maintains Bullish Momentum Within Ascending ChannelAnalysis:
The XAU/USD (Gold Spot) 1-hour chart shows a strong upward trend within a well-defined ascending channel. Price action continues to form higher highs and higher lows, indicating sustained bullish momentum.
Currently, gold is trading near $3,959, staying comfortably above the trendline support, which has repeatedly acted as a dynamic base for buyers. The projected movement (blue arrow) suggests a potential short-term retracement toward the lower channel boundary, followed by a rebound toward the upper resistance zone around $4,000–$4,035.
As long as gold remains above the trendline, the bullish structure remains intact. A breakout above the upper boundary could signal further upside potential, while a drop below the trendline may lead to short-term consolidation.
Summary:
Trend: Bullish
Support: $3,915 – $3,925 (trendline zone)
Resistance: $3,995 – $4,035
Bias: Buy on dips near trendline support for potential continuation toward new highs.

"Gold 'Buy the Dip' Opportunity Targeting the $4,000 Level"Technical Analysis
This is a classic bullish continuation setup. Here's a breakdown of the key elements:
Prevailing Trend: The chart shows a strong bullish impulse wave, indicated by the series of large green candles. This establishes the short-term trend as upward.
Corrective Pullback: After reaching a local high (around $3,980), the price is currently in a corrective phase, pulling back towards a potential support level. This is normal and healthy price action in an uptrend.
Support Zone: The red rectangle you've highlighted from approximately $3,950.00 to $3,956.00 is a well-defined area of potential support. This zone represents a previous level of consolidation and the base of the last major push upwards, making it a likely area for buyers to step back in.
Trade Idea: The projected path you have drawn suggests an expectation that the price will dip into this support zone, find buying pressure, and then continue its upward trajectory. This is often referred to as a "buy the dip" strategy.

“Gold Price Action: Bullish Momentum with Key Correction ZonesAnalysis of XAU/USD (Gold Spot)
The chart shows a clear uptrend channel, supported by higher highs and higher lows.
Price recently pulled back after testing the $3,915 zone, which is acting as a short-term resistance.
Multiple support zones are highlighted (around $3,760 and $3,700), which can provide strong buying opportunities on retracement.
The structure suggests impulse–correction–impulse movement, aligning with bullish continuation patterns.
Bullish Scenario
If price holds above the $3,760–$3,780 support, continuation towards $3,915 (previous high) is expected.
A breakout above $3,915–$3,920 will open the door for further upside, targeting $3,960–$3,980.
Bearish Scenario
If price breaks below the trendline support (~$3,760), deeper correction is possible toward $3,680–$3,640 (TP1 zone).
That zone is mentioned on the chart as a strong re-entry point for long positions.
✅ Suitable Target (Bullish):
Immediate Target: $3,915 (previous high)
Extended Target: $3,960 – $3,980
⚠️ Correction Target (Bearish Pullback):
$3,680 – $3,640 (strong buy zone for re-entry)

Gold Maintains Bullish Momentum Above Uptrend SupportAnalysis:
The 1-hour chart of XAU/USD shows a strong upward trendline, which has been consistently respected by price action. After a clear bullish momentum breakout around September 25th, gold has continued to post higher lows, confirming buyers’ control of the market.
Currently, gold is trading at $3,878, consolidating just below the $3,924–$3,935 resistance zone. The chart suggests two possible scenarios:
Continuation: If the price respects the upward trendline and breaks above the $3,924–$3,935 resistance, gold could aim for new highs, extending the bullish run.
Short-Term Pullback: A minor correction to retest the trendline is possible, but as long as the trendline holds, the bullish structure remains intact.
Technical Outlook:
Support: $3,855 / $3,785
Resistance: $3,924 – $3,935
Trend: Strongly bullish, supported by ascending trendline
Bias: Buy on dips towards the trendline, targeting a breakout above $3,935
