“Gold (XAU/USD) – Breakout Play from Resistance (1-Hour View)Chart Structure & Key Levels
You’ve drawn a resistance zone above current price. The label “this is the resistance area here if break we will hold” points to a horizontal resistance line or zone.
You also show a descending trendline acting as dynamic resistance.
On the lower side, you mark LL (Lower Low) and LH (Lower High) points, implying the prior structure was in a downtrend or consolidation.
Your trade setup (green = target area, red = stop area) suggests you are expecting a break above resistance and a move upward with three target levels:
• TP1 at ~ 3,759.74
• TP2 at ~ 3,779.03
• TP3 at ~ 3,799.67
What Your Setup Implies (and Risks)
Bullish Bias on Breakout
You are expecting that if price breaks above the resistance zone + trendline, that resistance may flip into support, allowing the price to rally further. This is a classic breakout reversal expectation.
If the breakout is confirmed (with strong candle close above, ideally with volume), then the path is “clearer” for your targets.
Stop / Risk Control
Your red zone (stop area) is placed below the resistance/trendline region. If price fails and falls back below this, your trade idea would be invalidated.
Target Levels Logic
TP1 is relatively conservative, just above resistance.
TP2 and TP3 stretch further to capture the upside momentum if the breakout has strength.
Additional Considerations & Technical Tips
Confirm the Breakout
Don’t just enter on a quick wick above resistance. Wait for a sustained close above the zone (on your timeframe) to reduce the chance of a false breakout.
Check volume: higher-than-average volume on the breakout gives it more credibility.
Watch for Retest
Often after a breakout, price returns to retest the broken resistance (which now may act as support). This retest can offer a better entry with lower risk.
Manage Risk Aggressively
The more distant your TP3, the more room for price to reverse. Consider scaling out of the trade (taking partial profits as price hits TP1, TP2) to lock in gains.
Keep an Eye on Macro / Fundamental Factors
Gold (XAU/USD) is sensitive to U.S. monetary policy, the strength of the U.S. dollar, inflation expectations, and geopolitical risk.
For example, stronger U.S. data or hawkish Fed statements could work against a bullish breakout in gold.
Divergences & Momentum Indicators
Use RSI / MACD / ADX to check whether momentum supports your breakout idea. If momentum is weak or showing divergence, be cautious.
Timeframe Alignment
Make sure that higher timeframes (4H, daily) are not giving strong bearish signals conflicting with your breakout bias on the 1-hour chart.
Xauusdlong

XAUUSD SHOWING A GOOD UP MOVE WITH 1:10 RISK REWARD GOLD SHOWING A GOOD UP MOVE WITH 1:10 RISK REWARD
DUE TO THESE REASON
A. its following a rectangle pattern that stocked the market
which preventing the market to move any one direction now it trying to break the strong resistant lable
B. after the break of this rectangle it will boost the market potential for break
C. also its resisting from a strong neckline the neckline also got weeker ald the price is ready to break in the outer region
all of these reason are indicating the same thing its ready for breakout BREAKOUT trading are follws good risk reward
please dont use more than one percentage of your capitalfollow risk reward and tradeing rules
that will help you to to become a bettertrader
thank you

Every time gold falls back, it is to reboundGold is no longer in a one-sided rally. Technically, it's undergoing a major correction. Our strategy is to follow the trend and prioritize both long and short positions. Now that we're seeing a major trend, the most common question we receive is whether a major decline has begun or whether gold has peaked. Yesterday's daily chart closed with a negative candlestick pattern, and the previous trading day also saw a vague tombstone candlestick pattern. Currently, we can only confirm short-term resistance, but we can't confirm a major trend peak or a bullish weekly trend. Furthermore, the short-term correction hasn't disrupted the bullish trend, so today we'll maintain a long strategy on pullbacks.
From a 4-hour analysis, effective support remains near the 3718-23 area, with upward pressure focused on the 3756-65 area. Our strategy is to primarily buy on pullbacks. In the intermediate range, be cautious and watchful.
Gold Trading Strategy:
Buy on pullbacks to the 3718-23 area, with a stop-loss at 3709 and a target of 3756-3765.

“XAU/USD 1H – Bullish Continuation from Demand Zone Key Observations:
Uptrend Structure:
Price has been consistently making Higher Highs (HH) and Higher Lows (HL), confirming an overall bullish market structure.
Break of Structure (BOS) levels confirm continuation of the trend.
Market Structure Shift (MSS):
Recently, price created a short-term shift downward (MSS) but retraced into a POI zone (demand area) near 3,646 – 3,659.
Current Setup:
The price bounced from the POI zone and is now recovering upward.
A long position was marked with entry near 3,659, Stop Loss at 3,646, and Target around 3,709.
Bias:
As long as price holds above 3,646 (POI zone), bullish continuation is favored.
If broken below 3,646, bearish correction could extend further.

“Gold Shines Bright | Bullish Momentum Targeting $3,700🔎 Technical Analysis – XAU/USD (1H Chart)
Trend: Strong bullish trend confirmed, with price making higher highs and higher lows.
Buy Zone: Around 3,590 – 3,600 USD, where buyers stepped in aggressively.
Short-Term Target 🎯: 3,650 – 3,700 USD (already highlighted on chart).
Key Support Levels:
3,561 USD (near-term support)
3,490 USD (major support, bullish structure invalidation if broken)
📌 Outlook: As long as price holds above the buy zone, momentum favors bulls with potential continuation toward 3,700+ USD.
🌍 Fundamental Drivers for Gold Bullishness ✨
Federal Reserve Rate Cuts Expectations 🏦⬇️ – If the Fed signals easing or holds a dovish stance, real yields fall → Gold strengthens.
Weakening US Dollar (DXY) 💵📉 – A softer dollar makes gold more attractive to global investors.
Geopolitical Risks 🌍⚠️ – Rising global tensions increase demand for safe-haven assets like gold.
Central Bank Demand 🏦🔒 – Many central banks are adding gold reserves to hedge against currency risks.
Inflation Hedge 📊🔥 – Gold remains attractive when inflationary pressures stay elevated.

XAUUSD/GOLD 1H BUY PROJECTION 16.09.25XAUUSD/Gold 1H Buy Projection (16.09.25). Here’s a breakdown of the key points from your analysis:
🔹 Chart Analysis
Support & Resistance
Support S1: Around 3678 zone.
Minor Resistance Breaked: Price broke above the 3680 resistance area.
Resistance R1 (ATH): Around 3692 – 3696 area.
Entry & Stoploss
Current price: 3683.63
Stoploss: Below 3676 level.
Risk Zone (Red Area): Price should not break below this zone for the buy setup to remain valid.
Target Levels
Target Price 1: ~3688
Target Price 2: ~3692–3696
Indicators
Stochastic Oscillator (top indicator):
Showing a bullish crossover (green line crossing above red), suggesting upward momentum.
RSI (bottom indicator):
Turning upward from 64.47, showing renewed buying pressure.
🔹 Projection
The setup is bullish with expected upward movement from 3683 → 3692 → 3696+.
The chart suggests a possible pullback and continuation before reaching higher targets.
As long as 3680 support holds, momentum favors the upside.

Trading Analysis for Gold Spot / U.S. Dollar (15-Minute Chart)Buy XAU/USD now at 3644.00 level and hold at 3631.00 and target will be specific.
Entry Range 3642.00 to 3644.00
Take Profit 1 = 3646.00
Take Profit 2 = 3650.00
Take Profit 3 = 3654.00
Take Profit 4 = 3658.00
Stock Loss 3631.00
Key News Timings Chart Per.
i will try to update continue.

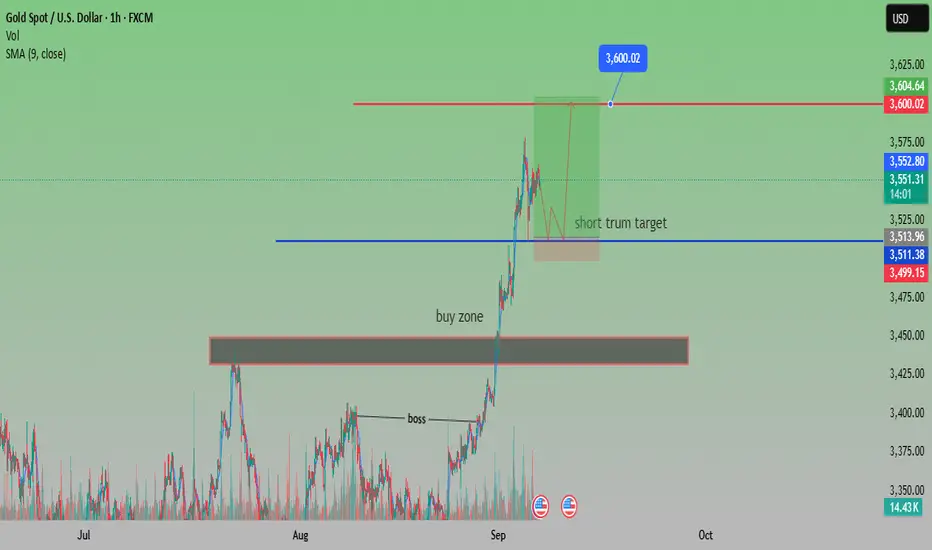
Gold Targets $3,600 After Strong BreakoutAnalysis:
Gold (XAU/USD) continues its bullish rally after breaking above the buy zone near $3,440 and holding strong momentum. The market has recently made higher highs, with price consolidating slightly below the resistance zone.
Currently, gold is trading at $3,548, with the short-term target identified at $3,600. The chart suggests potential consolidation in the highlighted area before another upward push. The SMA (9) at $3,552 is acting as dynamic support, keeping the bullish bias intact.
If buyers maintain control, a clear breakout above $3,552 – $3,560 could confirm a move toward $3,600 – $3,604. However, if momentum weakens, support lies at $3,511 and $3,499, with a deeper pullback possible toward the $3,440 buy zone.
Overall, the sentiment remains bullish, and gold looks positioned to test the $3,600 psychological resistance in the near term.
Gold Price Analysis – Testing Resistance near Sell ZoneAnalysis:
Gold (XAU/USD) is currently trading around 3,551.40, showing minor intraday losses (-0.03%). The chart indicates a strong resistance zone between 3,556–3,563, identified as the “sell zone,” with an All-Time High (ATH) slightly above at 3,578.12. Price is consolidating beneath this resistance, struggling to break higher.
The Fair Value Gap (FVG) below suggests a potential retracement toward 3,511–3,520 if sellers gain momentum. The Ichimoku cloud shows mixed signals, with price hovering around the equilibrium, indicating indecision in the short term.
A break above 3,563 could trigger bullish continuation toward ATH, while rejection at this level may lead to a pullback into the highlighted FVG region.

Gold Approaches All-Time High with Strong Bullish MomentumAnalysis:
Gold (XAU/USD) is showing strong bullish momentum after breaking through the buy zone around the $3,450 level. Price action has respected the ascending channel and successfully pushed above key resistance levels.
Currently, gold is trading at $3,473, with the next major target set at the all-time high (ATH) of $3,550, as highlighted on the chart. The breakout above the consolidation zone suggests continued buyer strength, supported by high trading volume.
If the bullish momentum sustains, we can expect a new ATH around $3,550+, while a failure to hold above $3,450 may bring a short-term pullback toward $3,400 – $3,346 support levels.
Overall, sentiment remains bullish, and gold looks ready to test higher highs if momentum continues.
Would you like me to also create a trade plan (entry, stop loss, take profit levels) for this setup?

Gold (XAUUSD) Testing Support Before Potential Move HigherAnalysis:
The chart for Gold Spot (XAUUSD) on the 1-hour timeframe shows a strong uptrend within a rising channel, supported by higher lows.
Support Level: Price is currently testing a key support around 3,404–3,405. This level also aligns with the trendline, making it an important zone to hold.
Resistance Zone: The next major resistance lies between 3,430–3,445, where selling pressure could emerge.
Trend Outlook: As long as the support level holds, the bullish momentum remains intact, with potential for price to continue higher toward the resistance zone.
Risk Factor: A breakdown below the support and trendline could weaken the bullish structure and may trigger a pullback toward 3,390.
📈 Bias: Bullish above support, targeting resistance at 3,430–3,445.
📉 Invalidation: Bearish pressure may come into play if price closes below 3,390.

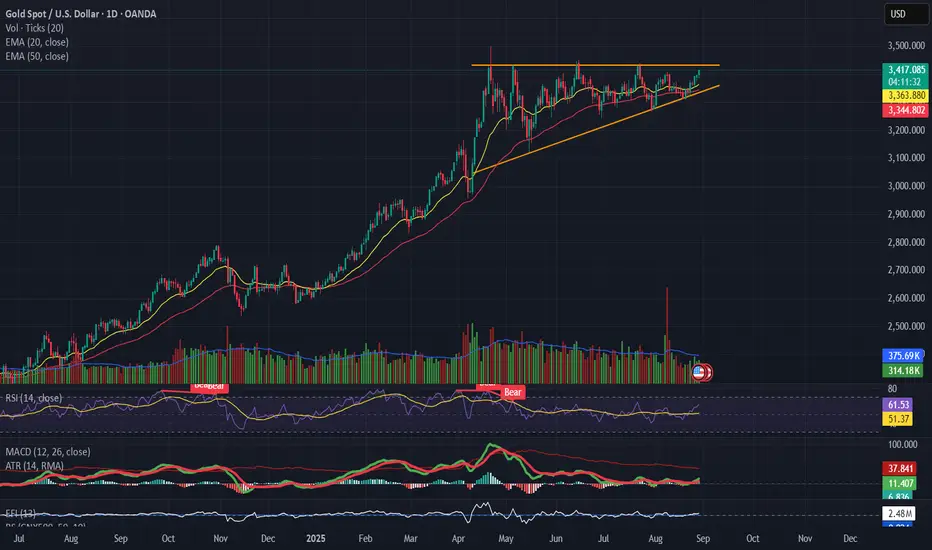
GOLD(XAUUSD) Forming a pennant / ascending triangle 📌 Gold (XAUUSD)
Forming a pennant / ascending triangle with strong resistance near $3,390 – 3,400.
Volume is declining, suggesting indecision.
RSI holding above 50 but not powering higher → momentum is slowing.
MACD flatlining, no fresh bullish impulse yet.
👉 Breakout above $3,400 needed for continuation. Breakdown below $3,340 risks correction.
Gold (XAU/USD) Targets $3,397 – $3,406 Amid Bullish MomentumAnalysis:
The 4H chart of Gold (XAU/USD) shows strong bullish momentum after a corrective phase. Price has broken above consolidation and is currently trading around $3,382, with upside targets at $3,397 and $3,406 (highlighted resistance zone).
The supply zone on the higher timeframe remains intact below $3,280, acting as a long-term support.
Immediate support levels lie at $3,371, $3,356, and $3,348. A break below these could shift momentum bearish.
Current bullish structure suggests that as long as price holds above $3,371, buyers may drive the price higher toward the resistance levels.
A rejection from $3,406 may lead to a pullback toward the mid-support zone before another attempt higher.

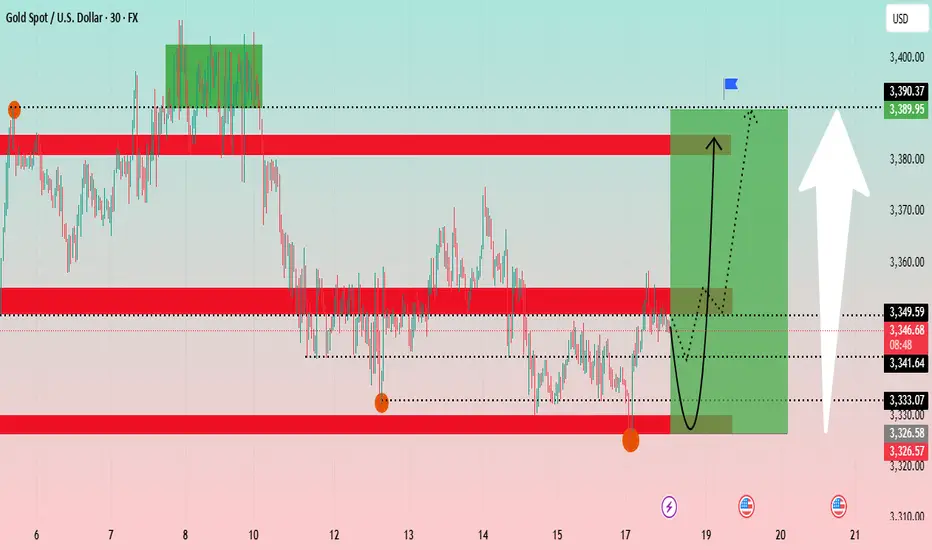
Gold Technical Analysis: Navigating Key Support ?The Gold chart shows a 30-minute timeframe analysis, highlighting recent price consolidation and potential future trends. The analysis suggests a potential V-shape recovery for gold.
Key Levels: The price is currently at a critical juncture, having tested a support zone around 3,326 - 3,333 USD. This zone has proven to be a strong base. Above it, a significant resistance zone is identified between 3,349 - 3,353 USD. Further up, another major resistance is at approximately 3,389 USD.
Price Action: The price has recently experienced a sharp decline and is now in a consolidation phase. The chart projects a potential bounce from the current levels, indicated by the black curved arrow, with the target being the upper resistance zone around 3,389 USD. The green shaded box illustrates the potential upward movement from the current position.
Conclusion: Gold appears to be at a key support level and could be poised for a rally if it successfully breaks above the immediate resistance zone.
Bitcoin (BTC/USDT) 4-Hour Chart Analysis
The Bitcoin chart shows a 4-hour timeframe analysis, focusing on a short-term uptrend channel.
Key Levels: The price is trading within an ascending channel. A significant support zone is identified between 112,000 - 114,000 USDT. A "weak supply zone" is marked around 118,000 USDT, which is currently acting as support. A major resistance is at approximately 124,564 USDT.
Price Action: After a strong push towards the channel's upper boundary, the price has pulled back and is now retesting the "weak supply zone." The blue and red arrows project two possible scenarios: a bounce back up towards the channel's high, or a deeper retracement towards the channel's lower trendline. The price movement appears to be following the blue projected path.
Indicators: The Ichimoku cloud and RSI strategy are used to confirm the trend and identify entry/exit points. The price is above the Ichimoku cloud, indicating a bullish trend.
Conclusion: Bitcoin is at a pivotal point within its uptrend channel. Its ability to hold the 118,000 USDT level will be crucial for a potential re-test of the 124,564 USDT resistance.
XAU/USDThis XAU/USD setup is a buy trade, showing a bullish bias on gold. The entry price is 3344, the stop-loss is 3340, and the exit price is 3353. The trade aims for a 9-point profit while risking 4 points, giving a solid risk-to-reward ratio of more than 2:1.
Buying at 3344 reflects expectations of upward momentum, possibly driven by dollar weakness, softer bond yields, or safe-haven demand. The entry level may also align with a support zone, where buyers step in to push prices higher.
The target at 3353 is placed below resistance to secure profits before potential selling pressure occurs. Meanwhile, the stop-loss at 3340 is tight, ensuring losses remain controlled if the trade fails.
This strategy is ideal for short-term traders looking to capture quick upside while maintaining disciplined risk management.

Gold (XAU/USD) Short-Term Bearish Setup1. Well-Defined Resistance Zones
Two horizontal shaded areas labeled Resistance R1 and Resistance R2 mark zones near $3,360–$3,380, where price repeatedly failed to break higher.
Trading ideas from analysts on TradingView reinforce that the immediate resistance lies around $3,364–$3,370. As long as price stays below that, sellers remain in control
TradingView
+1
.
2. Descending Channel & Bearish Momentum
The chart highlights a shift from an earlier ascending channel (green), followed by breakdown and decline — a classic reversal from bullish to bearish.
In line with this, there’s also mention of a bearish flag pattern forming on the 30-minute (M30) timeframe, offering a potential shorting opportunity
TradingView
+1
.
3. Key Support Levels & Targets
Multiple support levels annotated: Support S2 (at two levels) and Support S3, with notable levels around $3,315, $3,301–$3,302, and $3,300.
The annotated price action indicates projected declines toward those levels—especially highlighting $3,314.94, $3,301.55, and $3,300.96 as intermediate and key targets.
Ultimately, the red “High support area” below suggests a broader demand zone, perhaps around $3,280–$3,300, where stronger support may emerge.
4. Trading Plan Illustrated
White arrows depict a descending trajectory: from current levels down to each support, suggesting a sell-on-rally approach.
Blue markers denote possible bounce points for pullbacks before continuation lower.
Broader Market Context
Gold prices have recently been tracking in the $3,330–$3,350 range, facing resistance near $3,350–$3,360 and support near $3,300. Analysts caution that a break below that could push it toward $3,245 or $3,150–$3,120
TradingView
+1
.
Overall momentum has turned cautious or bearish—bearish engulfing patterns, weakening rally strength, and below-average technical indicators emphasize the risk of further declines
FXEmpire
+2
FXEmpire
+2
.
Weak U.S. economic indicators or dovish signals from Fed officials (like Powell) could offer brief relief rallies; but failure to reclaim resistance may extend the slide
FXEmpire
+1
.
Key Levels at a Glance
Level Type Price Range Notes
Resistance ~$3,350–$3,360+ Strong ceiling—decline confirms bearish bias
Support S1 ~$3,315–$3,320 First potential reaction zone
Support S2 ~$3,301 Intermediate target for sellers
Support S3 ~$3,300 Psychological barrier; near high support zone
High Support Area ~$3,280–$3,300 Zone where bullish buyers might regroup
Conclusion
Your chart effectively captures a short-term bearish trend in gold (XAU/USD), showing:
Failed attempts to overcome resistance near $3,360.
A bearish flag breakout signaling potential continuation downward.
Clearly plotted support targets, with bounce zones drawn out.
A visual trade plan suggesting sell-on-rallies targeting declining support levels until reaching a strong demand zone.
To succeed with this setup, traders might wait for a brief rally into one of the identified sell zones (e.g. ~$3,314 or $3,325) before entering shorts, with stop-loss placements above the resistance areas and profit objectives aligned with support levels ($3,301 or near $3,300).

XAU/USDThis XAU/USD setup is a buy trade, reflecting a short-term bullish view on gold. The entry price is 3315, the stop-loss is 3312, and the exit price is 3320. The trade seeks a 5-point profit while risking only 3 points, offering a favorable risk-to-reward ratio.
Entering at 3315 indicates the trader expects an immediate upward move, possibly supported by short-term demand, a weaker US dollar, or safe-haven flows. This level may also coincide with a minor intraday support zone, where buyers are likely to defend against further declines.
The target at 3320 is placed just below a resistance level, allowing profits to be secured quickly before potential selling pressure emerges. This conservative approach ensures gains are locked in without holding the position for extended periods.
The stop-loss at 3312 is positioned tightly to minimize downside exposure. This disciplined risk management makes the trade suitable for scalping or short-term strategies, where small but consistent gains matter. Overall, the setup emphasizes precision and strict control over risk.

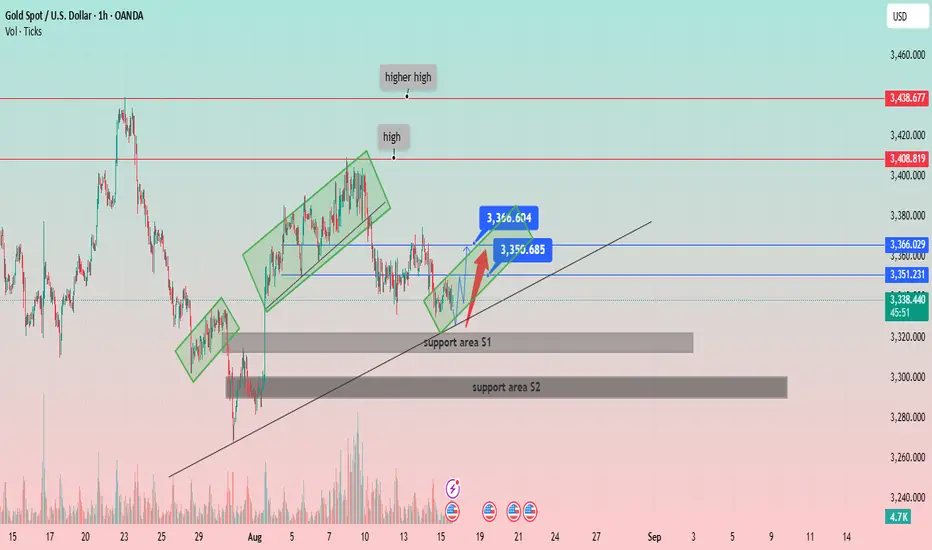
XAU/USD: Navigating the Uptrend and Key Support LevelsPrice Structure: Gold has been forming a series of higher highs and higher lows, indicative of a general uptrend. The chart labels a "high" and a "higher high," confirming this bullish structure.
Support and Resistance:
Two key support areas are identified:
Support area S1: A narrow zone around 3,320 USD. The price recently bounced off this area.
Support area S2: A broader, more significant zone around 3,290 USD, which appears to have been a strong support level in the past.
Several horizontal resistance levels are marked:
Immediate resistance: Around 3,351.231 USD and 3,366.029 USD.
Higher resistance: At 3,408.819 USD and 3,438.677 USD.
Channels and Trendlines:
The price has been moving within a series of ascending channels (highlighted in green rectangles), suggesting a stair-step upward movement.
A primary ascending trendline (black line) serves as a long-term support, with the price currently hovering just above it.
Recent Price Action and Projections:
The price recently broke out of a small downtrend and is showing signs of recovery from the "support area S1."
A potential price path is drawn with a red arrow, indicating a possible move towards the immediate resistance levels around 3,351 USD and 3,366 USD.
The chart highlights two specific price points, 3,360.604 USD and 3,350.685 USD, which likely represent a short-term trading range or target.
Volume: The volume spikes visible at key price points (e.g., at the low on July 30 and during the recent drop) indicate strong market activity.
XAUUSD Bullish Trend Continuation: Potential Move to $3,400!The price action shows a higher high ("high") and a higher low ("low"), which are characteristic of an uptrend. An upward trendline has been established, connecting a series of higher lows, which is acting as a dynamic support level. A significant horizontal support zone has also been identified around the $3,260 - $3,280 price range, where the price previously found support.
Recently, the price experienced a pullback and bounced off the upward trendline. The analysis anticipates a continuation of the upward momentum toward a key resistance zone. This resistance zone is located around the $3,400 - $3,420 level. A specific target price of $3,408.833 is highlighted within this zone, suggesting a potential area where the upward movement might pause or reverse.
The chart includes a potential corrective wave pattern labeled with "C"s, indicating a recent three-wave pullback within the larger trend. The current price is shown at $3,353.520, positioned above both the horizontal support and the upward trendline, reinforcing the bullish sentiment.

XAU/USDThis XAU/USD setup is a buy trade, reflecting a bullish outlook on gold prices. The entry price is 3337, the stop-loss is 3331, and the exit price is 3350. The trade targets a 13-point profit while risking 6 points, offering a favorable risk-to-reward ratio of over 1:2.
Buying at 3337 suggests the trader anticipates upward momentum, possibly supported by a weaker US dollar, softer bond yields, or rising safe-haven demand. The target at 3350 is set near a potential resistance level to secure profits before possible selling pressure.
The stop-loss at 3331 is kept tight to control losses if the market reverses. This setup is best executed during strong bullish momentum or after breakout confirmation.

Gold Price Faces Key Resistance — Can Bulls Break $3,440?The XAU/USD (Gold vs. USD) 1-hour chart shows a strong bullish structure within an upward channel, supported by higher highs and a recent ATH (All-Time High) retest.
Resistance Zone: $3,410 – $3,440 is acting as a significant supply area. Price may face selling pressure here.
Support Levels: First support lies near $3,300 (supply zone), followed by the $3,225–$3,250 demand zone.
Trend: The price is respecting the upward trendline, but a break below could trigger a retest of the green supply zone.
Bullish Scenario: A breakout and close above $3,440 could lead to a continuation toward $3,475+.
Bearish Scenario: Rejection from the resistance zone with a break below $3,300 could push price toward the $3,225 support.
Overall, gold is currently in a bullish trend, but needs to overcome the $3,440 barrier for further upside momentum.

Target hit on XAU/USD
On 13/08/2025, the XAU/USD trade successfully reached its target, delivering a strong and profitable outcome. The trade was planned using a combination of technical analysis and market fundamentals, focusing on key support-resistance levels and price action signals. Once the entry was triggered, gold prices moved consistently toward the target, showing clear momentum in the anticipated direction. A weaker U.S. dollar and ongoing global economic uncertainty further supported bullish movement in gold. The trade never came close to the stop loss, which reflects the accuracy of the setup and the effectiveness of the strategy. Achieving the target reinforced the importance of disciplined risk management and sticking to the trading plan without emotional interference. This win on 13/08/2025 not only provided a solid return but also strengthened confidence in the overall trading approach, proving that patience and precise execution can consistently lead to profitable results in XAU/USD trading.

xau/usd
This XAU/USD trade setup is a buy trade, designed for a very short-term move in gold prices. The entry price is 3346, the stop-loss is set at 3342, and the exit price is 3348. The trade aims for a small 2-point profit while risking 4 points, meaning the risk-to-reward ratio is lower than 1:1, which makes it suitable only for quick scalp trading strategies.
Buying at 3346 suggests the trader expects a slight upward movement, possibly triggered by short-term momentum, minor support holding, or quick price fluctuations during active market hours. The target at 3348 is very close to the entry, meaning this trade relies on precise timing and fast execution to capture small gains.
The stop-loss at 3342 is set just below the entry to limit losses if the market moves against the position. Given the tight range, any sudden volatility could hit the stop-loss quickly.
This type of trade requires constant monitoring, rapid decision-making, and disciplined risk control. While the profit target is small, consistent scalp trades like this can add up over time if executed with accuracy and strict trading discipline.
