Bullish Breakout & Golden Zone Reversal AnalysisChart Analysis (Gold – 15m)
1. Trend Structure
Price has been moving inside a descending channel, showing short-term bearish pressure.
Now price is attempting a breakout from the channel, signaling a potential bullish reversal.
2. Key Support Zones (Demand Areas)
4,187.08 → First support where buyers reacted.
4,178.10 → Deep liquidity zone (strong demand).
These levels align with Fibonacci retracement clusters:
0.618 (4,186.98)
0.705 (4,184.22)
0.79 (4,181.51)
This confirms a high-probability reversal zone.
3. Fibonacci Strategy
Price touched the 0.618–0.79 golden pocket and bounced.
This supports a long setup targeting the 1:1 impulse projection.
4. Moving Averages (EMA Strategy)
EMA 70 and EMA 200 are above price during correction.
A breakout + retest above EMAs would confirm further bullish momentum.
5. Breakout Strategy
A clear breakout above the descending channel suggests the beginning of a new bullish leg.
6. Target Projection
The measured move indicates:
Target Point: 4,240.21
Expected gain: ≈ +1.25% (≈ 52.5 points)
7. Signal Summary
✔️ Support respected
✔️ Breakout forming
✔️ EMA alignment improving
✔️ Fibonacci golden zone bounce
✔️ Bullish target activated
📌 Final Signal
Bullish Bias (Long) above 4,187
🎯 Target: 4,240
🛡 Stop-loss: Below 4,178 NSE:BANKNIFTY1! CME_MINI:MNQ1! CME_MINI:ES1! CME_MINI:NQ1! CME_MINI:MES1! COMEX_MINI:MGC1! CBOT_MINI:YM1! NSE:NIFTY1! NSEIX:NIFTY1! NYMEX:CL1! COMEX:SI1!
Xauusdprediction

1. Bullish Reversal Setup From POI Toward Key TargetChart Analysis (Gold – 30m)
Trend Structure:
Price is currently in a corrective down-move inside a rising channel, but overall structure still respects higher-timeframe bullish momentum.
🔵 Key Zones
Bullish POI (Demand Zone): Lower blue zone – strong reaction point from previous impulsive move.
Bullish Order Block: Upper blue zone – price is retesting this area for liquidity collection.
📈 Indicators Used
EMA 70 & EMA 200:
Price is oscillating between both EMAs.
EMA 70 above EMA 200 → bullish bias still intact.
Liquidity Sweep:
Wick rejections below structure indicate liquidity grab before bullish reaction.
📌 Market Behavior
Price is expected to dip into POI to collect liquidity.
From POI, a bullish reversal is projected toward target zone 4,264.57.
🎯 Target
4,264.57 (Highlighted target level; aligns with channel top + liquidity zone)
📊 Summary Signal
Price likely retraces into the Bullish POI, then forms a strong bullish impulse toward the target. CME_MINI:NQ1! CME_MINI:MNQ1! CME_MINI:MES1! COMEX_MINI:MGC1! CME_MINI:ES1! NYMEX:CL1! NSE:BANKNIFTY1! CBOT_MINI:YM1! NSEIX:NIFTY1! NSE:NIFTY1! COMEX:SI1!

Gold Price at Critical Resistance Breakout or Rejection SetupChart Analysis (All Strategies Used)
1️⃣ Trend Analysis
Price is moving inside a descending structure, but recently broke above the short-term trendline, showing bullish momentum.
EMAs 70 & 200 are acting as dynamic support—bullish signal
2️⃣ Support & Resistance
Strong resistance zone: 4,228 – 4,236 (multiple rejections earlier).
Support zone: around the 4,195 – 4,200 region.
If price stays above support + EMAs, bullish continuation likely.
3️⃣ Breakout Strategy
Price is retesting resistance again.
A clean breakout above 4,236 can send the price toward the buying target: 4,263.60 🚀.
4️⃣ Rejection / Pullback Strategy
If price fails at 4,236 and rejects strongly, expect a drop back toward:
Support 4,195
Selling Target: 4,162 📉
5️⃣ EMA Strategy
Price is above both EMAs → trend favors buyers.
If price dips and closes below EMA 70 + EMA 200, selling pressure strengthens.
6️⃣ Risk–Reward Strategy
Buy setup: Break & retest above 4,236 → target 4,263.
Sell setup: Strong rejection at resistance → target 4,162.
Good RR on both sides depending on breakout vs. rejection.
📌 Final Summary
Price is at a critical resistance zone (4,236).
➡️ Breakout = BUY toward 4,263
➡️ Rejection = SELL toward 4,162 CME_MINI:MES1! CME_MINI:ES1! CBOT_MINI:YM1! CME_MINI:MES1! NSE:BANKNIFTY1! COMEX_MINI:MGC1! CME_MINI:MNQ1! COMEX:SI1! NYMEX:CL1! CME_MINI:NQ1!

Gold 4H Technical Outlook: Demand Zone Re-Test and Bullish ContiChart Analysis (Gold – 4H)
1. Market Structure
Price is in a clear ascending channel, respecting both the support line and rejection line.
Recent pullback has returned to a demand zone (4,114–4,148), which has acted as a strong buy area before.
2. Key Zones
Demand Zone: 4,114 – 4,148
Strong reaction expected; buyers previously stepped in here.
Target Point: 4,319
Based on channel top + measured move projection (153 pts).
3. Moving Averages (EMA 200 & EMA 70)
Price is trading above both EMAs, indicating bullish market sentiment.
EMA70 is acting as dynamic support inside the channel.
EMA200 supports the overall long-term uptrend.
4. Pattern Recognition
A bullish flag (red highlighted area) recently broke upward, confirming continuation.
Current movement shows another retest of the demand zone, which aligns with the channel support.
5. Trendline Analysis
Support trendline has been touched multiple times — strong confirmation.
Rejection line shows sellers but remains intact inside the channel.
6. Price Action Signals
Recent wicks near the demand zone show buyer interest.
Higher lows continue to form.
🎯 Expected Move
If price maintains above 4,114–4,148, the next target remains:
➡️ 4,319 (upper channel resistance)
Bullish continuation is favored unless price closes below 4,114, which would break structure. CBOT_MINI:YM1! CME_MINI:MES1! CME_MINI:MNQ1! CME_MINI:NQ1! NSE:BANKNIFTY1! NYMEX:CL1! CME_MINI:ES1! COMEX_MINI:MGC1! COMEX:SI1!

GOLD - ENTERS COREECTION PHASESymbol - XAUUSD
Gold is currently undergoing a corrective phase following approximately six weeks of aggressive upward movement. Price action is forming a consolidation range while continuing to pressure the support zone.
The recent record breaking rally became overheated, prompting profit-taking and long liquidation. Additionally, a gradual shift in market sentiment and macroeconomic backdrop is contributing to capital outflows. However, ongoing US–China trade negotiations, the US government shutdown, and heightened geopolitical uncertainty, including the cancellation of Trump’s meeting with President Putin, continue to pose economic risks that could provide underlying support for the precious metal.
Overall, the current pullback appears to be a healthy corrective pause within the broader structure. The 4000 level remains a critical support area. A sustained recovery above 4110 would indicate that buyers are interested, though further momentum largely depends on developments surrounding global trade policies.
Resistance levels: 4100, 4110, 4163
Support levels: 4058, 4000
A decisive breakdown of the lower boundary of the trading range could trigger a deeper corrective wave. The 4000 level is the primary focus, as strong volatility may occur around this zone. Given the current market conditions - with declines matching the previous intensity of the rally, patience is warranted until momentum stabilizes, enabling more informed technical decisions.

“Gold Price Action: Bullish Momentum with Key Correction ZonesAnalysis of XAU/USD (Gold Spot)
The chart shows a clear uptrend channel, supported by higher highs and higher lows.
Price recently pulled back after testing the $3,915 zone, which is acting as a short-term resistance.
Multiple support zones are highlighted (around $3,760 and $3,700), which can provide strong buying opportunities on retracement.
The structure suggests impulse–correction–impulse movement, aligning with bullish continuation patterns.
Bullish Scenario
If price holds above the $3,760–$3,780 support, continuation towards $3,915 (previous high) is expected.
A breakout above $3,915–$3,920 will open the door for further upside, targeting $3,960–$3,980.
Bearish Scenario
If price breaks below the trendline support (~$3,760), deeper correction is possible toward $3,680–$3,640 (TP1 zone).
That zone is mentioned on the chart as a strong re-entry point for long positions.
✅ Suitable Target (Bullish):
Immediate Target: $3,915 (previous high)
Extended Target: $3,960 – $3,980
⚠️ Correction Target (Bearish Pullback):
$3,680 – $3,640 (strong buy zone for re-entry)

XAUUSD SHOWING A GOOD DOWN MOVE WITH 1:10 RISK REWARDXAUUSD SHOWING A GOOD DOWN MOVE WITH 1:10 RISK REWARD DUE TO THESE REASON
A. its following a rectangle pattern that stocked the marketwhich preventing the market to move any one direction now it trying to break the strong resistant lable
B. after the break of this rectangle it will boost the market potential for breakC. also its resisting from a strong neckline the neckline also got weeker ald the price is ready to break in the outer region
all of these reason are indicating the same thing its ready for breakout BREAKOUT trading are follws good risk reward
please dont use more than one percentage of your capitalfollow risk reward and tradeing rules that will help you to to become a bettertrader
thank you

Gold Facing Strong Resistance – Bearish Move Towards Support ?Analysis:
Resistance Zone: Price is struggling to break above the $3,645–$3,650 area, which has acted as a strong resistance multiple times.
Support Levels: Immediate support lies around $3,620 and $3,614, with the major support zone at $3,580.
Price Action: Repeated rejections from resistance indicate weakening bullish momentum. Sellers are gaining control near the resistance zone.
Bearish Outlook: A potential downward move is projected, with price likely to test $3,580 support if resistance continues to hold.
Risk Management: A break and close above $3,650 would invalidate the bearish scenario and could trigger a bullish continuation.
✅ Bias: Bearish below $3,650
🎯 Targets: $3,620 → $3,614 → $3,580
🛑 Invalidation: Above $3,650

XAU/USD Bullish Trade Setup Buy from POI Zone towards 3668TargetXAU/USD (Gold) – 1H Analysis
✅ Trend: The market is in a clear bullish trend with higher highs & higher lows. Price is trading above both EMA 70 (3,547) and EMA 200 (3,486), confirming strong upward momentum.
📌 Key Levels:
POI Buying Zone: 3,554 – 3,576 (strong support area)
Target Point: 3,668 – 3,669
Support Line: Still respected, adding confluence to the bullish setup.
📈 Strategies Applied:
Trend Following: Bullish as long as price stays above EMAs.
Support & Resistance: Buying zone aligns with strong support.
EMA Strategy: Price above EMAs = buy signal.
Price Action: Retest of POI zone before moving up.mm
🎯 Trade Idea:
Entry: Around 3,555 – 3,576 (buying zone)
Stop Loss: Below 3,547 (EMA 70 / zone invalidation)
Target: 3,668 – 3,670
⚡ Summary: Market remains bullish, correction into the POI zone is a good buying opportunity aiming for new highs.

XAU/USD Bullish Setup – OB Zone to $3,590 TargetChart Overview (XAU/USD – 30m):
Current price: $3,534
Price is in a strong bullish channel (higher highs & higher lows).
Market forming an ATH (All-Time High) and consolidating.
📌 Strategies Applied:
1. Trendline Strategy:
Price respecting support & rejection lines inside ascending channel.
Trend remains bullish as long as price holds above support.
2. Order Block (OB) Zone:
Identified buying zone at $3,501 – $3,514.
Strong support + liquidity area → possible rebound point.
3. Moving Averages (EMA):
EMA 70 (3,508) and EMA 200 (3,464) both acting as dynamic support.
EMA alignment confirms bullish momentum.
4. Risk–Reward Setup:
Entry near OB Zone: $3,501 – $3,514
Stop-loss: below $3,500
Target: $3,590 (R:R ~ 1:3).
✅ Summary:
Gold is in a strong bullish trend 🚀. The OB Buying Zone aligns with EMA support, offering a low-risk long entry. As long as $3,500 holds, price likely pushes towards the target zone $3,589 – $3,590.

XAU/USD Bullish Setup – Buy from POI Zone Towards 3545 TargetXAU/USD (15M Chart) Analysis
Trend Analysis:
Price is in a clear uptrend, supported by higher highs and higher lows above the EMA 70 & EMA 200. Both EMAs are pointing upward, confirming bullish momentum.
POI & FVG Zone:
A POI/FVG buying zone (highlighted in pink) is marked between 3481 – 3491, acting as a strong demand area for re-entry if price retraces.
Chart Pattern:
Price has broken out of a rising wedge formation and is retesting the breakout zone, showing potential continuation to the upside.
Support & Resistance:
Support: 3481 – 3491 zone (FVG & EMA confluence).
Resistance/Target: 3545.608 (major target point).
Entry & Risk Management:
Entry: Buy near 3491 or 3481 (within POI/FVG zone).
Stop Loss: Below 3480 (to protect against false break).
Target: 3545 (approx. +55 points).
Strategy Confirmation:
Trend-following: Bullish continuation above EMAs.
FVG/POI: Perfect re-entry buying zone.
Breakout strategy: Price broke wedge → retest → continuation expected.
Risk-Reward Ratio: Around 1:4, favorable trade setup.
✅ Summary:
XAU/USD remains bullish above EMAs. Ideal trade is to buy the dip at 3481–3491 zone with a target at 3545 and stop loss below 3480. Multiple strategies align for upside continuation.

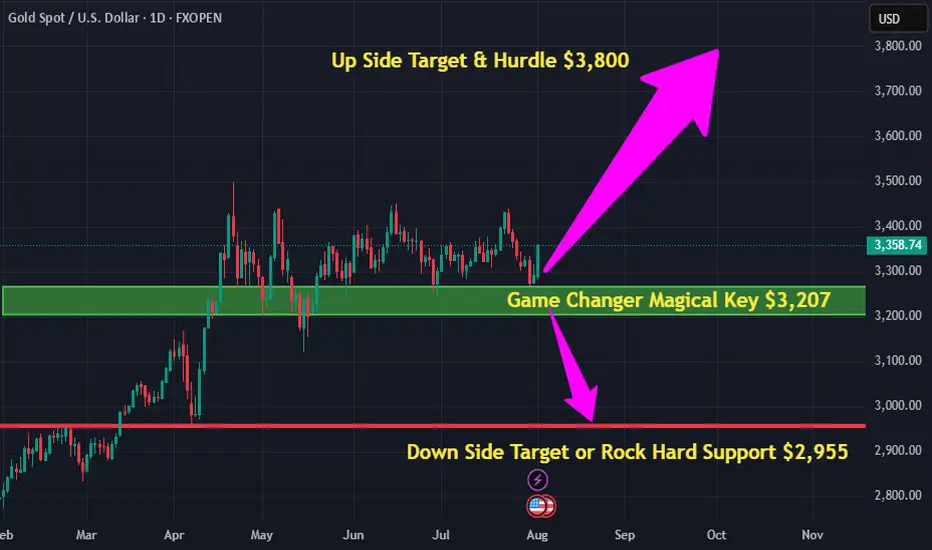
XAU/USD Magical Level for Trading: $400 Up or Down?XAU/USD (Gold) Magic Level for Trading: Can It Move $400 Up or Down till September 2025? - By Neal Bhai, India
XAUUSD-Gold Short Position Recovery levelsLooking for a short position as a recovery trade.
Bearish momentum is strong.
Entry-$3371
SL-$3381
TP-$3351
Risky Trade.

XAUUSD DAILY UPDATES DATE:22/07/2025XAUUSD retest between 0.5 and 0.618 i can buy this level... otherwise i will wait for confirmation bullish candle at 1hr and 4hr trendline.
This is just an idea not a financial advise, Please manage proper risk management

GOLD (XAU/USD) 4H CHART – BULLISH BREAKOUT TRADE SETUP🔵 Trendline Breakout 📈
📏 Price broke above a descending trendline, signaling a potential bullish reversal.
🔼 This breakout is often seen as a buy signal by traders.
🧱 Resistance Area 🛑
🔹 Price has entered and broken through a horizontal resistance zone.
🔄 This zone may now flip into support, adding confidence to the long setup.
🟧 Demand Zone 📦
📍 Marked between 3,267 – 3,298.
🛡️ Strong buying interest historically observed in this area.
📉 EMA (70) at 3,298.065 acts as dynamic support.
🟦 Entry Point 🚪
🎯 Entry Level: 3,322.930
🔄 Enter after retest confirmation or bullish candle above resistance.
🔴 Stop Loss ⛔
⚠️ SL Level: 3,267.993
💣 Below the demand zone and EMA — protecting against false breakouts.
🟩 Target Point 🎯
🚀 TP Level: 3,490.000
📌 Prior high zone — strong historical resistance expected here.
💰 Trade Setup Summary
✅ Buy Above: 3,322.930
❌ Stop Loss: 3,267.993
🎯 Target: 3,490.000
📊 Risk/Reward Ratio: Favorable (approx. 1:3)
🔎 Technical Confidence Levels
🔵 EMA Support ✅
🔵 Trendline Breakout ✅
🔵 Resistance Flip ✅
🔴 False Breakout Risk

GOLD - BULLISH OUTLOOK WITH SHORT TERM PULLBACKSymbol - XAUUSD
Gold is currently testing the liquidity zone near the 3350 level, exhibiting signs of a potential false breakout above resistance within the prevailing upward trend. A short-term correction may occur before the continuation of the broader bullish movement.
The fundamental backdrop in the market remains complex and somewhat contradictory. Presently, attention is centered on geopolitical developments, particularly the heightened tensions between Russia and Ukraine following the recent weekend escalation. Market participants are closely monitoring diplomatic negotiations taking place in Turkiye. Additionally, the ongoing uncertainty surrounding international tariff policies continues to exert pressure on sentiment.
Since the session's open, gold has demonstrated strong upward momentum, approaching a key liquidity & resistance zone. A false breakout at resistance appears to be forming, which could prompt a corrective pullback toward a key area of interest. Simultaneously, the US dollar is testing a support level, potentially signaling a local correction before resuming its directional movement. This interplay may influence gold prices, which retain an overall bullish outlook.
Resistance levels: 3350, 3365, 3409
Support levels: 3303, 3264
The price has broken out from a consolidation phase, having tested resistance and triggered liquidity above the 3350 mark. Given the current positioning, a retracement toward support levels is plausible before the uptrend resumes.

Gold Trading Strategy for 6th January 2025Gold Trading Strategy
Key Levels:
Buy Above: The high of the 1-hour candle that closes above 2648
Sell Below: The low of the 15-minute candle that closes below 2631
Targets:
Upside Targets: 2655, 2665, 2680
Downside Targets: 2632, 2616, 2609
Strategy Details:
Buy Signal: Enter a buy position above the high of the 1-hour candle that closes above 2648, aiming for targets of 2655, 2665, and 2680.
Sell Signal: Enter a sell position below the low of the 15-minute candle that closes below 2631, aiming for targets of 2632, 2616, and 2609.
Trailing Stop-Loss: Use a trailing stop-loss to manage risk and protect your capital.
Book Profits: Regularly book profits at the specified resistance and support levels.
Disclaimer:
This strategy is based on historical data and technical analysis. Past performance is not indicative of future results. Trading involves risk, and you should only invest money that you can afford to lose. Always conduct your own research or consult with a financial advisor before making any trading decisions.

Gold trading Strategy for 3rd January 2025Trading Strategy
Buy Condition Entry Point:
Buy above the high of the 15-minute candle that closes above 2662. Ensure that the candle has fully closed before entering the trade to confirm the breakout.
Targets: Target 1: 2670, Target 2: 2680, Target 3: 2699
Stop-Loss: Place your stop-loss below the low of the breakout candle or below a recent support level, depending on your risk tolerance.
Sell Condition Entry Point:
Sell below the low of the 1-hour candle that closes below 2647. Ensure that the candle has fully closed before entering the trade to confirm the breakdown.
Targets: Target 1: 2636, Target 2: 2627, Target 3: 2621
Stop-Loss: Place your stop-loss above the high of the breakdown candle or above a recent resistance level, depending on your risk tolerance.
Important Notes on Stop-Loss and Trailing Stop-Loss:
Protect Your Capital:
Always use a stop-loss to protect your trading capital from significant losses. Never trade without a predetermined stop-loss level.
Secure Profits:
As the trade moves in your favor and reaches the first target, consider moving your stop-loss to breakeven. For additional targets, use a trailing stop-loss to lock in profits while allowing the trade to run further. This can be done manually or by setting a dynamic trailing stop in your trading platform.
Disclaimer:
Risk of Trading:
Trading in financial markets involves significant risk and may not be suitable for all investors. Losses can exceed your initial investment.
Educational Purposes Only:
The strategies provided above are intended for educational purposes and should not be interpreted as financial or investment advice.
No Guarantees:
Past performance is not indicative of future results. There is no guarantee that the strategies mentioned will result in profits or avoid losses.
Due Diligence Required:
Always perform your own analysis before entering a trade. It is essential to understand the technical and fundamental factors influencing the market.
Seek Professional Advice:
Consult with a licensed financial advisor or trading professional to ensure your trading activities align with your financial goals and risk tolerance.
Use Risk Capital:
Only trade with funds you can afford to lose. Avoid using money allocated for essential living expenses.

Gold Trading Strategy for 02nd January 2025Gold Trading Strategy
Buy Setup Condition:
Wait for a 15-minute candle to close above 2632.
Entry:Place a buy order above the high of this 15-minute candle.
Targets:2640, 2648, 2655.
Stop Loss:Set a stop loss below the low of the entry candle or according to your risk management.
Sell SetupCondition:
Wait for a 1-hour candle to close below 2616.
Entry:Place a sell order below the low of this 1-hour candle.
Targets:2608, 2602, 2590.
Stop Loss:Set a stop loss above the high of the entry candle or according to your risk management.
Disclaimer
Trading involves substantial risk and is not suitable for every investor. The strategy mentioned above is for informational purposes only and does not constitute financial advice. Always perform your own analysis and consult a professional financial advisor before making trading decisions. Past performance is not indicative of future results. Use this strategy at your own risk.

Gold Trading Strategy for 30.12.2024Gold Trading Strategy
Key Levels:
Buy Above: The high of the 15-minute candle that closes above 2642
Sell Below: The low of the 15-minute candle that closes below 2610
Targets:
Upside Targets: 2651, 2664, 2675, 2686
Downside Targets: 2598, 2589, 2579
Strategy Details:
Buy Signal: Enter a buy position above the high of the 15-minute candle that closes above 2642, aiming for targets of 2651,2664, 2675, and 2686.
Sell Signal: Enter a sell position below the low of the 15-minute candle that closes below 2610, aiming for targets of 2598, 2589, and 2579.
Trailing Stop-Loss: Use a trailing stop-loss to manage risk and protect your capital.
Book Profits: Regularly book profits at the specified resistance and support levels.
Disclaimer:
This strategy is based on historical data and technical analysis. Past performance is not indicative of future results. Trading involves risk, and you should only invest money that you can afford to lose. Always conduct your own research or consult with a financial advisor before making any trading decisions.

Gold or XAUUSD analysis Gold or XAUUSD analysis
Symbol: Gold or XAUUSD
Time frame: 4 hours
Analysis: Presently we can observe divergence, SO, we can expect downtrend movement up to 1870 but in case if the price crosses above the parallel channel with high volume and in MACD, if the price crosses above zero, then, we can expect target up to 1230.
HOPE our analysis is adding value to your Trading Journey.
NOTE: Published Ideas are for ‘’EDUCATIONAL PURPOSE ONLY’’ trade at your own risk.
NOTE: RESPECT The risk. SL should not be more than 2% of the capital.
Happy Trading

XAUUSD Next Move One Week ProjectionAll major points are clearly plotted on the chart, if you have any query or doubt, can contact me through below comment system...
This analysis is invalid if XAUUSD cross upward the point 1925...
Thanks for your support...

XAUUSD Pre-Prediction till 1st March 2022As per my calculations and previous chart history, I am going short but with tight stop loss according to my risk management and I will set a buy stop in that case..
All main points are also projected on the chart...
Please do your own research before taking any decision of trading in this volatile market...
Local Support @1920.079 and
Sell Stop @1929 with
TP1 @1916
TP2 @1910
TP3 @1904
TP4 @1900
Alternatively
Local Resistance @1933.028 - 1936
if broken then
TP1 @1938
TP2 @1945
TP3 @1953
Major Resistance @1949.039
If broken then this analysis would be invalid
