Gold Near ₹4000, BofA Warns of Mid-Cycle Adjustment 📊 Market Context
Gold prices are inching closer to the ₹4,000/oz mark, but a fresh warning from Bank of America has made the market cautious. Strategist Paul Ciana notes that gold is over 20% above the MA200 – a level seen before sharp corrections in historical peak cycles (2008, 2011, 2020, 2022).
However, medium-term forecasts from Goldman Sachs, UBS, and even BofA still suggest that gold could reach ₹4200–₹4900/oz next year. This means the long-term upward trend is still intact – but the current phase is prone to unexpected corrections to shake off FOMO buying pressure.
🔎 Technical Analysis (H1/H4)
Prices are fluctuating near the ATH Zone and the crucial liquidity area around ₹3990–₹4000.
Buy Zones: ₹3935–₹3933 (CP zone & FVG reaction) offer an opportunity to accumulate orders.
Sell Zone: ₹3993–₹3995 (Liquidity Zone) – a liquidity trap is likely when prices approach the ₹4000 mark.
🔑 Key Levels
BUY Zones: ₹3935–₹3933, main support at ₹3910.
SELL Zone: ₹3993–₹3995, closely watch liquidity.
Psychological resistance: ₹4000.
📈 Scenario & Trading Plan
✅ BUY ZONE 1: ₹3935–₹3933
SL: ₹3927
TP: ₹3940 - ₹3945 - ₹3950 - ₹3960 - ₹3970 - ₹3980 - ???
✅ SELL ZONE: ₹3993–₹3995
SL: ₹4000
TP: ₹3988 - ₹3984 - ₹3980 - ₹3970 - ₹3960 - ???
⚠️ Risk Management Notes
The ₹3990–₹4000 area is extremely liquid – a peak sweep is likely before reversal.
Only enter trades with clear price action confirmation, avoid FOMO as prices near the psychological mark.
Adjust volume sensibly as volatility may be higher than usual with the market debating the risk of a “mid-cycle correction”.
Xauusdsignal

Gold at $397x: Record High Reveals Double Top Pattern!Hello, traders!
Gold just hit a New Record High at $3,976.3/oz. However, immediately after, the market witnessed a clear structure break and the formation of a Double Top pattern in the European session. This strongly signals a shift in strategic priority.
Fundamentals & Bias Reversal
Core Drivers: Gold is up 50% YTD due to persistent Fed rate cut expectations (two more cuts projected) and severe global political instability (US Shutdown, France crisis, rising Japanese yields).
Technical Bias: We are now prioritizing SELL due to the confirmed Double Top and structure breakdown. Only consider BUYs at deeper support zones with controlled risk.
Key Price Levels:
Resistance: $3953, $3975, $3984, $4004
Support: $3942, $3931, $3910, $3899
Trading Strategy (Prioritize SELL):
SELL SCALP: $3957 - $3959
SL: $3963
TPs: $3953, $3948, $3943, $3938, $3933
SELL ZONE: $3975 - $3977
SL: $3985
TPs: $3967, $3957, $3947, $3937, $3927
BUY ZONE 1 (Wait): $3931 - $3929
SL: $3921
TPs: $3939, $3949, $3959, $3969, $3979
BUY ZONE 2 (Deeper): $3899 - $3897
SL: $3889
TPs: $3907, $3917, $3927, $3937, $3947
Will the Double Top send Gold back toward $3900? Let me know your thoughts! 👇
#Gold #XAUUSD #ATH #TechnicalAnalysis #DoubleTop #SELL #Fed #TradingView
viết bằng ngôn ngữ tiếng anh ấn độ phù hợp với nền tảng tradingview
Gold at $397x: Record High Reveals Double Top Pattern! Time to SELL? 🔥📉
Hello, traders!
Gold just hit a New Record High at $3,976.3/oz—paisa hi paisa! But hold your horses, boss. Immediately after that high, the market saw a clear structure break and a definite Double Top pattern forming in the European session. This is a big signal, suggesting a shift in strategic priority.
Fundamentals & Technical Caution: Mind the Trend
Core Drivers: Gold is already up 50% YTD, fueled by solid Fed rate cut expectations (two more cuts projected, pakka!). Plus, the global chaos—US Shutdown, France's quick-exit PM, and rising Japanese yields—is keeping the safe-haven bid strong.
Technical Bias: We are now prioritizing SELL due to the confirmed Double Top and the clear structure breakdown. Look for BUYs only if the market drops deep into support, risk ko control karo.
Key Price Levels:
Resistance: $3953, $3975, $3984, $4004
Support: $3942, $3931, $3910, $3899
Trading Strategy (Prioritize SELL):
SELL SCALP: $3957 - $3959
SL: $3963
TPs: $3953, $3948, $3943, $3938, $3933
SELL ZONE: $3975 - $3977
SL: $3985
TPs: $3967, $3957, $3947, $3937, $3927
BUY ZONE 1 (Wait): $3931 - $3929
SL: $3921
TPs: $3939, $3949, $3959, $3969, $3979
BUY ZONE 2 (Deeper): $3899 - $3897
SL: $3889
TPs: $3907, $3917, $3927, $3937, $3947
Will this Double Top be the beginning of a correction, or is $4000 still in the cards? Tell me your move! 👇
#Gold #XAUUSD #ATH #TechnicalAnalysis #DoubleTop #SELL #Fed #TradingView #MarketAnalysis

Sustainable Price Rise: Where’s the Next Optimal Entry?Hello TradingView community! 🚀
Gold (XAU/USD) is in an extremely sustainable upward structure. Instead of lengthy analysis, let's dive straight into the action plan: What is the optimal entry point and what target is Gold aiming for? Check out the details below.
1. Market Structure Analysis: The Strength of the Bulls 🐂
Looking at the chart, the first thing that catches our eye is a series of "BoS" (Break of Structure).
Every time Gold breaks an old peak, it not only creates a Higher High but also confirms that the upward trend is very strong and sustainable. This indicates that buying power is completely overwhelming and shows no sign of weakening. Smart Money is continuously pushing the price higher, and our job is to ride this "wave."
2. Potential Buying Zones - Where to Catch the Wave? 🧐
To optimize profits and minimize risks, finding a beautiful entry point after a price correction is extremely important. Based on the chart, we have 2 noteworthy potential buying zones:
Buying Zone 1 - Fibonacci Confluence ($3885): This is an extremely ideal "Buy Zone," coinciding with the golden Fibonacci ratio of 0.618. In technical analysis, this is a very strong support level, where prices often tend to reverse and continue the main trend. Professional traders always hunt for pullbacks to this zone.
Buying Zone 2 - Exploiting FVG ($3914 - $3933): Slightly higher, we have the FVG (Fair Value Gap) area at $3914 and the "Buy Scalping" zone at $3933. These are "price gaps" created by supply-demand imbalances when prices rise too quickly. The market tends to return to fill these gaps before continuing its journey. This could be an opportunity for those wanting to catch an earlier wave.
3. Target Conquest - What’s Gold’s Next Destination? 🎯
Once we have a buying position, where will our target be?
Short-term target: The "Sell Scalping FVG" zone around $3969 could be a minor resistance point where some traders will take profits.
Main target: The ultimate destination this structure is aiming for is the "Sell Gold Liquidity" zone at $3998. This is an important "liquidity" area, concentrating many stop-loss orders of the Sellers. Prices are often attracted to these zones like a "magnet" to sweep liquidity before making further moves.
Summary & Advice
Main trend: UP.
Primary strategy: Buy on dip when prices correct to important support zones.
Potential buying zones: $3885 (Fibonacci) and $3914 - $3933 (FVG).
Price targets: $3969 (short-term) and $3998 (main target).
Always remember, risk management is the key to surviving in the market. Set reasonable Stop-loss for all your trades.
WHAT DO YOU THINK ABOUT THIS PLAN?
Will Gold retrace to the Fibonacci zone $3885 or react right at the FVG zone $3914? Leave your opinions and perspectives in the comments below. We will discuss together to find the best opportunities!
👇 Don't forget to Like 👍 and Follow my TradingView channel to not miss daily Gold analyses!

XAUUSD SHOWING A GOOD DOWN MOVE WITH 1:10 RISK REWARDXAUUSD SHOWING A GOOD DOWN MOVE WITH 1:10 RISK REWARD DUE TO THESE REASON
A. its following a rectangle pattern that stocked the marketwhich preventing the market to move any one direction now it trying to break the strong resistant lable
B. after the break of this rectangle it will boost the market potential for breakC. also its resisting from a strong neckline the neckline also got weeker ald the price is ready to break in the outer region
all of these reason are indicating the same thing its ready for breakout BREAKOUT trading are follws good risk reward
please dont use more than one percentage of your capitalfollow risk reward and tradeing rules that will help you to to become a bettertrader
thank you

“Gold Price Action: Bullish Momentum with Key Correction ZonesAnalysis of XAU/USD (Gold Spot)
The chart shows a clear uptrend channel, supported by higher highs and higher lows.
Price recently pulled back after testing the $3,915 zone, which is acting as a short-term resistance.
Multiple support zones are highlighted (around $3,760 and $3,700), which can provide strong buying opportunities on retracement.
The structure suggests impulse–correction–impulse movement, aligning with bullish continuation patterns.
Bullish Scenario
If price holds above the $3,760–$3,780 support, continuation towards $3,915 (previous high) is expected.
A breakout above $3,915–$3,920 will open the door for further upside, targeting $3,960–$3,980.
Bearish Scenario
If price breaks below the trendline support (~$3,760), deeper correction is possible toward $3,680–$3,640 (TP1 zone).
That zone is mentioned on the chart as a strong re-entry point for long positions.
✅ Suitable Target (Bullish):
Immediate Target: $3,915 (previous high)
Extended Target: $3,960 – $3,980
⚠️ Correction Target (Bearish Pullback):
$3,680 – $3,640 (strong buy zone for re-entry)

Gold Breaks $3900: Safe-Haven Demand Soars & Fed Fuels the Rally📊 Market Context
Gold continues to assert its strength by breaking the psychological barrier of $3,900, becoming the central asset amidst financial and political turmoil.
US government shutdown → defensive capital flows strongly into gold.
Fed expected to cut interest rates by another 0.25 points → further strengthens the advantage for the non-yielding precious metal.
Lack of economic data → investors closely follow private reports, adding uncertainty and supporting gold's role as the “number 1 safe haven”.
👉 Market sentiment is perfectly aligned: USD under pressure, capital moving away from risky assets, BUY side FOMO continues to amplify → gold stands before the opportunity to climb and conquer the 3950–3990 range.
🔎 Technical Analysis (H1/H4)
Main trend: Strong uptrend, price holding above the rising trendline.
BUY ZONE 1: 3904–3902 → Volume CP Zone, supports momentum.
BUY ZONE 2: 3885–3883 → Retest old ATH, accumulation zone for the next rally.
SELL Zone: 3949–3950 → Liquidity Zone, prone to liquidity traps.
Extended target: 3994 (Fib 3.618).
🔑 Key Levels
BUY Zones: 3904–3902, 3885–3883
SELL Zone: 3949–3950
Resistance: 3950, 3994
Support: 3900, 3880
📈 Scenario & Trading Plan
✅ BUY ZONE 1: 3904–3902
SL: 3898
TP: 3910 - 3915 - 3925 - 3935 - 3945 - ???
✅ BUY ZONE 2: 3885–3883
SL: 3878
TP: 3895 - 3905 - 3920 - 3935 - 3945 - ???
⚠️ SELL ZONE (scalp/trap): 3949–3950
SL: 3955
TP: 3940 - 3935 - 3925 - ???
⚠️ Risk Management Notes
Liquidity may sweep above 3950 before adjusting → need to wait for price action confirmation.
Avoid FOMO at the peak, prioritize BUY only when price adjusts to support zones.
Order volume should be slightly reduced before unexpected Fed policy announcements.
✅ Summary
Gold is in the “golden phase” of an uptrend: political instability + dovish Fed + safe haven demand = BUY is the main strategy. Plan to accumulate around 3904–3902 and 3885–3883, with an extended target of 3950–3990. SELL is only a short-term strategy at the liquidity zone.
📢 Follow MMFLOW TRADING for real-time updates & BIGWIN setups with the team!

Gold Hits $394x! New ATH: Fed & BoJ Drive the Rally.Hello, traders!
Gold (XAU/USD) has just delivered a massive breakthrough in the Asian session, setting a New ATH around $394x after comfortably breaching that $3900 level. This strength, bhai, is getting serious support from two big monetary policy moves: Fed rate cut expectations and the likelihood of the BoJ (Bank of Japan) delaying rate hikes due to the new PM. Paisa hi paisa!
Fundamentals & Technical Caution: Mind the FOMO
Dual Drivers: Market sentiment is clear—the Fed is expected to cut rates two more times, and the dovish BoJ outlook only adds more fuel, creating a rock-solid foundation for Gold.
Safe-Haven: The continuous US Shutdown drama and geopolitical tensions are keeping that safe-haven bid strong.
FOMO Warning: The momentum is fierce, but you must avoid buying the high. Prioritize Buying on pullbacks to FVG (Fair Value Gaps) to secure a safer entry point. Discipline is key, boss.
Key Price Levels:
Resistance: $3954, $3963
Support: $3910, $3895, $3883, $3870
Trading Strategy (Absolute Risk Management):
BUY SCALP: $3910 - $3908
SL: $3904
TPs: $3918, $3928, $3938, $3948, $3958
BUY ZONE (FVG): $3895 - $3893
SL: $3885
TPs: $3903, $3913, $3923, $3933, $3943
SELL ZONE (High Risk): $3964 - $3966
SL: $3974
TPs: $3956, $3946, $3936, $3926, $3916
Are you placing your bets on a $4000 target this week? Let me know your plan! 👇
#Gold #XAUUSD #ATH #Fed #BoJ #Shutdown #TradingView #MarketAnalysis #GoldFever

New ATH: Shutdown Fuels Gold's Seventh Straight WinHello, traders!
Gold just sealed its seventh consecutive weekly gain, boss, with futures hitting a whopping $3,908.9/oz. This rally is powered by growing tension over the US Government Shutdown and the solid expectation of a Fed rate cut (97% chance in October, no less!).
Fundamentals & Outlook: Pure Safe-Haven Rally
Political Instability: The prolonged Shutdown is a proper bullish driver now. It's delaying key economic reports, creating huge uncertainty, and attracting big safe-haven capital flows.
Rate Cut Certainty: The market is absolutely banking on a Fed rate cut, giving massive support to non-yielding Gold.
Technicals & Trading Strategy: Focus on $3867
The weekly buying power is super strong. Gold is holding steady near the $3900 mark. The $3867 level is our critical line, bhai; if the price stays above it, the potential for new ATHs remains very high.
Key Price Levels:
Resistance: $3902, $3912, $3922, $3942
Support: $3867, $3855, $3839, $3792
Trading Strategy (Absolute Risk Management):
BUY ZONE 1: $3867 - $3865
SL: $3857
TPs: $3875, $3885, $3895, $3905, $3915
BUY ZONE 2: $3839 - $3827
SL: $3824
TPs: $3847, $3857, $3867, $3877, $3887
SELL ZONE 1: $3902 - $3904
SL: $3912
TPs: $3894, $3884, $3874, $3864
SELL ZONE 2: $3942 - $3944
SL: $3952
TPs: $3934, $3924, $3914, $3904
What's your view? Will the US political drama help Gold finally break past $3900 next week? Tell me below! 👇
#Gold #XAUUSD #ATH #Shutdown #Fed #TradingView #MarketAnalysis #GoldRush

XAUUSD/Gold Weekly Buy Projection (05.10.25) chartXAUUSD/Gold Weekly Buy Projection (05.10.25) chart.
Here’s a clear technical summary of what your chart shows:
🔹 Overall Structure
The chart projects a bullish move for XAUUSD (Gold).
Title: Weekly Buy Projection – 05 Oct 2025
Main trend: Ascending continuation pattern (marked by blue upward trendlines).
Current price zone: around $3,886.45.
🔹 Key Levels
Support S2: around $3,838 – $3,846
Support S1: around $3,870 – $3,878
Resistance 1: around $3,900 – $3,910
Resistance 2 (New ATH): around $3,939 – $3,970
🔹 Pattern & Projections
Golden Ratio (0.618 Fibonacci) formed near $3,874, signaling a retracement support.
Bullish engulfing candle noted at Support S1, confirming buying interest.
Possible Double Top highlighted near Resistance 1, indicating a short-term pullback risk before continuation.
Fair Value Gap (FVG) exists between $3,875–$3,890, suggesting potential liquidity refill before next le

XAU/USD Near Record Highs: Key Data AheadGold (XAU/USD) Technical Outlook – October 3, 2025
1. Macro & News Context
Gold is holding near record highs, heading for its seventh consecutive weekly gain, supported by expectations that the Federal Reserve will continue cutting rates and by concerns around the ongoing U.S. government shutdown. Spot prices have recently tested the ₹3,890–3,900 region and are now consolidating around ₹3,860.
Nonfarm Payrolls (NFP) – Typically scheduled for 18:00 IST on the first Friday of the month, the September jobs report is likely to be delayed due to the U.S. government shutdown.
Key event to watch today:
ISM Services PMI (September) will be released at 19:30 IST. Since ISM data is privately produced, it will be published regardless of the shutdown and may serve as the main volatility catalyst in today’s U.S. session. 【ISM】
Labor market signals: Challenger job cut data showed lower layoffs in September, but planned hiring at the lowest level since 2009, reinforcing a softer employment backdrop. Combined with the Fed’s recent 25 bps rate cut (to 4.00%–4.25%), this continues to support the bullish gold narrative.
USD trend: The dollar has weakened broadly this week, aligning with market bets on further monetary easing. This backdrop provides an additional tailwind for gold.
2. Technical Landscape (H1 Chart)
The attached chart highlights key technical zones and a completed Harmonic XABCD pattern on the 1H timeframe:
Support levels:
Near-term: ₹3,844–3,841
Deeper: ₹3,827 (intraday pivot), ₹3,792 (strong low)
Strategic: ₹3,764–3,770 (Bullish Order Block)
Resistance levels:
Immediate: ₹3,865
Strong supply: ₹3,880–3,890 (Bearish Order Block)
Extended target: ₹3,930–3,940 (Sell Scalping | Fibo zone)
Momentum: After bouncing from point D of the harmonic structure, gold has been forming higher lows (HL). Price currently sits above the longer-term moving average and is testing the shorter-term average, suggesting a constructive short-term bias as long as supports hold.
3. Trade Scenarios
Scenario 1 – Buy-the-dip (preferred bias)
Entry zone: ₹3,844–3,841
Stop loss: Below ₹3,827 (safer: below ₹3,792)
Targets:
₹3,865 (first take-profit)
₹3,880–3,890 (major supply)
Stretch: ₹3,930–3,940
Rationale: Higher low formation, bullish macro backdrop, aligned with strong weekly uptrend.
Scenario 2 – Countertrend short at resistance
Trigger zone: ₹3,880–3,890 (Bearish OB)
Confirmation: Rejection candles (H15–H1) such as wicks, engulfing, or failed breakout.
Stop loss: Above ₹3,895–3,900 (or above ₹3,945 if price spikes into the ₹3,930–3,940 fib zone).
Targets: ₹3,865 → ₹3,844 → ₹3,827
Rationale: Potential liquidity sweep ahead of ISM, with profit-taking likely near supply zones.
Scenario 3 – Breakdown through support
Trigger: 1H close below ₹3,841
Path: ₹3,827 → ₹3,792 (Strong Low) → ₹3,764–3,770 (Bullish OB)
Rationale: Loss of intraday structure would flip bias short until major demand zones.
4. How to Trade Around Today’s Data
If NFP is indeed delayed, the 18:00 IST slot may bring limited volatility.
Focus instead on the ISM Services PMI at 19:30 IST, which could trigger sharp swings in both USD and gold.
Adjust position sizing: Expect spread widening and slippage around the release. Reduce leverage or scale into positions.
5. Risk Management
Limit risk per trade to 0.5–1% of account equity.
Avoid chasing price once levels are tested; wait for H15–H1 candle closes for confirmation.
Monitor the U.S. Dollar Index (DXY) and Treasury yields – further dollar weakness would reinforce bullish gold setups.
🔑 Key Takeaway
Gold remains structurally bullish in the broader trend, with immediate support at ₹3,841–3,844 critical to maintain upside momentum. Watch for reactions around ₹3,880–3,890 and ₹3,930–3,940. With NFP possibly delayed, the ISM Services PMI at 19:30 IST will be today’s most important catalyst for directional moves.

Gold Correction: Fed Warning vs. Massive Safe-Haven Flows Hello, traders!
Gold pulled back to $3,845.78/oz after Dallas Fed President Lorie Logan called for caution regarding further rate cuts.
Fundamentals: Fed Warns, But the Buying Wave is Unstoppable
The market stands at a crossroads:
Downward Pressure: The caution signal from Fed's Logan.
Upward Momentum: Government shutdown (increases instability, delays jobs report), weak private sector jobs data (down 32k), and SPDR Gold Trust ETF holdings rising to the highest level since 2022.
Conclusion: Political instability and weak economic data continue to reinforce the likelihood of a Fed rate cut. Massive safe-haven capital is flowing into Gold.
Technical Analysis & Strategy
Gold retreated to the FIBO 0.618 - 0.5 zone, indicating a healthy technical correction after the sharp rally. Priority remains Buy if the price holds above $3861. Be cautious of Stop Loss hunting.
Resistance: $3870, $3884, $3894
Support: $3855, $3833, $3798
Trading Strategy (Tight SL):
BUY SCALP: $3838 - $3836 / SL: $3832 / TP: $3846 - $3857
BUY ZONE: $3798 - $3796 / SL: $3788 / TP: $3816 - $3836
SELL ZONE: $3888 - $3890 / SL: $3898 / TP: $3870 - $3850
Do you think the Fed's warning is strong enough to reverse this trend? 👇
#Gold #XAUUSD #Fed #GovernmentShutdown #TradingView #PhânTíchVàng #ETF

Daily Plan: Gold Targets 7th Straight Weekly Gain |MMFLOWTRADING📊 Market Context
Gold holds firm above $3,850, aiming for its 7th consecutive weekly gain.
🔥 Main driver: Risks from a prolonged U.S. government shutdown.
📉 54% probability of the shutdown lasting 29 days (Polymarket) → directly impacting gold sentiment.
🛡 Safe-haven demand & BUY-side FOMO keep fueling momentum.
⚖️ Still, profit-taking at higher resistance zones could trigger sharp swings before the next directional move.
🔎 Technical Analysis (H1/H4)
📈 Main trend: Bullish, but consolidating near 3,850.
🚧 Key Resistances: 3882–3884 & 3934–3936 (Liquidity Sell Zones).
🏦 Key Supports: 3797–3795 & 3756–3754 (Buy Zones).
🎯 Key Levels: 3850 – 3880 – 3900.
📈 Trading Scenarios & Plan
✅ SELL ZONE 1: 3882–3884
SL: 3890
TP: 3878 – 3874 – 3870 – 3865 – 3860 – 3850 – 3840 – ???
✅ SELL ZONE 2: 3934–3936
SL: 3940
TP: 3930 – 3925 – 3920 – 3910 – 3900 – ???
✅ BUY ZONE 1: 3797–3795
SL: 3790
TP: 3800 – 3810 – 3820 – 3830 – 3840 – ???
✅ BUY ZONE 2: 3756–3754
SL: 3750
TP: 3760 – 3770 – 3780 – 3790 – 3800 – ???
⚠️ Risk Management Notes
🌀 U.S. shutdown headlines may spark unexpected volatility.
🕵️♂️ Focus on BUY setups at support, avoid chasing FOMO at highs.
❌ Consider SELL only if clear rejection signals form at resistance zones.
✅ Summary
Gold remains supported by safe-haven flows, eyeing a 7-week winning streak.
🎯 Strategy:
BUY setups: 3797–3795 & 3756–3754.
SELL setups: 3882–3884 & 3934–3936.
📢 Follow MMFLOW TRADING for real-time updates & BIGWIN setups!
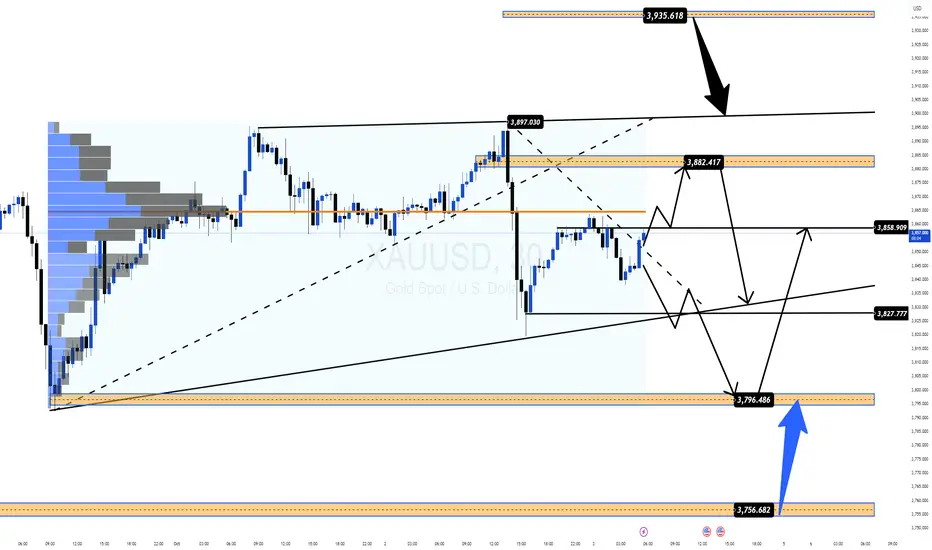
(XAU/USD) – Gold likely to touch $4,000/oz: Ideal buying levels?1. Market Structure & Trend Outlook
On the H1 chart, gold is sustaining its bullish structure with higher highs and higher lows.
After the BoS (Break of Structure), price retraced near 3,862 Buy Zone and bounced upward.
At present, price trades above EMA34 and EMA89, keeping bullish bias intact.
2. Important Levels
Buy Zone: 3,862 – 3,865. Acts as short-term support. Holding above strengthens the bullish case.
OB1: 3,806 – 3,810. Next support in case Buy Zone breaks.
OB2: 3,763 – 3,770. Deeper support, triggered only if market corrects heavily.
Sell Scalping Zone (Fibo): 3,912. A short-term resistance, profit booking expected.
Sell Zone / ATH: 3,933 – 3,935. Breakout here may lead to fresh record highs.
3. Trade Setups
Bullish Setup: Buy on retest of 3,862 – 3,865.
SL: Below 3,850.
TP1: 3,912.
TP2: 3,933 – 3,935.
Bearish Setup (Defensive): If below 3,860, expect test of 3,806 – 3,810.
If this fails, price may decline towards 3,763 – 3,770.
4. Conclusion
Trend remains positive on H1. Best strategy: Buy on dips near support, manage SLs carefully, and book partial profits near resistances. Sustaining above 3,933 may open doors for new highs.

Gold Record: Shutdown 'Blinds' the Fed Hello, traders!
Gold shows absolutely no sign of slowing down, closing the October 1st session at $3,866.66/oz, while futures contracts hit a record high of $3,897.50/oz. The precious metal has climbed nearly 50% year-to-date and just set its 39th record high this year!
Fundamental Analysis: Shutdown Risk Hits at the Worst Time
While government shutdowns usually have a minor impact, the timing of this one is critical:
Delayed Jobs Data: The crucial jobs report (scheduled for Oct 3rd) will be postponed. This uncertainty will leave the market and the Fed 'blind' regarding the economy's health just weeks before the next policy meeting, triggering strong demand for safe-haven assets (Gold).
Threat of Staff Cuts: President Trump threatened to use the shutdown to cut "a lot of" federal employees, escalating tensions beyond typical closures and increasing political instability.
Technical Analysis & Trading Strategy
Gold accelerated past the $387x region during the US session, confirming the upward momentum is still very strong. However, the market is prone to more "Stop Loss hunting" (liquidity sweeps). Continue to Prioritize Buy, but manage SL carefully due to wider price swings.
Resistance: $3887, $3895, $3904
Support: $3870, $3854, $3843
Suggested Trading Strategy (Absolute Risk Management):
BUY ZONE
Zone: $3870 - $3868 / SL: $3860
TP: $3878 - $3888 - $3898 - $3908
SELL ZONE (High Risk)
Zone: $3903 - $3905 / SL: $3913
TP: $3895 - $3885 - $3875
Gold is running on a foundation of fear. Do you think the $3900 mark will be breached this session? 👇
#Gold #XAUUSD #ATH #Fed #GovernmentShutdown #TradingView #FinancialMarkets #RecordHigh

XAUUSUS | Government Shutdown Confirmed | Gold awaits ADP & ISM🔎 Context & News
US Politics : The US government officially shut down after the Senate failed to pass the federal funding bill. A major political risk catalyst, triggering safe-haven flows into Gold.
FED : Probability of a -25bps rate cut in October rises to 96.2% → almost certain.
Key Events Today (ET / UTC) :
• ADP Employment Change: 08:15 ET / 12:15 UTC
• ISM Manufacturing PMI: 10:00 ET / 14:00 UTC
→ Both will be crucial data points that may shake Dollar and Gold.
📌 Summary : US politics + FED easing = Gold remains supported, but ADP & ISM tonight could spark strong volatility in the US session.
📈 Technical Analysis (H1)
Main Trend : Bullish after multiple BoS.
EMA : EMA 34 > EMA 89 → bullish momentum intact.
Resistance :
3,897 – 3,907 (Sell scalp – Fibo 0.5–0.618).
3,920 – 3,921 (Liquidity / ATH test).
Support :
3,872 – 3,876 (old high retest).
3,833 – 3,841 (OB zone).
3,814 – 3,822 (deep Support Zone – losing this shifts bias).
🎯 Trade Plan
✅ Buy (trend priority)
Buy Zone 1 : 3,872 – 3,876
• SL: 3,869
• TP: 3,897 → 3,907 → 3,920
Buy Zone 2 (OB) : 3,833 – 3,841
• SL: 3,826
• TP: 3,872 → 3,897 → 3,907
Buy Zone 3 (Deep Support) : 3,814 – 3,822
• SL: 3,808
• TP: 3,841 → 3,872 → 3,897
⚡ Sell (short scalps only – lower RR)
Sell Zone 1 : 3,897 – 3,907
• SL: 3,912
• TP: 3,885 → 3,876 → 3,841
Sell Zone 2 (ATH sweep) : 3,920 – 3,921
• SL: 3,925
• TP: 3,907 → 3,885 → 3,876
📝 Conclusion
Gold remains strongly supported by the US government shutdown + FED rate cut expectations.
Strategy today: Prioritize Buy at support; Sell only for short scalps around 3,907 – 3,921.
⚠️ Watch out: ADP & ISM tonight may trigger unexpected volatility → manage risk carefully and move SL to BE after TP1.
📢 If you find this Captain’s Log useful, don’t forget to Follow Captain Vincent ⚓ for the latest updates.
💬 What do you think, crew? Will Gold break ATH 3,920 right after ADP & ISM tonight?

ATH $3871: Shutdown Fear & 97% Fed Cut Fuel Gold Surge
Hello, investors and traders!
Gold continues to show phenomenal strength, setting a new ATH at $3,871.45/oz (on Sept 30), and closing at $3,843.43/oz. This gain confirms the strongest September since 2011, solidly confirming the explosive growth trend for the yellow metal.
Fundamental Analysis: Politics and the Fed Drive Buying Wave
Two core drivers are pushing gold prices higher, making any attempt to short (call the top) extremely risky:
Political Instability: The risk of a looming US Government shutdown is ratcheting up uncertainty and strongly boosting safe-haven demand.
Low-Rate Expectations: Weakening US jobs data has nearly locked in the probability that the Fed will cut interest rates in October. The market is currently pricing in a 97% chance of a Fed rate cut.
Technical Analysis & Trading Strategy
After a recent shock drop of 70 points, Gold quickly absorbed the selling pressure and created a new ATH, proving that buying pressure is overwhelming. The strong upward bias is undeniable.
Outlook: Continue to Prioritize Buy given the powerful trend and supportive fundamentals. Only attempt Sell strategies near psychological resistance levels with an extremely tight Stop Loss (SL).
Key Resistance: $3894, $3904, $3914, $3924
Key Support: $3869, $3843, $3834
Suggested Trading Strategy (Absolute Risk Management):
BUY SCALP
Zone: $3870 - $3868 / SL: $3864
TP: $3875 - $3885 - $3900
BUY ZONE
Zone: $3834 - $3832 / SL: $3824
TP: $3842 - $3862 - $3892
SELL SCALP (High Risk)
Zone: $3904 - $3906 / SL: $3910
TP: $3901 - $3891 - $3876
SELL ZONE (High Risk)
Zone: $3925 - $3927 / SL: $3935
TP: $3917 - $3907 - $3897 - $3887 - $3877 - $3867
The market is running on fear and rate-cut anticipation. Are you betting on the $3900 mark this week? 👇
#Gold #XAUUSD #ATH #Fed #GovernmentShutdown #TradingView #InterestRates #FinancialMarkets

XAUUSD – Gold Smashes to New ATH: Bulls in Full Control📊 Market Overview
Gold has surged into uncharted territory, breaking through to a fresh All-Time High (ATH). The earlier dip toward 3,800 USD acted as nothing more than a springboard, allowing buyers to reload before launching this powerful breakout.
Safe-haven demand continues to fuel the rally, as concerns over a potential US government shutdown and expectations of more Fed rate cuts strengthen bullish momentum.
📍 Crucial Levels to Watch
🔴 SELL Reaction Zone
3,911 – 3,915 (Liquidity Resistance) → Potential short-term ceiling, profit-taking may appear here.
🟢 BUY Reaction Zones
3,830 – 3,820 (Fibo Support) → First pullback level for intraday buyers.
3,808 – 3,810 → Secondary support zone for a deeper correction.
3,747 – 3,752 (Liquidity BUY Zone) → Stronger base for swing buyers.
🎯 Trading Setups
1️⃣ Buy the Dip (Primary Play)
Entry: 3,830 – 3,820, confirmation needed.
Targets: 3,900 → 3,915, extend toward 3,950+ if momentum remains strong.
Stop: Below 3,808.
2️⃣ Sell the Spike (Countertrend)
Entry: 3,911 – 3,915, only on visible rejection.
Targets: 3,871 → 3,830.
Stop: Above 3,922.
3️⃣ Swing Buy Opportunity
Entry: 3,752 – 3,747 (Fibo confluence).
Targets: 3,830 → 3,900.
Stop: Below 3,735.
⚡ Pro Tips
Trend bias = Strongly Bullish, prioritize long setups.
Countertrend shorts are tactical; keep stops tight.
Headlines from the US political scene and Fed could trigger extra volatility at highs.
💬 Discussion
Will gold extend to 3,950 – 4,000 USD, or is a sharp pullback around the corner? Drop your views and charts below 👇

US Government Shutdown, Gold Benefits & FOMO BUY Continues📊 Market Context The gold market kicks off Q4/2025 with great enthusiasm as safe-haven flows continue to surge.
Not only that, the potential delay of the NFP employment report this week further fuels the market's "thirst" for directional information, positioning gold as the central asset in everyone's sights. Meanwhile, the USD is under pressure from political uncertainties and expectations that the Fed is moving closer to further rate cuts.
Combined, the current picture shows that gold is not only maintaining its strength after a breakout rally but also has the opportunity to expand and conquer new high price territories, as safe-haven capital and FOMO momentum from the BUY side continue to amplify.
🔎 Technical Analysis (H1/H4)
The price maintains the main upward trend, staying above the support structure.
Important BUY ZONE: 3833–3831 (Fibo + CP zone) – this area is likely to react strongly.
Secondary BUY ZONE: 3817–3815 (OBS zone) – stronger support, suitable for accumulating additional BUY orders.
Resistance area 3919–3923 (Liquidity Sell Zone) may be where liquidity traps appear.
✅ BUY ZONE 1: 3833–3831
SL: 3827
TP: 3838 - 3842 - 3846 - 3850 - 3855 - 3860 - 3870 - ???
✅ BUY ZONE 2: 3817–3815
SL: 3810
TP: 3822 - 3826 - 3830 - 3835 - 3840 - 3850 - 3860 - 3870 - ???
✅ Summary Gold is directly benefiting from political instability and the delay in US economic data. The main trend remains BUY with safe-haven flows, with strategic zones at 3833–3831 and 3817–3815. The expansion target aims for 3870–3880 and beyond to 3920+ if buying momentum remains strong.

GOLD ATH: US Shutdown Drama! Buy The Dip, Yaar? Gold just smashed a new record at $3,833.37/oz (Sept 29) on high safe-haven demand due to the impending US Govt shutdown (Oct 1) and solid FED rate cut hopes. USD pullback (0.2%) also playing its part.
The sudden dip to $3,794 looks like pure end-of-month profit-booking, not a proper reversal. If US tensions worsen, the Buy opportunity is still very much active!
📈 Technical View & Intraday Trade Setup
Gold has done a major flush, stopping out the weak hands. Selling pressure is there, but the drop without big news suggests caution. Look for a technical bounce to fill the FVG before a potential continuation lower.
Key Levels:
Resistance: $3827 / $3846 / $3870
Support: $3787 / $3778 / $3763
Detailed Trading Strategy (US Session):
1. BUY Zone (Aggressive Dip Buy):
Entry: $3784 - $3782
SL: $3774
TP: $3792 / $3812 / $3832
2. SELL Scalp (Quick Short):
Entry: $3827 - $3829
SL: $3833
TP: $3824 / $3814 / $3804
3. SELL Zone (Main Short Entry):
Entry: $3866 - $3868
SL: $3876
TP: $3858 / $3838 / $3818
⚠️ Alert! The US Government Shutdown news is the main event. If budget talks are positive, Gold might see a sharp fall. Manage risk (SL) like a boss!
Kya lagta hai? Will Gold fly to $4K or take support near $378x? 👇
#XAUUSD #Gold #MCX #TradingStrategy #USShutdown #FED #TechnicalAnalysis #Intraday #MarketUpdate #Commodities

Gold 30/09 - Safe-haven flows surge | Gold sails toward new ATH 🟡 XAU/USD – 30/09 | Captain Vincent ⚓
🔎 Captain’s Log – Context & News
US Politics : Meeting between Trump and bipartisan leaders ended without agreement → growing risk of a US government shutdown by Wednesday.
Conflict : Democrats demand concessions, Republicans fiercely oppose → wide gap remains, both sides blaming each other.
Market : Investors watch JOLTS data and speeches from 3 FED members, but political risks are the strongest catalyst for Gold.
Trend : Safe-haven flows keep pouring into Gold → increasing likelihood of testing new ATH.
⏩ Captain’s Summary : US political seas are stormy, Gold becomes the fortress of safety. The voyage toward ATH is widening.
📈 Captain’s Chart – Technical Analysis (H1)
EMA : EMA 34 (yellow) > EMA 89 (red) → bullish trend clearly dominant.
Golden Harbor (Support / Buy Zone)
Big Volume Dock: 3,827
Storm Breaker (Resistance / Sell Zone)
ATH test: 3,916 – 3,917
Market Structure : Gold broke out strongly, now trading around 3,870. Main trend remains bullish, with 3,842 – 3,827 as key anchor zones.
🎯 Captain’s Map – Trade Plan
✅ Buy (main priority)
Buy Zone 2 – Big Volume
Entry: 3,827 – 3,824
SL: 3,815
TP: 3,870 – 3,899 – 3,916
⚡ Sell (short scalp – high risk)
Sell Zone – ATH test
Entry: 3,917 – 3,920
SL: 3,925
TP: 3,899 – 3,870 – 3,856
⚓ Captain’s Note
“The Golden sails are filled by safe-haven winds, pushing the ship close to ATH. Golden Harbor 🏝️ (3,842 – 3,827) is the ideal dock for sailors to position Buys. Storm Breaker 🌊 (3,916 – 3,920) may unleash violent waves, suitable only for short Quick Boarding 🚤 scalps. If the political storm from Washington breaks out, Gold’s voyage could surpass the peak and expand its horizon.”
📢 If you find the Captain’s Log useful, don’t forget to Follow for the earliest updates.
💬 What’s your view, crew? Will Gold conquer ATH around 3,917 this week?

H1 bullish momentum intact | Buy 3,792–3,765, target 3,821🟡 XAU/USD – 29/09/2025 | Captain Vincent ⚓
🔎 Captain’s Log – Structure & Trend
H1 continues to print consecutive BoS → bullish trend sustained.
Price broke the long-term downtrend line and surged to new highs.
EMA 34 & EMA 89 both pointing up and below price → confirming short-to-mid-term bullish momentum.
📈 Captain’s Chart – Key Zones
Storm Breaker (Sell Zone / ATH test) : 3,818 – 3,821
Golden Harbor (FVG – Buy Zone) : 3,792 – 3,779
OB Harbor 1 : 3,772 – 3,765
OB Harbor 2 (deeper) : 3,731 – 3,724
Core Idea: 3,792 – 3,765 is the main support “cushion” for trend-follow Buys; 3,818 – 3,821 is the wave edge where profit-taking may occur.
🎯 Captain’s Map – Trade Plan
✅ Golden Harbor (BUY – main priority)
Buy Zone 1 – FVG (3,792 – 3,779)
Entry: 3,792 – 3,779
SL: 3,765
TP: 3,805 – 3,818 – 3,821+
Buy Zone 2 – OB1 (3,772 – 3,765)
Entry: 3,772 – 3,765
SL: 3,758 (below 3,765)
TP: 3,792 – 3,805 – 3,818 – 3,821
Buy Zone 3 – OB2 deep (3,731 – 3,724)
Entry: 3,731 – 3,724
SL: 3,714
TP: 3,745 – 3,765 – 3,792 – 3,805
⚡ Quick Boarding (SELL – scalp only)
Sell Zone – Storm Breaker (3,818 – 3,821)
Entry: 3,818 – 3,821
SL: 3,828
TP: 3,805 – 3,796 – 3,792
Breakdown Short (conditional)
Only consider Short if H1 closes below 3,724
SL: 3,735
TP: 3,710 – 3,700 – 3,690
⚓ Captain’s Note
“The Golden sails remain filled after consecutive BoS . Golden Harbor 🏝️ (3,792 → 3,765) is the anchor dock to board in trend’s direction. Storm Breaker 🌊 (3,818 – 3,821) may trigger profit-taking waves – only go Quick Boarding 🚤 if clear signals appear. If the tide drags below 3,724, let the ship retreat to OB2 to gather strength before resuming the northbound voyage.”

New ATH Above 3800 & FOMO Buying Still Driving the Market📊 Market Context
Gold has once again set a new all-time high above 3800 USD/oz, showing no signs of losing bullish momentum. The surge is fueled by strong FOMO buying flows, as traders continue to pile into safe-haven assets.
Concerns about a possible US government shutdown and renewed discussions around tariff policies have weighed on the dollar, while expectations of upcoming Fed rate cuts keep gold supported. Meanwhile, Fed speeches and incoming US data remain key drivers that could inject short-term volatility, but the broader bullish narrative remains intact.
🔎 Technical Analysis (H1/H4)
Price is firmly holding above the 3800 psychological level, confirming the breakout.
Buy zones remain intact at 3790–3792 and 3784–3782, with solid demand expected on any dip.
Sell liquidity sits around 3823–3825, where short-term profit-taking or traps may emerge before the next leg higher.
🔑 Key Levels
Resistance / Sell Zone: 3823–3825
Support / Buy Zones: 3790–3792, 3784–3782
📈 Scenarios & Trading Plan
BUY ZONE 1: 3790–3792
SL: 3786
TP: 3795 - 3800 - 3810 - 3820 - 3830 - ???
BUY ZONE 2: 3784–3782
SL: 3778
TP: 3790 - 3795 - 3800 - 3810 - 3820 - 3830 - 3840 - ???
SELL ZONE (Liquidity Trap Zone): 3823–3825
SL: 3830
TP: 3818 - 3814 - 3810 - 3805 - 3800 - ???
⚠️ Risk Notes
Beware of liquidity sweeps near 3823–3825 before continuation higher.
Fed comments and macro data may cause sudden spikes — adjust risk accordingly.
Stick to confirmation entries around zones to avoid being trapped by false moves.
✅ Summary
Gold is riding strong FOMO-driven bullish momentum, printing new highs above 3800. Main bias: buy on dips at 3790–3782, while monitoring short-term sell liquidity at 3823–3825 for potential pullbacks. The broader trend remains bullish, so patience and disciplined entries will be key.

Gold Spot Price Technical Analysis [28-09-2025]Gold Spot Price Technical Analysis - Based on the chart, the XAU/USD daily chart shows an ascending triangle pattern, which is generally considered a bullish signal. The price is currently near a breakout level around 3435.06, with a potential target near 3900.00 if the upward trend continues. The RSI (14) at 74.53 suggests the asset is in overbought territory, which could indicate a potential pullback or consolidation.
