XAUUSD: Bulls Eyeing a Spark from the 3357 – 3352 Launchpad!We witnessed a strong bullish surge in Gold following Friday's event-driven move. Now, XAUUSD is pulling back toward a key support zone at 3357–3352, where fresh buying interest is likely to emerge. A confirmed bounce from this area could pave the way for a bullish reversal and a push toward higher targets.
🔻 Trade Setup
Entry: Buy at 3357 | Add on dips near 3352
Targets: Refer to marked zones on the chart
Invalidation: Setup becomes invalid on a daily close below 3346
📌 Risk-Reward Outlook
This setup offers a tight downside risk with strong upside potential. Stick to disciplined risk management and adjust your position size accordingly to suit your strategy.
👍 If this idea resonates with your view, drop a like and share your thoughts in the comments — let’s learn and grow together!
Happy Trading,
– The InvestPro Team
Xauusdsignal

Gold Weekly Plan: Correction or New Rally Ahead? 🇮🇳Gold surprised everyone last week with a strong rally after the Jackson Hole symposium. The weakness in USD gave bulls fresh momentum, and now traders are once again eyeing the possibility of a new ATH in the coming weeks.
But remember — after every big impulse, the market loves to test patience. A short-term correction is possible before the next strong leg up. This is where smart traders prepare, while emotional traders often get trapped.
📊 Technical Outlook (H4 Chart)
Gold is moving inside a tight triangle pattern, signaling that a breakout is close.
Friday’s bullish candle shows the market still favors buyers, but watch out: gold often dips lower before making a major breakout move.
The strategy? Stay disciplined and only enter at confirmed Key Levels.
📌 Key Levels to Watch
Resistance: 3370 – 3383 – 3400 – 3425
Support: 3350 – 3340 – 3326 – 3315
🔥 Trading Plan (MMFlow Strategy)
BUY ZONE 🟢
Entry: 3340 – 3338
SL: 3334
Targets: 3345 – 3350 – 3355 – 3360 – 3370 – 3380 – 3390 – 3400+
SELL ZONE 🔴
Entry: 3400 – 3402
SL: 3407
Targets: 3395 – 3390 – 3385 – 3380 – 3375 – 3370
✨ Question for Indian Traders: Do you think Gold will retest supports first or break 3400 directly? 🚀

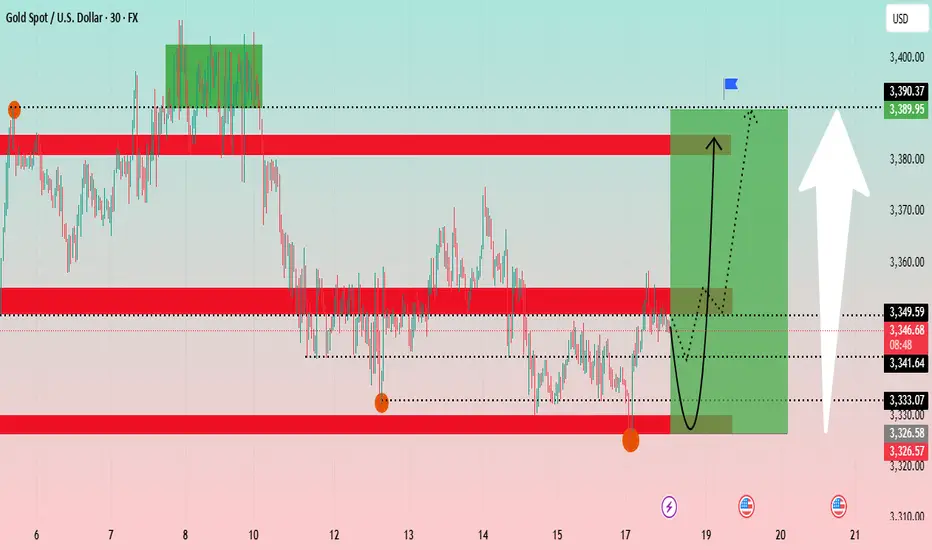
Gold Technical Analysis: Navigating Key Support ?The Gold chart shows a 30-minute timeframe analysis, highlighting recent price consolidation and potential future trends. The analysis suggests a potential V-shape recovery for gold.
Key Levels: The price is currently at a critical juncture, having tested a support zone around 3,326 - 3,333 USD. This zone has proven to be a strong base. Above it, a significant resistance zone is identified between 3,349 - 3,353 USD. Further up, another major resistance is at approximately 3,389 USD.
Price Action: The price has recently experienced a sharp decline and is now in a consolidation phase. The chart projects a potential bounce from the current levels, indicated by the black curved arrow, with the target being the upper resistance zone around 3,389 USD. The green shaded box illustrates the potential upward movement from the current position.
Conclusion: Gold appears to be at a key support level and could be poised for a rally if it successfully breaks above the immediate resistance zone.
Bitcoin (BTC/USDT) 4-Hour Chart Analysis
The Bitcoin chart shows a 4-hour timeframe analysis, focusing on a short-term uptrend channel.
Key Levels: The price is trading within an ascending channel. A significant support zone is identified between 112,000 - 114,000 USDT. A "weak supply zone" is marked around 118,000 USDT, which is currently acting as support. A major resistance is at approximately 124,564 USDT.
Price Action: After a strong push towards the channel's upper boundary, the price has pulled back and is now retesting the "weak supply zone." The blue and red arrows project two possible scenarios: a bounce back up towards the channel's high, or a deeper retracement towards the channel's lower trendline. The price movement appears to be following the blue projected path.
Indicators: The Ichimoku cloud and RSI strategy are used to confirm the trend and identify entry/exit points. The price is above the Ichimoku cloud, indicating a bullish trend.
Conclusion: Bitcoin is at a pivotal point within its uptrend channel. Its ability to hold the 118,000 USDT level will be crucial for a potential re-test of the 124,564 USDT resistance.
Gold (XAUUSD) – Key Support Zone in Play: 3330–3315Gold is currently approaching a critical support zone at 3325–3315, where buying interest is expected to build. A confirmed bounce from this area could trigger a potential bullish reversal and a move toward higher targets.
🔻 Trade Setup
Entry: Buy at 3327 | Add on dips near 3310
Targets: Refer to marked zones on the chart
Invalidation: Setup invalid if price closes below 3304
📌 Risk-Reward Outlook:
Tight downside risk with strong upside potential. Stick to your risk management rules and adjust your position size accordingly.
👍 If this setup resonates with you, give it a like and share your thoughts below. Let’s grow and win together!
Happy Trading,
– The InvestPro Team

XAUUSD – Gold getting ready for a big breakout!Gold is moving exactly as expected: consolidation – breakout – consolidation again. Right now, price is forming a tight triangle pattern, showing strong pressure for the next move.
👉 With both technical setup and global macro headlines creating indecision, the market is waiting for a clear breakout. Once it happens, we can expect a strong trend in either direction.
🔑 Key Levels
Resistance: 3337 – 3343 – 3350 – 3356 – 3365
Support: 3325 – 3320 – 3314
📌 Buy Plan
Buy Zone: 3316 – 3314
SL: 3309
TP: 3320 – 3325 – 3330 – 3335 – 3340 – 3345 – 3350 – 3360 – 3370
📌 Sell Plan
Scalp Sell: 3348 – 3350
SL: 3355
TP: 3344 – 3340 – 3335 – 3330
Sell Zone: 3365 – 3367
SL: 3372
TP: 3360 – 3355 – 3350 – 3345 – 3340
🎯 MMFLOW Note
The tighter the range, the stronger the breakout.
Always prepare for both bullish & bearish scenarios.
Wait for confirmation at the Key Levels before taking positions.

XAUUSD Bullish Breakout! Ready to Ride Gold’s Pre-FOMC Pump? XAUUSD Bullish Breakout! Ready to Ride Gold’s Pre-FOMC Pump? 🇮🇳
Subheader:
Gold surged past short-term resistances overnight – here’s a clear plan for Indian traders to scalp, swing, and ride the bullish momentum safely.
📊 Market Outlook – MMFLOW India Edition
Primary Bias: Bullish – Buy the dips
Key Observations:
Gold broke through the descending trendline and short-term resistance in a single session.
Early pre-FOMC breakout confirms strong bullish momentum.
Market cleared liquidity below and reclaimed higher zones – bullish case remains strong.
Scenarios:
🔹 Buy near strong support zones (dip-buying opportunities)
🔹 Tactical sells only at confirmed resistance with clear rejection
Technical Insight (Daily Chart):
Strong bullish confirmation candle – pullbacks are ideal reload points for long positions.
🔥 Trading Plan – Buy/Sell Zones & Scalp Strategy
✅ BUY SCALP
Entry: 3333 – 3331
Stop Loss: 3327
Take Profit: 3338 – 3343 – 3348 – 3352 – 3356 – 3360
✅ BUY ZONE (Swing / Positional Trades)
Entry: 3316 – 3314
Stop Loss: 3310
Take Profit: 3320 – 3325 – 3330 – 3335 – 3340 – 3350 – 3360
🔻 SELL ZONE (Tactical)
Entry: 3368 – 3370
Stop Loss: 3375
Take Profit: 3364 – 3360 – 3355 – 3350 – 3345 – 3340 – 3330
📌 Key Levels to Watch
Support Levels: 3332 – 3323 – 3315
Resistance Levels: 3348 – 3362 – 3370 – 3383
🚨 Risk Note for Indian Traders
If price dips deep into 331x, watch out for liquidity traps.
Always stick to TP/SL rules – volatility is high around FOMC events.
✨ MMFLOW Reminder
Key Levels = Profits
Buy the dips, ride the bullish momentum
💡 Pro Tips for TradingView India Users
Bookmark support & resistance zones
Observe liquidity sweeps before major news
Use scalp or swing strategies depending on your timeframe

Gold Price Awaits FOMC – Liquidity Levels in PlayGold price continued to slide into liquidity zones during the late US session yesterday and reacted perfectly at the MMFLOW BUY ZONE 3314 – 3316, delivering over +70 pips profit to traders ✅.
At present, on M5–M15, Gold is showing signs of a short-term recovery. However, for a strong upside move, buyers must break through the 3320 – 3322 resistance zone. A confirmed breakout here could trigger momentum towards higher KeyLevels, allowing price to retest important supply zones.
📈 Upside Targets (Intraday): 333x and 334x remain the key areas to watch for take-profits or potential reversal setups.
🔔 Why This Week Matters – The FOMC Decision
The highlight of the week is the FOMC meeting during the US session. Markets are awaiting clarity on the Fed’s next move. Any hint towards a September rate cut could trigger massive bullish momentum, breaking Gold out of its corrective channel.
👉 Asian & European sessions: Focus remains bullish toward 333x – 334x, with potential SELL setups at resistance.
⚠️ US session with FOMC: Expect extreme volatility – risk management is critical.
📉 MMFLOW Technical Trading Plan
🔹 BUY Scalp Setup
Entry: 3311 – 3309
SL: 3305
TP: 3315 → 3320 → 3325 → 3330 → 3340 → 3350 → 3360+
🔹 BUY Zone (FOMC Plan)
Entry: 3290 – 3288
SL: 3282
TP: 3295 → 3330 → 3335 → 3340 → 3350 → 3360 → 3370+
🔸 SELL Scalp Setup
Entry: 3342 – 3344
SL: 3348
TP: 3338 → 3332 → 3328 → 3324 → 3320
🔸 SELL Zone (FOMC Plan)
Entry: 3360 – 3362
SL: 3368
TP: 3355 → 3350 → 3345 → 3340 → 3330
⚠️ Key Notes for Indian Traders
FOMC = high volatility event – manage your exposure carefully.
Stick to strict TP/SL discipline to protect capital.
Smart traders know: KeyLevels = Profits ✅
🔥 Follow MMFLOW TRADING for daily Gold price analysis, liquidity maps, and Smart Money insights – designed for Forex & Gold traders in India.

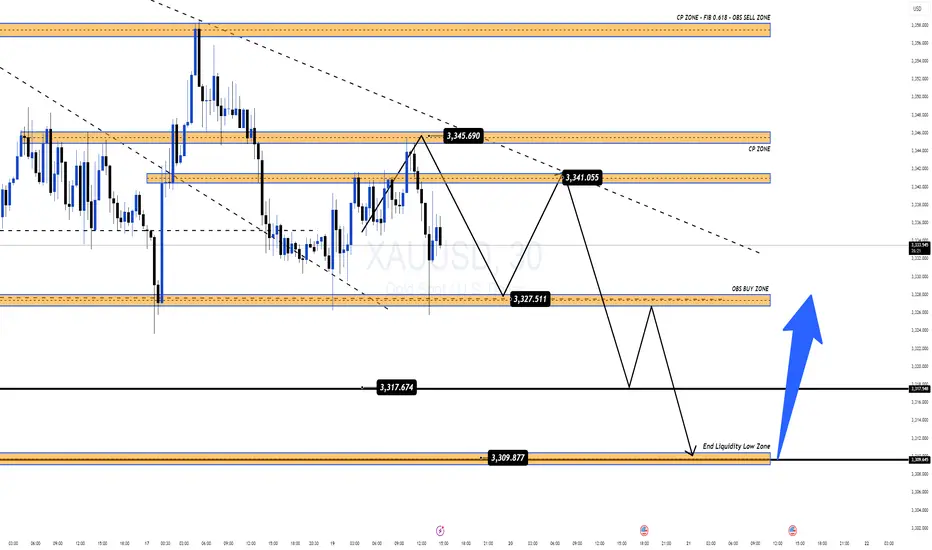
Gold Consolidates Ahead of FOMC Liquidity SweepGold is currently moving within a narrow range, with downside pressure becoming increasingly evident. With just over a day left before the FOMC meeting – an event that could shape the next major trend – the market seems to be preparing for a sharp liquidity sweep.
👉 At first glance, price action looks frustrating and unclear. But for traders following MMFLOW KeyLevels, this is actually the “golden range”, as key zones continue to hold with remarkable precision.
📉 Today’s Outlook
Main Trend: Ongoing corrective downside move.
Potential Scenario: A deep liquidity sweep towards the 331x zone before a strong bullish rebound.
🔑 Key Trading Levels
SELL Zone: 3340 – 3345 | Short SL: 4 – 5$
🎯 Targets: 3325 → 3317 → extended 3310
📌 Note: Manage risk tightly and watch reactions around KeyLevels – a single BreakOut move post-FOMC could unlock the next major opportunity.
✨ Once again: KeyLevels = Profits ✅
👉 Follow MMFLOW TRADING for daily KeyLevel strategies, liquidity maps & smart money insights
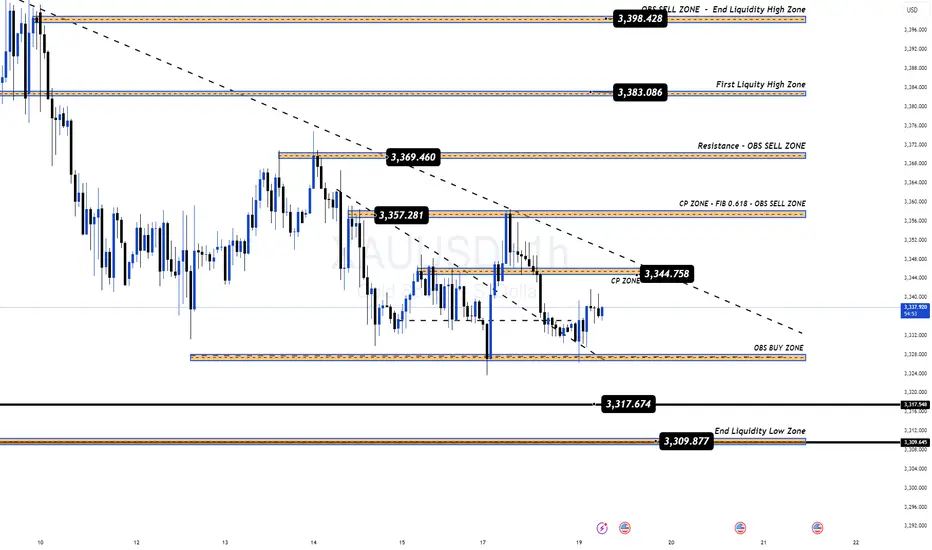
🇮🇳 Gold Under Pressure | Key Levels to Watch TodayGold continues to move in line with our weekly outlook. Despite strong rebounds from liquidity zones, the market still faces heavy selling pressure, unable to break out of the 335x – 336x resistance area.
With no major news events scheduled today, price action is expected to remain within range, making KeyLevels the most important zones to trade from.
📌 Trading Bias Today
Priority remains on SELL setups at upper resistance zones. Adjust entries slightly for better risk–reward.
For BUY positions, wait for deeper entries to avoid liquidity sweeps around 333x – 332x, which have been tested multiple times recently.
🔑 Key Market Levels
Resistance: 3346 – 3357 – 3370 – 3383
Support: 3324 – 3316 – 3309
📌 Trading Plan for India Traders
✅ BUY Zone: 3316 – 3314
SL: 3310
TP: 3320 – 3324 – 3328 – 3332 – 3336 – 3340 – 3350 – 3360+
✅ SELL Zone: 3356 – 3358
SL: 3362
TP: 3352 – 3348 – 3344 – 3340 – 3330 – 3320
⚠️ Summary
Gold remains inside a bearish channel, waiting for a clear breakout. Until major news like the FOMC hits, expect sideways price action within today’s KeyLevels.
👉 Watch reactions closely around 333x – 336x for the next potential move.
Stay disciplined, trade the levels, and let the market show its hand.
GOLD Waiting for the Big BreakOut after FOMC This WeekGold Sideway Compression | Waiting for the Big BreakOut after FOMC This Week
Gold is currently consolidating in a tight range, building up energy for a major BreakOut. After the liquidity sweep at the weekly open, price fluctuated strongly between the 332x – 335x zone, but on the H1 timeframe, the overall trend still remains within a descending channel.
Last week, CPI & PPI data failed to deliver a clear direction. This week, all eyes are on the FOMC meeting, expected to provide stronger signals for gold’s next move.
⏳ Early to mid-week: with limited impactful news, gold may continue to sideway within the narrow range or maintain downside pressure until FOMC is released.
🔑 Key Market Levels
Resistance: 3357 – 3369 – 3383 – 3398
Support: 3335 – 3317 – 3309
📌 Trading Setup
✅ BUY Zone: 3334 – 3332
SL: 3328
TP: 3338 – 3342 – 3346 – 3350 – 3355 – 3360 – 3370 – 3380
👉 If gold breaks the descending channel around 336x, expect a strong move towards 3383 – 3398.
✅ SELL Zone: 3383 – 3385
SL: 3390
TP: 3378 – 3374 – 3370 – 3360 – 3350
👉 If gold fails at higher resistance and reverses, liquidity may be swept back into 333x – 331x, with potential extension down to 329x.
⚠️ Summary
Gold is at a critical decision point: BreakOut or Breakdown.
Before FOMC: sideways / bearish bias within H1 channel.
After FOMC: expect a strong Pump or Dump to define the clear weekly trend.
🔥 Keep a close eye on reactions at KeyLevels (333x – 336x – 338x) to adjust trading strategy accordingly.

XAUUSD Bullish Trend Continuation: Potential Move to $3,400!The price action shows a higher high ("high") and a higher low ("low"), which are characteristic of an uptrend. An upward trendline has been established, connecting a series of higher lows, which is acting as a dynamic support level. A significant horizontal support zone has also been identified around the $3,260 - $3,280 price range, where the price previously found support.
Recently, the price experienced a pullback and bounced off the upward trendline. The analysis anticipates a continuation of the upward momentum toward a key resistance zone. This resistance zone is located around the $3,400 - $3,420 level. A specific target price of $3,408.833 is highlighted within this zone, suggesting a potential area where the upward movement might pause or reverse.
The chart includes a potential corrective wave pattern labeled with "C"s, indicating a recent three-wave pullback within the larger trend. The current price is shown at $3,353.520, positioned above both the horizontal support and the upward trendline, reinforcing the bullish sentiment.

3330 Liquidity Zone – A Fresh Bullish Structure is Emerging!The 3330 liquidity zone continues to prove its strength as gold rebounds sharply from this level, forming a clean new bullish structure on the M30 timeframe. Buyers are now pushing price to trade around 334x, and if this momentum holds, the next upside targets lie at the FIB – CP Zones above 335x and 336x.
On the higher timeframe, the corrective wave is still in play, but short-term price action is opening opportunities for both BUY & SELL setups, provided we time our entries with precision.
Market Context & Key News
Today, the market will be watching the Trump–Putin meeting, which could trigger sharp geopolitical-driven moves.
This Friday also brings the usual liquidity sweep, adding to potential volatility.
That’s why MMFLOW recommends observing the trend closely to pick safe entry points and avoid getting caught in false breaks.
Trading Plan
1. SELL Zones
3355 – Prime OBS SELL ZONE, expecting strong reaction.
3362 – Higher resistance, aligned with the descending trendline. Note: Best to take entries here if reached during Asia or early London; late London/NY session tests are prone to false break traps.
2. BUY Zones
Watch 3334 – 3336 for early BUY entries on lower timeframes.
Safe stop-loss: below 3330.
If 3330 breaks → wait patiently for BUY opportunities around 331x.
Action Strategy
Prioritise early BUYs at 3334–3336 with confirmation signals.
SELL at 3355 or 3362 if clear rejection occurs.
Manage risk strictly – SL below 3330 for BUYs and above 3365 for SELLs.
💡 MMFLOW NOTE: This is gold – volatility can erupt at any moment. Control your emotions, wait for precise setups, and you’ll gain the edge.

Fed Set to Cut 50bps: Gold Gains as the Bullish Wave Forms Again📌 Macro Overview
US Treasury Secretary Bessent gives the green light for a potential 50-basis-point rate cut by the Fed in September.
July CPI remains soft → USD weakens, bond yields fall, boosting gold’s bullish outlook.
Gold briefly touched $3,370/oz, closing at $3,355.9/oz (+0.24%).
Gains capped as US equities continue to break records and geopolitical tensions ease.
Market focus now shifts to PPI data, jobless claims, and the anticipated Trump–Putin meeting for the next directional cues.
🧐 Technical Outlook – MMFLOW Analysis
The bullish recovery wave is clearly re-emerging after a corrective phase, with price hunting liquidity zones left behind in the recent retracement.
Preferred strategy: Trade around key liquidity levels or continuation zones for SELL opportunities; BUY entries will be taken earlier to catch the recovery wave within the current price channel.
Price Structure & Observation Zones:
Short-term uptrend channel intact, primary support at 3336 – 3334 (Liquidity – OBS BUY Zone).
Major resistance at 3394 – 3396 (Liquidity Grab Zone + H1 Supply).
🎯 MMFLOW Trading Plan
🔹 BUY SCALP – Catch the recovery wave
Entry: 3336 – 3334
SL: 3330
TP: 3340 – 3345 – 3350 – 3355 – 3360 – 3365 – 3370 – 3380 – ???
🔹 SELL SCALP – Counter-trend at resistance
Entry: 3394 – 3396
SL: 3400
TP: 3390 – 3385 – 3380 – 3370 – 3360
📊 Key Levels
Resistance: 3365 – 3370 – 3395
Support: 3340 – 3336 – 3330
💡 MMFLOW Strategy Tip:
Wait for price to retest the 3336 – 3334 BUY ZONE for trend-following BUY positions.
Watch for liquidity absorption signals at 339x – a potential SELL reversal zone.
GOLD SURGES AFTER CPI – TARGETING 337x BEFORE SELL-OFF? MMFLOW TECHNICAL OUTLOOK
📌 Market Overview
Following the CPI release, gold reacted with strong buying momentum (FOMO BUY), pushing prices swiftly from the 333x area up to 335x.
The main driver here is the BUY side taking advantage of remaining liquidity gaps above, aiming to break through the critical 3358 resistance – the first major barrier before reaching 337x, a key equilibrium zone that previously acted as a strong price-holding area for SELL orders.
Current structure indicates:
Short-term trend: Bullish, but approaching key distribution levels.
Liquidity Hunt: A decisive break above 3358 with strong volume could trigger a rapid move towards 337x, activating SELL volume from pending limit orders.
Macro context: No major news events today, with expected daily range ~35–40 points, increasing the chance of range-bound traps before a breakout.
🧐 Technical Outlook – MMFLOW View
Market Structure: Gold has formed a Higher Low around 333x and is now testing short-term resistance.
Key Levels & Liquidity Zones:
Liquidity BUY ZONE at 3338–3336 has reacted well, confirming BUYers are still defending this zone.
Supply Zone / CP Zone at 3375–3377 aligns with an H1 Order Block, holding a high concentration of pending SELL orders.
Volume Flow: Increasing volume as price approaches resistance suggests a potential “last push” before a reversal.
🎯 MMFLOW Trading Plan
🔹 BUY SCALP – Following the main trend
Entry: 3338 – 3336
SL: 3332
TP: 3342 – 3346 – 3350 – 3355 – 3360 – 3370 – 3380
🔹 SELL SCALP – At the distribution zone
Entry: 3375 – 3377
SL: 3382
TP: 3370 – 3365 – 3360 – 3355 – 3350 – 3340
📊 Key Technical Levels
Resistance: 3358 – 3365 – 3376
Support: 3342 – 3337 – 3330 – 3310
💡 MMFLOW Insight: With the current setup, the optimal strategy is to wait for a BUY opportunity near early support (334x) to ride the short-term bullish momentum, then watch for price reaction at 337x to catch potential SELL entries once top-side liquidity is swept.

PROACHING LIQUIDITY ZONE – WAITING FOR CPI TO DECIDE NEXT MOVE📌 MARKET RECAP
Gold kicked off the week with a sharp $50 drop, breaking through key trendlines and nearby support zones.
The selling pressure came from:
Profit-taking after the recent strong rally.
USD strength expectations ahead of CPI data (forecast ~0.1% better than the previous reading).
Geopolitical factor: Ukraine–Russia ceasefire talks moving towards a conclusion, fueling risk-off sentiment.
🧐 WHAT’S NEXT?
If CPI beats expectations → USD strengthens → Gold could drop further into the Liquidity Zone 333x – 330x.
If CPI disappoints → USD weakens → Gold may quickly bounce back toward key level 337x (previous breakdown zone) for a retest before deciding direction.
🎯 MMFLOW GAME PLAN
1️⃣ BUY SCALP
📌 Entry: 3331 – 3329
📌 SL: 3325
📌 TP: 3335 – 3340 – 3345 – 3350 – 3360 – 3370 – 3380
2️⃣ BUY ZONE
📌 Entry: 3310 – 3308
📌 SL: 3304
📌 TP: 3314 – 3318 – 3322 – 3326 – 3330 – 3335 – 3340 – 3350 – 3360 – ???
3️⃣ SELL SCALP
📌 Entry: 3363 – 3365
📌 SL: 3370
📌 TP: 3360 – 3356 – 3352 – 3348 – 3344 – 3340
4️⃣ SELL ZONE
📌 Entry: 3376 – 3378
📌 SL: 3382
📌 TP: 3372 – 3368 – 3364 – 3360 – 3355 – 3350 – 3340
⚠️ RISK NOTE
CPI is the market’s dice roll – even a small deviation could trigger massive stop hunts.
Always watch the KeyLevels marked on the chart before entering trades.
XAUUSD-Gold bearish continuationSince bearish momentum is strong, short positions can be opened.
Entry-$3359
SL-$3363
TP1-$3320
TP2-$3300
4 points SL, 50+ points TP

XAUUSD-Gold Short Position Recovery levelsLooking for a short position as a recovery trade.
Bearish momentum is strong.
Entry-$3371
SL-$3381
TP-$3351
Risky Trade.

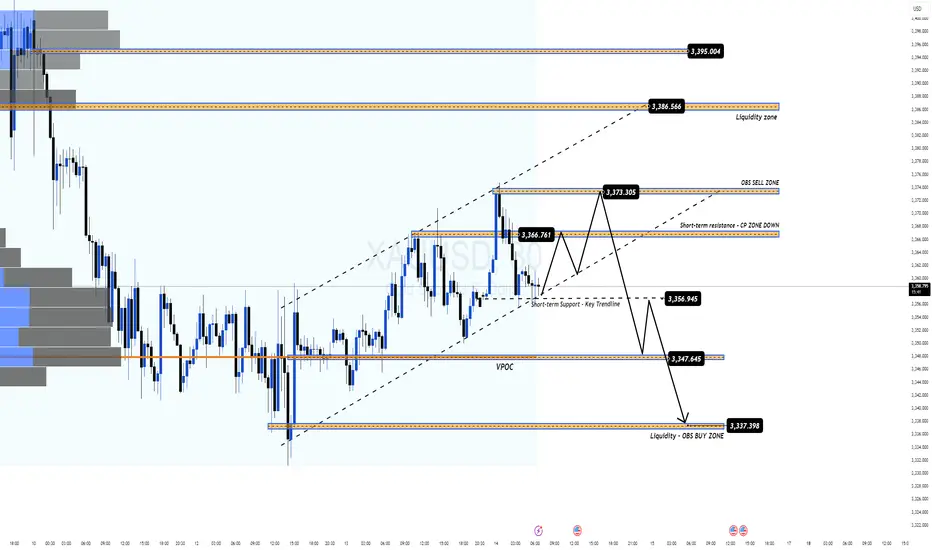
Awaiting the BreakDown or a Snap Back to Resistance?XAUUSD – Game of Patience: Awaiting the BreakDown or a Snap Back to Resistance? | MMFlow Trading
1. Market Context
The week opened with a sharp sell-off in Gold — driven by profit-taking and stop-loss hunting on late-week FOMO BUY positions.
Buying momentum is fading, while sellers are lurking at the ascending channel’s support.
Price is currently reacting at KeyLevel 336x–337x, with H1 candles showing lower wicks → signs of indecision.
2. Technical Outlook
Overall structure: Still within an H1-H4 uptrend channel, but BUY momentum is weakening.
No clear SELL confirmation yet → need a BreakDown from the channel to confirm seller dominance.
Scenario 1: Break the channel → target 335x & 333x zones.
Scenario 2: No break → price may rebound to retest 339x – 340x – 342x resistance levels.
3. Fundamental & Macro View
This week brings major USD economic data: CPI & PPI.
Forecasts lean positive for USD, which could increase downward pressure on Gold.
However, expect false breakouts before/after news releases — risk management is key.
4. MMFlow Trading Plan
BUY SCALP
Entry: 3353 – 3351
SL: 3345
TP: 3358 – 3362 – 3366 – 3370 – 3375 – 3380
BUY ZONE
Entry: 3332 – 3330
SL: 3325
TP: 3336 – 3340 – 3345 – 3350 – 3360 – 3370 – 3380
SELL SCALP
Entry: 3394 – 3396
SL: 3400
TP: 3390 – 3385 – 3380 – 3370 – 3360
SELL ZONE
Entry: 3425 – 3427
SL: 3430
TP: 3420 – 3415 – 3410 – 3405 – 3400 – 3390 – 3380
5. Risk Management
Avoid FOMO — wait for clear candle confirmations before entering.
Reduce position size ahead of CPI/PPI events.
Focus on pre-defined key levels, avoid trading in noise zones.

XAUUSD Weekly Plan Final Bullish Push Before a Liquidity Sweep?XAUUSD Weekly Plan – Final Bullish Push Before a Liquidity Sweep?
1. Market Context
Last week, Gold kept moving inside the H2–H4 bullish channel, pushing into the FVG High Zone and approaching the major resistance at 3426–3428 (OBS Sell Zone).
Momentum is fading – candles are compressing, and volume is dropping – signaling potential distribution.
2. Macro Outlook (High-Impact USD Data Ahead)
CPI – Aug 12 → Primary driver.
PPI – Aug 14 → Usually a leading signal for CPI.
Unemployment Claims – Aug 14 → Short-term impact.
Expectations:
CPI & PPI likely better than previous month → USD strength → Gold correction (liquidity sweep to the downside).
Weaker-than-expected CPI/PPI → USD weakness → Gold could spike for one last bullish leg before reversing.
3. Technical Overview
H2 bullish channel top aligns with FVG High Zone → big players’ sell limit & profit-taking area.
Main scenario: Test 3426–3428 → Bearish reaction → Channel breakdown → Retest 3395–3400 (VPOC) → Drop toward liquidity pools below.
4. Key Levels
SELL Zone: 3426 – 3428
SL: 3434
TP: 3420 → 3415 → 3410 → 3405 → 3400 → 3395 → 3390 → 3380 → 3370 → 3360
BUY Zone: 3330 – 3328
SL: 3322
TP: 3335 → 3340 → 3350 → 3360 → 3370 → 3380
5. Trading Plan
🔹 Primary SELL Setup:
Wait for price to reach 3426–3428 with H1/H2 bearish candle confirmation.
Take profits gradually at each downside target.
🔹 Counter-trend BUY:
Enter only if price sweeps liquidity into 3330–3328 with strong bullish reaction.
6. Trader’s Notes
Gold may still push $30–$40 higher early next week before hitting OBS Sell Zone.
Expect large SELL volume once in this zone (profit-taking + top-picking by big players).
This should be a short-term correction, not a full trend reversal.
Best to SELL from highs and hold after a confirmed channel breakdown.
7. Risk Note
High-impact week → Possible false breaks before/after CPI & PPI.
Avoid oversized positions during news releases.
A break & hold above 3434 with strong volume invalidates SELL scenario → wait for new structure.
📌 Summary:
Bias: SELL from 3426–3428 → Target liquidity pools down to 3360.
Backup Plan: BUY from 3330–3328 if liquidity grab confirmed.
Manage risk tightly, especially during high-volatility events.
— MMFlow Trading

Gold (XAU/USD) in Symmetrical Triangle – Short‑Term Squeeze,Price Structure & Technical Setup
Gold is consolidating within a symmetrical triangle, showing lower highs and higher lows—a classic precursor to breakout in either direction
Fxglory Ltd
+5
TradingView
+5
Babypips.com
+5
TradingView
+2
Babypips.com
+2
TradingView
+2
.
Trendlines converge tightly around $3,326–$3,334, hinting at imminent directional acceleration
Investopedia
+4
TradingView
+4
TradingView
+4
.
🎯 Key Levels & Targets
Scenario Trigger Confirm Area Targets Stop Loss
Bullish Breakout above $3,344–$3,350 $3,369 → $3,396 → $3,422–$3,550 ~$3,340
Bearish Breakdown below ~$3,326–$3,320 $3,320 → $3,300 → $3,297 → $3,255 ~$3,335–$3,340
A breakout above $3,344–$3,350 validated with volume may drive prices toward $3,400+, with extended targets up to $3,550 or higher in bullish conditions
Traders Union
Time Price Research
.
A drop below $3,326–$3,320 risks further decline, targeting $3,300, $3,297, and eventually $3,255 if breakdown momentum builds .
📉 Market Context & Drivers
U.S. dollar strength, easing safe-haven demand, and optimistic trade sentiment are constraining gold’s upside unless breakout forces emerge .
Key upcoming catalysts: FOMC guidance, U.S. macro data (GDP, inflation), and geopolitical developments—their tone could tip the bias direction .
⚙️ Trade Rules & Risk Management
Wait for a confirmed breakout or breakdown—do not trade mid-range.
Confirm break with at least one close outside the triangle and rising volume .
Position sizing: Risk 1–2% per trade, adjust stop-loss to price structure ($8–$15 depending on volatility).
Take profits in stages: scale out at minor milestones (first targets), trail stop for extended targets.
Avoid chasing price within the middle of the triangle—risk/reward is unfavorable.
🧠 Why This Plan?
Follows textbook symmetrical triangle trading methodology: entry on breakout, stop beyond pattern opposite side, projection based on triangle height .
Aligns with broader outlook: bearish unless convincing upside breakout appears, consistent with analyst consensus hedging current bull exhaustion and wait‑and‑see on policy signals .
✅ Summary
Gold is coiling inside a tight triangle range near $3,326–$3,334, with breakout potential identified to either side:
Bullish breakout over $3,344–$3,350 targets up to $3,550 or beyond.
Bearish breakdown under $3,326–$3,320 risks slide towards $3,300–$3,255.
Wait for confirmation, apply disciplined risk controls, and let volume validate the move.

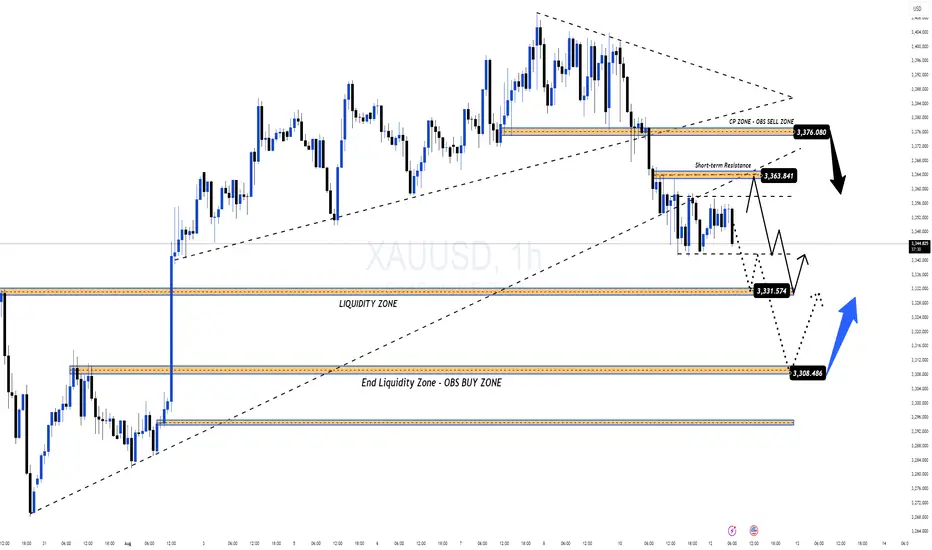
GOLD NFP Plan – Waiting for Breakout & Riding the Bullish Wave – GOLD NFP Plan – Waiting for Breakout & Riding the Bullish Wave
Gold is currently trading inside a large sideways triangle pattern, with price compressing toward the apex. However, based on recent candle structure and yesterday’s reaction at the key level, there’s strong momentum building for bullish continuation—likely forming a Wave 3 breakout if price can decisively break above the current descending trendline.
🔎 Technical Breakdown:
✅ BUY ZONE: 3276 – 3274 (confluence of CP ZONE + GAP + OBS BUY from yesterday)
📈 Price already reacted with +160 PIPS profit from this zone, confirming buyer control
⛓️ Descending trendline is compressing price – a breakout above it could unleash strong bullish momentum
🔄 SELL ZONE: 3339 – 3341 marked by OBS SELL ZONE + liquidity layer
📰 Fundamental Focus:
Today is Nonfarm Payrolls (NFP) day. With current forecasts pointing toward weaker-than-expected U.S. job data, the dollar could face pressure—creating the perfect scenario for gold to spike higher on BUY-side FOMO.
📌 Trade Plan:
🎯 BUY ZONE: 3276 – 3274
❌ Stop Loss: 3270
🎯 Take Profits:
3280 – 3284 – 3290 – 3294 – 3300 – 3305 – 3310 – 3320 – 3330 – 3340 – 3350
⚠️ SELL ZONE (counter-trend): 3339 – 3341
❌ Stop Loss: 3345
🎯 Take Profits:
3335 – 3330 – 3325 – 3320 – 3315 – 3310 – 3305 – 3300
📌 Key Notes:
Favor BUY setups in line with the trend—focus on reaction zones outlined on the chart.
If NFP data is bearish for the dollar, wait for strong confluences before entering any SELL, and avoid shorting prematurely against bullish momentum.
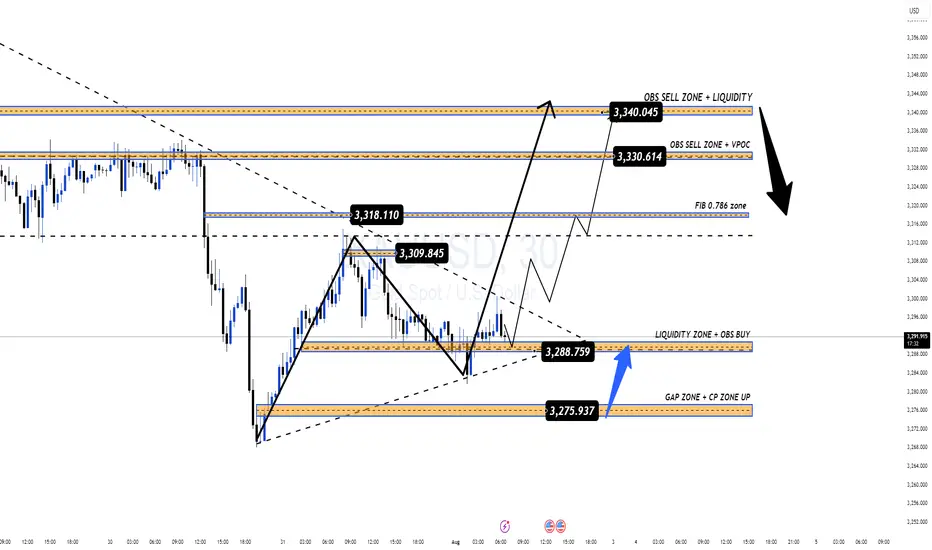
Liquidity Sweep Complete – Bullish Continuation Ahead?GOLD ANALYSIS 31/07: Liquidity Sweep Complete – Bullish Continuation Ahead?
🔍 Technical View | XAUUSD | 2H Chart | End of Month Setup
Gold has completed a final liquidity sweep around the 3269–3271 zone and has since rebounded strongly, in line with the prevailing bullish structure. The sharp drop yesterday during the FOMC rate statement appears to have served its purpose: grabbing final sell-side liquidity before preparing for the next bullish leg.
As of now, price is reacting at the 3295 zone, which coincides with the M30 CP (Change of Character) Zone, showing minor intraday retracement. A healthy pullback is likely before a potential bullish breakout of the descending trendline that has been holding price down over recent sessions.
🔵 BUY Strategy: Trend Continuation Setup
We’re watching for potential re-entries on a dip toward the OBS Buy Zone (3286–3284), created after the recent bullish move. This could be the last opportunity to catch the next impulsive leg higher.
Buy Zone: 3286–3284
Stop Loss: 3278
Targets: 3290 → 3294 → 3298 → 3304 → 3308 → 3312 → 3316 → 3320 → 3330 → ???
Key breakout confirmation will come if price closes strongly above 3313 (first key resistance). If broken, this opens the door toward the VPOC zone at 3328–3330, where a high-volume cluster awaits.
🔴 SELL Strategy: Short-Term Rejection Levels
Shorts only become favorable below the VPOC Sell Zone (3328–3330). If price closes above this area, bearish pressure is likely to fade, and bulls will dominate the next leg.
Sell Zone: 3328–3330
Stop Loss: 3335
Targets: 3324 → 3320 → 3315 → 3310 → 3305 → 3300
⚠️ Important: Selling inside a bullish breakout structure is high-risk unless the market gives clear rejection at major supply. Always wait for price action confirmation.
🕯️ Monthly Candle Insight (July Close)
Today marks the final trading day of July. Notably, the last two monthly candles have closed as Doji with long wicks, reflecting deep indecision and ongoing liquidity grabs. This aligns with the upcoming interest rate cut discussions at the next FOMC, which could ignite significant volatility.
📌 Summary:
Liquidity sweep at 3269–3271 is likely complete.
Price now retracing after strong bullish rebound from OBS Buy Zone.
Watch for confirmation above 3313, then 3328–3330 for breakout toward higher zones (335x–337x).
End-of-month close + macro narrative (FOMC) will be crucial to confirm direction.
💡 Pro Tip: Avoid entering late into reactive moves. Wait for retests of clean liquidity zones and use volume-based confluences to validate bias.
📲 Follow us @MMFlowTrading for real-time updates, macro analysis, and market structure insights on gold & major pairs.

XAUUSD
ALWAYS TAKE TRADE WITH CONFIRMATION
Note : Trading in any financial market is very risky. I post ideas for educational purpose only. It is not financial advice. Do not hold us responsible for any potential loss you may incur. Please consult your financial adviser before trading.
