Three White Soldiers Pattern Gold Buy Projection 27.01.26🔍 Technical Breakdown
Market Structure:
Overall structure remains bullish. Price already broke the neckline and a successful retest is completed, confirming continuation bias.
Retracement Zone:
Price has completed a 50% Fibonacci retracement, which is a high-probability buy zone in an uptrend.
Candlestick Confirmation:
Formation of Three White Soldiers indicates strong bullish momentum returning after the pullback.
📍 Key Levels
Entry for Buy:
Near 5065 – 5070 (Support + Retest zone)
Support Levels:
Support: ~5070
Support S1: ~5050
Targets / Resistance:
R1 / Target Zone: 5095 – 5105
Further upside possible if R1 breaks with volume
🎯 Trade Idea (Projection)
Bias: BUY on dips
Logic:
✔ Break & retest confirmed
✔ 50% retracement respected
✔ Bullish candle pattern
✔ Strong rejection from support
⚠️ Risk Note
If price sustains below 5050, bullish projection may fail and consolidation / deeper correction is possible.
Xauusdsignals

XAUUSD (Gold) | Bullish vs Bearish SetupS | 23rd Jan'2026XAU/USD – Key Levels (23 Jan 2026)
Resistance:
* R1: 4975–4985 → Near-term supply
* R2: 5000–5015 → Psychological breakout zone
Support:
* Pivot / Demand Zone: 4940–4955 → Intraday balance
* Primary Support: 4920–4940 → Trend bullish above
* Secondary Support: 4880–4900 → Strong swing support
* Trend Invalidation: 4850 → Break weakens bullish trend
Bullish Swing Setup
* Buy on Dip: 4920–4940 | SL: 4900 | Targets: 4975 → 5000 → 5015
* Breakout Buy: Above 4985 | SL: 4955 | Targets: 5000 → 5030 → 5050
Bearish Swing Setup (Corrective)
* Pullback Sell: Below 4920 | SL: 4940 | Targets: 4880 → 4850 → 4820
* Trend Shift Sell: Break below 4850 | SL: 4880 | Targets: 4800 → 4760

XAUUSD/GOLD 1H SELL LIMIT PROJECTION 19.01.26✅ XAUUSD / GOLD (1H) – SELL LIMIT PROJECTION (19.01.26)
Gold is currently respecting the 1H downtrend line, and price is moving in a bearish structure. Even though we saw a bullish engulfing reaction from demand, this move is likely a pullback before bearish continuation.
📌 Key Levels
🔴 Supply / Resistance Zone: 4615.608
This level is acting as a premium zone + resistance area.
⚫ Key Mid Support/Resistance: 4585.679
Important reaction level. Price must reclaim & hold above this for further upside push.
🔵 Demand / Support Zone: 4576 – 4578
Strong demand region where buyers previously entered and formed engulfing.
📍 Current Market Price: 4596.320
📉 Trade Idea (Sell Limit Setup)
✅ Sell Limit Entry: 4610 – 4615 (inside supply + trendline confluence)
🛑 Stoploss: 4628 – 4630 (above supply highs)
🎯 Targets:
TP1: 4585.679
TP2: 4576 – 4578 (Demand zone)
📊 Risk-Reward: 1:2
🧠 Setup Logic
✔ 1H trendline still bearish
✔ Entry at premium / supply zone (4615.608)
✔ Target into support/demand zone (4576 – 4578)
✔ High probability continuation after pullback
⚠️ Confirmation: Watch for bearish rejection / wick near 4615 zone

Gold (XAUUSD) 1D Chart Analysis – Buy/Sell Levels with TargetsGold is showing strong momentum after breaking important levels. Here’s a simple analysis with clear buy and sell points, target, and stop-loss guidance for traders. Perfect for intraday and positional trading.

2026 XAUUSD/GOLD YEARLY ANALYSISXAUUSD / GOLD – 2026 Yearly Buy Plan
With Entry, Stop Loss & Targets
🔹 Market Bias
Gold (XAUUSD) is bullish for 2026 based on:
Global economic uncertainty
Central bank gold accumulation
Expected US interest-rate cuts
Strong long-term bullish structure on the daily chart
🔹 Buy Zones (Entries)
✅ Major Buy Zone (Best Risk–Reward)
Entry: 3,250 – 3,300
This zone is near:
Golden Fibonacci retracement
Yearly swing low
Strong institutional demand area
👉 Suitable for positional & long-term investors
✅ First Confirmation Buy
Entry: 3,950 – 4,050
Buy only if price holds above support and shows bullish candles
👉 Suitable for safe swing traders
🔴 Stop Loss (Risk Control)
🛑 Stop Loss Placement
Stop Loss: Below 3,150
Reason:
Break of yearly structure
Bullish view invalid below this level
📌 Risk should be 1–2% per trade, not more.
🎯 Take Profit Targets (2026)
🎯 Target 1
4,800 – 5,000
Partial profit booking recommended (30–40%)
🎯 Target 2
5,800 – 6,000
Trail stop loss to cost or profit
🎯 Target 3 (Long-Term Extreme Target)
7,500 – 7,800
Only for patient positional holders
🔹 Trade Management Plan
Buy only on pullbacks, not at highs
Book partial profits at each target
Move stop loss gradually as price moves up
Avoid over-leverage

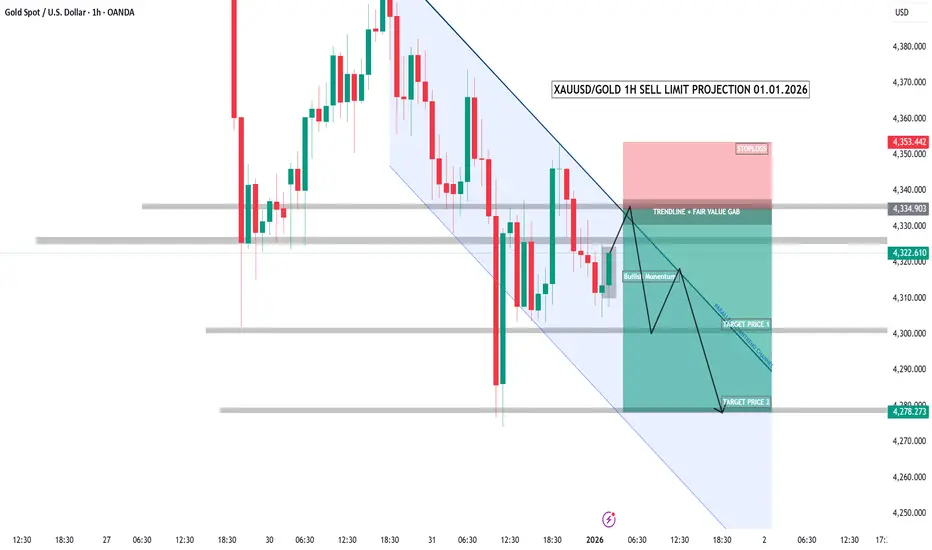
XAUUSD/GOLD 1H SELL LIMIT PROJECTION 01.01.26This is XAUUSD – Gold – on the 1-hour timeframe.
The market is clearly in a downtrend,
forming lower highs and lower lows.
Price is currently in a pullback phase within the trend.
This pullback is moving into a strong confluence zone —
the descending trendline combined with a fair value gap.
This area acts as a high-probability sell zone.
Sell limit area:
4330 to 4340.
Here, we expect a short-term bullish move to trap buyers,
followed by a strong rejection and continuation to the downside.
Stop loss:
4353 — a clear invalidation of the setup.
Target one:
4300 — a short-term support level.
Target two:
4278 — a strong demand zone and trend continuation target.
This is a pullback sell strategy.
Trade with the trend, not against it.
No emotions.
No overtrading.
Only structure, discipline, and patience.
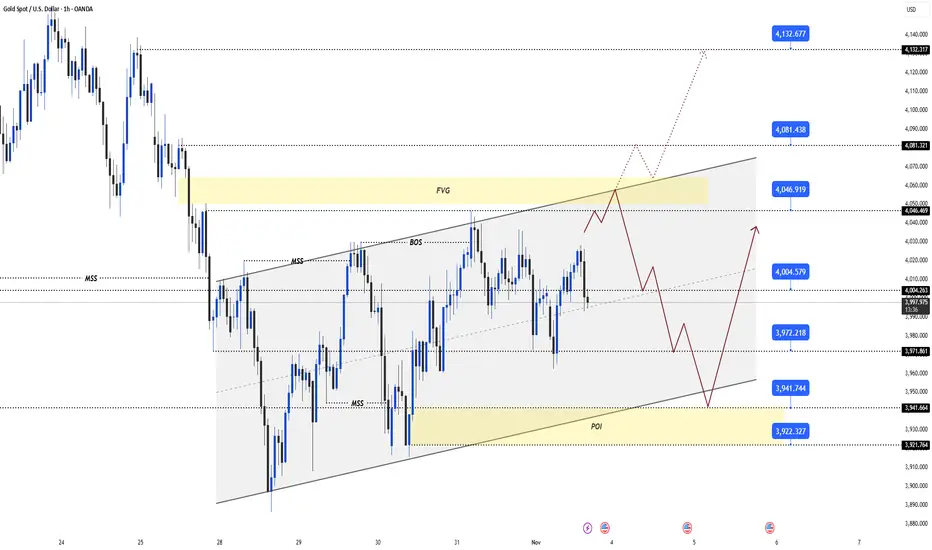
XAUUSD/GOLD 1H BUY PROJECTION 02.12.25Market Structure
Price has broken the uptrend line, causing a corrective move inside a descending channel.
The correction is respecting channel boundaries (multiple rejections on top & bottom).
🔹 Key Zones
Support Zone: 4180 area
→ Confluence of FVG (Fair Value Gap) + Demand Zone + Channel Bottom.
Target Zone: 4218–4220
→ Retest of the broken structure zone.
🔹 Buy Setup Logic
Price dipped into OBEY CHANNEL + FVG + SUPPORT zone (blue/purple box).
Expectation: Price should bounce from support and move higher.
First target aligns with:
Channel Top
Breaked zone retest
Previous minor structure level.
🔹 Projection Outcome
A bullish push towards 4218.89 zone is projected if support holds.
SL should be placed below the 4168–4170 zone under channel + FVG.

Resistance Rejection → Bearish Pullback Toward Support🟡 GOLD (XAU/USD) – Bearish Rejection from Major Resistance 🟥📉
🔍 Key Technical Insights
Price rejected the major resistance zone around 4,245 – 4,255
Rising Support Line has been broken → signals weakening bullish momentum ❌
Current structure favors a pullback toward demand area
Market seeking liquidity below recent swing lows 💰
🎯 Suggested Targets (with stickers)
Target Type Price Area Sticker
TP1 → Support Retest 4,210 – 4,215 🎯
TP2 → Demand Zone 4,195 – 4,205 📉💰
📌 TP1 is your high-probability target
📌 TP2 is for extended move if bearish momentum continues ⬇️
📌 Trade Setup Idea
📍 Sell Entry Zone:
➤ 4,238 – 4,245 (after failed breakout)
🎯 Take Profit:
➤ TP1: 4,215 🎯
➤ TP2: 4,200 📉💸
🧭 Overall Market Outlook
Factor Bias
Short-term Trend Bearish Pullback 🔻
Liquidity Downside targets in focus 💧
Resistance Reaction Strong rejection 🚫

Gold (XAU/USD) 2H Chart Analysis – Sell Setup from High ProbabilBased on the chart you provided, Gold is currently reacting near a High Probability POI (supply zone) after a corrective bullish move. The structure still shows:
Lower highs and lower lows → Bearish market structure
Price is approaching a supply zone where sellers previously dominated
Liquidity has been taken above internal highs (marked as "$$$"), indicating a liquidity grab
This supports a short position idea from the supply zone.
🔍 Key Technical Levels
Zone / Level Meaning
4,125 – 4,150 USD High Probability POI / Supply (Sell area)
4,080 – 4,100 USD Entry region (price is currently here)
4,040 – 4,025 USD First reaction / partial take zone (50% area)
3,990 – 4,000 USD Main Target (previous demand + equal lows)
🎯 Suggested Target
Primary Target: $4,000
(Exactly aligning with your chart’s marked “TARGET” zone where liquidity sits)
If momentum continues and structure breaks more aggressively:
Extended Target: $3,975 – $3,960
(deeper sweep into demand)
🛑 Risk Management
Detail Level
Stop Loss Above 4,155 USD (beyond POI + liquidity)
R:R Potential Approx. 1:3 to 1:4
📌 Summary
Price has retraced into a key supply zone
Liquidity was taken → seller confirmation likely
Expectation is continuation downward towards the liquidity pool below
📊 Title Recommendation:
“Gold Retests Supply Zone – Bearish Continuation Toward $4,000 Expected”

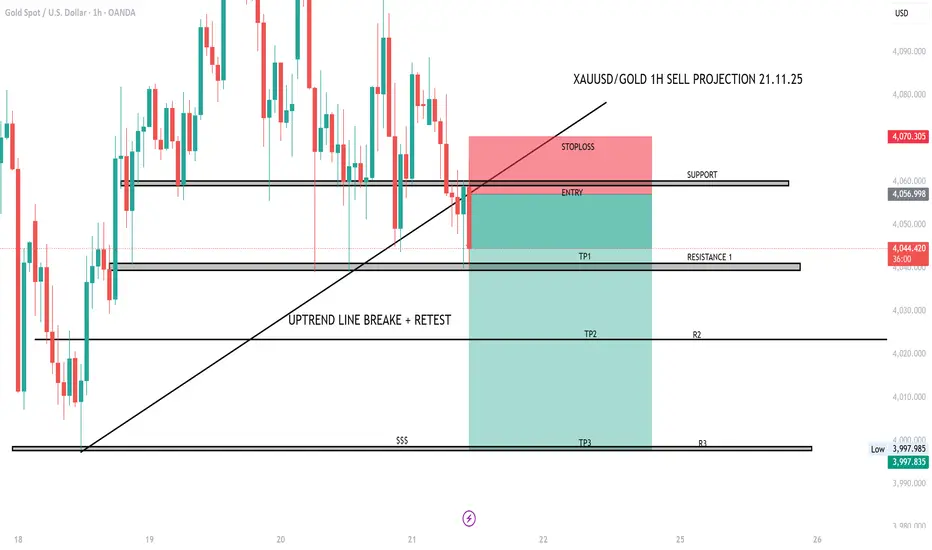
XAUUSD/GOLD 1H SELL PROJECTION 21.11.25XAUUSD / GOLD 1H SELL projection based on the chart you uploaded:
✅ Overall View
The chart shows a confirmed uptrend line break + clean retest, which is a strong bearish signal on 1H timeframe. Your setup is technically correct and follows proper structure.
📉 SELL SETUP ANALYSIS
1. Entry Zone
Your entry is placed exactly at the support → turned resistance zone after the trendline break + retest.
This is a smart location because:
Price rejected the retest
Previous support is now acting as resistance
Weak bullish candles on retest confirm sellers are active
🛑 Stop Loss
Stop loss is placed above the retest wick, which is correct.
Because:
If price moves above this, structure becomes bullish again
SL protects you from fake breakout
🎯 Targets
TP1 – Resistance 1 (Now Support Zone)
Good first target. High probability area where price may react.
TP2 – R2
This level has strong confluence:
Previous consolidation zone
Fresh liquidity area
High chance price may reach here if bearish momentum continues.
TP3 – R3 (Final Target)
This is your deep liquidity zone ($$$).
Smart money usually reaches this zone after trend reversal.
⭐ Trade Quality Rating: 9/10
Reasons:
Trendline break + retest = strong confirmation
Clean structure
Proper RR setup
Logical TP placements
SL placed safely
📌 Suggested Trade Plan
Enter only if candle closes below your entry zone again
Book partial profits at TP1
At TP1: move SL to breakeven
Let runner hit TP2 / TP3
XAUUSD/GOLD 1H SELL PROJECTION 11.11.25XAUUSD/GOLD 1H Sell Projection (11.11.25) chart.
Here’s a quick technical breakdown of what this chart represents:
🟣 Setup Overview
Pair: XAUUSD (Gold)
Timeframe: 1 Hour (H1)
Bias: Bearish (Sell Setup)
🧩 Key Levels
Resistance / High: 4148.82
Stoploss: ~4141.63
Entry Zone: ~4129.45–4128.32
Target 1 (TP1): Around 4110 (S1 + FVG zone)
Target 2 (TP2): Around 4081 (S2 zone)
📉 Projection Logic
Price rejected from major resistance at 4148.
A short-term pullback / retracement is expected into the entry zone.
After possible retest, price is expected to drop towards TP1 and TP2.
The setup suggests a Risk-Reward Ratio (RRR) of roughly 1:2.5 to 1:3, favoring the sell side.
⚙️ Trading Idea Summary
Parameter Value
Bias Sell
Entry Range 4128–4130
Stop Loss 4141
Take Profit 1 (TP1) 4110
Take Profit 2 (TP2) 4081
R:R Ratio ≈ 1:3
Confirmation Bearish engulfing or rejection from resistance zone

XAUUSD – Intraday H1 Plan Range-Bound Volatility(November 5, 2025)
🌐 MARKET CONTEXT
Gold is trading within a narrow range around ₹3,963 – ₹4,015, showing indecision between safe-haven demand and short-term profit-taking pressure.
After the previous New York session, price created a new local low near ₹3,962.92, then quickly rebounded as dip buyers stepped in.
However, the ₹4,015–₹4,020 zone remains a strong supply area, limiting further upside momentum.
Bias for today: Ranging with mild bullish potential
→ Prefer buying at lower supports and taking profits quickly near the ₹4,015–₹4,020 supply zone.
If price breaks below ₹3,962, deeper downside movement toward ₹3,945 may occur.
📉 TECHNICAL ANALYSIS (SMC + LIQUIDITY STRUCTURE)
Market Structure: On the H1 timeframe, XAUUSD is consolidating between the strong demand zone ₹3,962–₹3,965 and the supply zone ₹4,015–₹4,020, forming a clear sideways range.
Liquidity Map:
Below ₹3,962 lies heavy sell-side liquidity, which Smart Money may sweep before a reversal.
Above ₹4,015–₹4,020 sits buy-side liquidity, serving as the next liquidity target if a breakout occurs.
🔑 KEY PRICE ZONES
Zone Type Price Range Description
Supply Zone ₹4,015 – ₹4,020 Short-term supply zone, likely to trigger sell reactions
Order Block ₹4,010 – ₹4,008 Quick reaction zone during London session
FVG zone ₹3,956-₹3,960 as a retest reaction area to look for confirmed Buy setups if the higher-timeframe trend remains bullish, or Sell on retest if price breaks below this zone
Deep Demand - OB ₹3,935 – ₹3,940 Deep buy zone, for liquidity sweep setups
⚙️ TRADE SETUPS
✅ BUY SCENARIO 2 – OB Reaction Entry
Entry: ₹3,935 – ₹3,934
Stoploss: ₹3,928
TP1: ₹3,970
TP2: ₹4,000
Logic: Price may sweep liquidity below the FVG and mitigate the H1 Bullish Order Block (₹3,935–₹3,944); if CHoCH/BOS confirms reversal, enter buy targeting the previous imbalance and liquidity above ₹4,000.
✅ BUY SCENARIO 2 – FVG Rebalance Entry
Entry: ₹3,955 – ₹3,954
Stoploss: ₹3,948
TP1: ₹3,985
TP2: ₹4,015
Logic: Price retraces to fill the ₹3,955–₹3,954 H1 FVG within the discount zone; if bullish CHoCH/BOS confirms a reversal, execute buy entry targeting liquidity above recent highs.
🔻 SELL SCENARIO – From Short-Term Supply Zone
Entry: ₹4,011 – ₹4,009
Stoploss: ₹4,017
TP1: ₹3,990.000
TP2: ₹3,965.000
Logic: Price reaches supply zone, forms rejection or bearish engulfing → valid short setup within range.
⚠️ SCALPING SELL – Quick Reversal Opportunity
Entry: ₹4,020 – ₹4,022
Stoploss: ₹4,028
TP: ₹4,000.000 – ₹3,985
Logic: If price spikes to ₹4,020–₹4,022 sweeping buy-side liquidity and quickly rejects → short scalp opportunity.
🧠 NOTES / SESSION PLAN
Focus on London and New York sessions when liquidity is highest.
Wait for H1 candle confirmation (wick, retest, or CHoCH) before entering any trade.
Avoid trading just because price touches the zone — confirmation is key.
Risk management: limit exposure to ≤1% per trade; maintain at least a 1:2 RR ratio.
When price approaches entry zones, use M15 timeframe to confirm structure and momentum before executing.
🏁 CONCLUSION
Within the ₹3,962.92 – ₹4,015.04 range, XAUUSD is consolidating tightly.
→ Prefer buying near ₹3,965–₹3,963 upon confirmation, or deep buys at ₹3,958–₹3,956 after liquidity sweep.
→ Conversely, if price rallies to ₹4,015–₹4,020 and shows rejection signals, short opportunities may arise.
Trade according to structure, wait for confirmations, and manage risk strictly to avoid stop-hunts.

GOLD (XAU/USD): ISM DHAMAKA Awaited! Ready for the Big Move, BosI. MACRO KA SCENE (Current Situation):
Mind you, Gold is in a TIGHT SPOT, caught between two heavy-duty forces:
⬆️ BULL CASE (Buy Power): Safe-Haven demand is on because of US Political TENSION (shutdown issues) and global uncertainty (like that Nvidia chip drama). Good for paisa up.
⬇️ BEAR CASE (Sell Power): USD is showing STRENGTH! Hawkish Fed guys are pushing rate cut hopes away, which is putting pressure on our Gold.
🔥 MAIN GAME-CHANGER: The US ISM Manufacturing PMI tonight. This data is the main trigger for the next BIG move. Wait and watch, folks!
II. APNA TRADING PLAN (Actionable Zones):
We are sticking to two high-probability zones. Remember: Only trade after proper Price Action Confirmation! No JUMPING.
🔴 SELL SCENARIO
SELL ZONE (Supply/FVG): $4,050 - $4,055
Reason: We're hunting a SOLID rejection where the Smart Money (Bade Khiladi) is waiting to sell off.
SL (Stop Loss): $4,065
TP Targets (Book Profit): $4,045 - $4,035 - $4,025 - $4,015
🟢 BUY SCENARIO
BUY ZONE (POI/Demand): $3,952 - $3,948
Reason: Looking for the market to find STRONG support here and give a sharp bounce.
SL (Stop Loss): $3,940
TP Targets (Book Profit): $3,958 - $3,968 - $3,978 - $3,988
🚨 FINAL WORD (Very Important, Yaar!):
Risk Management is the ultimate key. Boss, wait for a CLEAR Price Action Confirmation in these zones. NO gambling on the news release.
#XAUUSD #Gold #ISM #PriceAction #TradingIndia #ForexIndia #IndianTrader #SmartMoneyConcept #USD #SafeHaven #Paisa
XAUUSD/GOLD 4H WEEKLY BUY PROJECTION 02.11.25XAUUSD (Gold) 4H Weekly Buy Projection for 02.11.25.
Here’s a breakdown of what your chart indicates:
🧭 Technical Overview:
Pattern Forming: Symmetrical Triangle inside a larger Parallel Downtrend Channel.
Key Confirmation: “W” pattern confirmation with 0.618 Fibonacci retracement zone, indicating strong potential reversal.
Current Price Zone: Around 4002, consolidating near triangle resistance.
🔍 Key Levels:
Support S1: ~3960
Support S2: ~3920
Resistance R1: ~4040
Resistance R2: ~4080
Resistance R3: ~4160
📈 Projection Summary:
If Price Breaks Triangle Upward:
→ Strong bullish momentum expected toward R1–R3 zones.
→ “Huge buy expected” once breakout candle closes above the upper trendline with volume.
Invalidation:
→ If price breaks below 3960, the bullish setup weakens.
→ Below 3920, trend may retest the lower parallel channel zone.
💡 Trading Plan (Based on Chart Logic):
Buy Entry: Above 4040 confirmation breakout
Target 1: 4080
Target 2: 4160

XAUUSD/GOLD 1H SELL LIMIT PROJECTION 28.10.251H Sell Limit Projection Chart for XAU/USD (Gold):
📝 Chart Summary (28.10.25)
Timeframe: 1 Hour
Setup Type: Sell Limit Projection
Market Structure: Bearish
📈 Key Levels:
Sell Limit Zone (Entry Area): Around $3,958 (Resistance R1)
Stop Loss: Around $3,982 (Top of FVG + Trendline)
Target 1 (TP1): Support S1 – around $3,920
Target 2 (TP2): Support S2 – around $3,883
📉 Technical Confluences:
🔹 1H Downtrend Line acting as dynamic resistance
🔹 FVG (Fair Value Gap) aligning with entry zone
🔹 Fibonacci retracement zone overlap
🔹 Resistance R1 matches previous supply zone
🧭 Trading Plan Idea:
Wait for price to retrace back to $3,958 zone.
Place Sell Limit order in the zone.
Stop loss: Above $3,982 zone to protect from fakeouts.
Take Profit: First target at $3,920 (partial booking), second target at $3,883 (runner).
⚠️ Risk Notes:
Watch for liquidity grabs above R1 before rejection.
Avoid market entry — wait for price confirmation near the zone.
Adjust SL if price structure shifts on lower timeframes.

XAUUSD/GOLD WEEKLY SELL PROJECTION 26.10.25Here’s a clear explanation of the 4H SELL SETUP shown in your chart 📊👇
📌 Chart Breakdown (XAU/USD — Gold 4H)
Pattern: Rising wedge / structure breakdown
Trendline: “4H Uptrend Line – Broken” ✅
Candle signal: Bearish Engulfing at ATH (strong reversal confirmation)
🧭 Key Levels
🟥 Stop Loss: Around 4,225.640 (above structure high)
🟡 Entry Zone: ~4,192 (below trendline break)
🟢 Targets:
TP1: 4,125
TP2: 4,075
TP3: 4,031
🧠 Trading Logic
Market formed a Bearish Engulfing at the top.
The main trendline was broken, indicating possible trend reversal.
After a retest of the broken structure, price is expected to continue downward.
Multiple TPs (TP1, TP2, TP3) help scale out profits gradually.
SL is placed above the previous high to protect against a fake breakout.

XAUUSD/GOLD WEEKLY OVERVIEW PROJECTION 25.10.25“XAUUSD/GOLD WEEKLY OVERVIEW 25.10.25”:
🟡 Pair: XAUUSD (Gold vs USD)
📅 Timeframe: Weekly
📊 Chart Type: Price action with liquidity zone and retest entry plan
📌 Key Levels:
Resistance / Upper Target Zone: ~4,360 – 4,400
Entry Zone / Supply-Demand Range: ~4,057 – 4,145
Support / Lower Target Zone: ~3,868
🧭 Market Structure Analysis:
The price is currently consolidating inside a mid-range zone (4,057–4,145) after a strong previous down move.
Liquidity zones are marked both above and below, suggesting potential breakout and retest setups.
The market is showing accumulation or indecision before a big move.
🛒 Buy Scenario (Bullish Plan):
Price may retest the lower boundary of the entry zone (~4,057–4,145).
If a bullish retest/confirmation candle forms → Long Entry.
Target: ~4,360 area (major resistance).
Stop-loss likely placed slightly below 4,057.
🟢 This aligns with a potential reversal or continuation of higher timeframe bullish structure.
🐻 Sell Scenario (Bearish Plan):
Price may break below the entry zone, retest it from the bottom, and reject.
If a bearish retest/confirmation candle forms → Short Entry.
Target: ~3,868 support level.
Stop-loss likely placed slightly above 4,145.
🔴 This aligns with a continuation of the recent bearish momentum.
⚠️ Additional Notes:
Watch for fake breakouts near the entry zone.
Weekly candles can give strong direction but might take 1–2 weeks to fully play out.
High impact news related to gold or USD can accelerate the move.
✅ Summary Plan:
Buy entry: After bullish retest of 4,057–4,145 → TP 4,360
Sell entry: After bearish retest of 4,057–4,145 → TP 3,868
SL: Just outside the opposite edge of the entry zone.

XAUUSD 1H Buy Limit Projection — 15.10.25🟡 Overall Setup
This is a 1-hour timeframe projection chart for XAUUSD (Gold vs USD). The market is currently in a strong uptrend, moving inside an ascending channel (blue trendline).
The price at the time of projection: $4,198.76
🧭 Key Zones & Plan
Entry Zone (Buy Limit):
Marked at $2203–$2206 (FVG zone — Fair Value Gap).
The chart suggests to wait for breakout and retest of the yellow zone before buying.
Support Zone:
Highlighted in yellow box, indicating strong demand area where the breakout is expected to happen.
“CANDLE MOVEMENT AREA” below shows the probable pullback path.
Trade Timing:
Suggested after 11:30 AM (October 15).
Waiting for structure confirmation before entry.
🏁 Target Levels
TP 1: Around $4,228 – $4,243 (0.5–0.618 Fibonacci zone).
TP 2: Around $4,320, which is the top of the ascending structure.
⚠️ Stop Loss Zone
SL is placed below $4,165, under the yellow demand zone.
Protects against false breakout.
📈 Price Movement Projection
The black line arrows project the expected retracement down to entry zone, then bullish breakout and rally upward toward target zones.
Trend continuation is expected until tomorrow with breakout & retest.
✅ Summary of Strategy:
Trend: Bullish
Action: Buy at retest zone (2203–2206)
TP: 4243 (TP1) / 4320 (TP2)
SL: Below 4165
Timing: After 11:30 AM IST

$4024 Gold: 8-Week Jhakaas Record! BUY Pivot $398x!Hello, traders!
Gold just wrapped up an impressive 8-week winning streak, closing the session at $4,024.40/oz (Futures). This bada (big) rally was immediately triggered by President Trump's unexpected tariff threat on China, which, boss, fueled a massive rush toward safe-haven assets.
Fundamentals & Technical Bias: Buying the Pivot
Core Drivers: Escalating trade panga (conflict) thanks to Trump, steady Fed rate cut expectations, and ongoing global gadbadi (instability) are all making Gold the top safe haven.
Technical Recovery: After a deep correction to $394x, Gold recovered super fast and closed firmly above $399x. This confirms that buying power is dominant and the bullish momentum is pakka (confirmed).
Priority Bias: BUY (Long). $398x is the critical short-term pivot point. Risk management is key, remember that.
Risk Warning: Only switch to SELL (Short) if the price rapidly breaks below $398x due to major negative news.
Key Price Levels:
Resistance: $4064, $4084, $4104, $4124
Support: $3984, $3951, $3934
Trading Strategy (Prioritize BUY at the Pivot)
BUY ZONE (Pivot $398x): $3984 - $3982
SL: $3974
TPs: $3992, $4002, $4012, $4022, $4032
SELL ZONE (Counter-Trend): $4024 - $4026
SL: $4034
TPs: $4016, $4006, $3996, $3986, $3976
Will this trade war tension take Gold past $4100 next week? Kya lagta hai? 👇
#Gold #XAUUSD #4KGold #TrumpTariffs #8WeeksUp #Pivot #TradingView #PaisaBanega

"Gold 'Buy the Dip' Opportunity Targeting the $4,000 Level"Technical Analysis
This is a classic bullish continuation setup. Here's a breakdown of the key elements:
Prevailing Trend: The chart shows a strong bullish impulse wave, indicated by the series of large green candles. This establishes the short-term trend as upward.
Corrective Pullback: After reaching a local high (around $3,980), the price is currently in a corrective phase, pulling back towards a potential support level. This is normal and healthy price action in an uptrend.
Support Zone: The red rectangle you've highlighted from approximately $3,950.00 to $3,956.00 is a well-defined area of potential support. This zone represents a previous level of consolidation and the base of the last major push upwards, making it a likely area for buyers to step back in.
Trade Idea: The projected path you have drawn suggests an expectation that the price will dip into this support zone, find buying pressure, and then continue its upward trajectory. This is often referred to as a "buy the dip" strategy.

XAUUSD/Gold Weekly Buy Projection (05.10.25) chartXAUUSD/Gold Weekly Buy Projection (05.10.25) chart.
Here’s a clear technical summary of what your chart shows:
🔹 Overall Structure
The chart projects a bullish move for XAUUSD (Gold).
Title: Weekly Buy Projection – 05 Oct 2025
Main trend: Ascending continuation pattern (marked by blue upward trendlines).
Current price zone: around $3,886.45.
🔹 Key Levels
Support S2: around $3,838 – $3,846
Support S1: around $3,870 – $3,878
Resistance 1: around $3,900 – $3,910
Resistance 2 (New ATH): around $3,939 – $3,970
🔹 Pattern & Projections
Golden Ratio (0.618 Fibonacci) formed near $3,874, signaling a retracement support.
Bullish engulfing candle noted at Support S1, confirming buying interest.
Possible Double Top highlighted near Resistance 1, indicating a short-term pullback risk before continuation.
Fair Value Gap (FVG) exists between $3,875–$3,890, suggesting potential liquidity refill before next le

XAUUSD/GOLD WEEKLY BUY PROJECTION 28.09.25XAUUSD/Gold Weekly Buy Projection (27.09.25). Here’s a breakdown of what it shows:
Current Price Level: Around 3,759.85.
Technical Zones Marked:
Broke the Uptrend Line (earlier support turned resistance).
Bearish Engulfing Failed (bullish strength seen).
Fair Value Gap (FVG) near 3,740–3,750 zone, acting as a demand zone.
Projection Path:
Price expected to bounce from the FVG/demand area.
Then follow an upward zigzag movement toward the target zone around 3,860.
Trend Channel:
Multiple parallel blue channels drawn indicate a bullish structure.
Projection suggests continuation of the uptrend.
Target Price:
Marked close to 3,860, aligning with the upper channel line.
🔑 Summary of Projection:
Bias: Bullish
Entry Zone: 3,740–3,760 (Fair Value Gap zone)
Target Zone: 3,860
Risk Area: If price breaks below 3,720, projection may fail.
👉 Do you want me to prepare a trading plan (entry, SL, TP, and risk %) based on this projection for you?

XAUUSD/GOLD 30 MIN BUY PROJECTION 23.09.25XAUUSD/Gold 30-min buy projection chart you shared for 23.09.25. Here’s the breakdown of what the chart indicates:
🔎 Chart Analysis
Trend: Price is moving within a bullish (upward) channel, shown by the blue trend lines.
Entry Zone: Around 3749.687 (marked as ENTRY, just above Support 1).
Stop Loss (SL): Around 3743.131, below the 30-min FVG (Fair Value Gap).
Supports:
Support 1: ~3749 zone
Support 2: ~3755–3757 zone
Take Profits:
TP1: Around 3765–3767 level (mid-channel target).
TP2 (ATH – All-Time High for this projection): Around 3783–3785.
Projection Path:
Price expected to bounce near entry zone → rise towards TP1 → possible pullback → continue bullish momentum towards TP2 ATH following the 30-min uptrend line.
⚡ Trading Idea (based on chart)
Buy Entry: ~3749
Stoploss: ~3743
TP1: ~3765
TP2: ~3783
This setup offers a risk-reward ratio > 1:3, which is strong for an intraday buy trade.
👉 Do you want me to calculate the exact risk-to-reward ratio (RRR) for this setup so you can evaluate position sizing?
