XAUUSUS | Government Shutdown Confirmed | Gold awaits ADP & ISM🔎 Context & News
US Politics : The US government officially shut down after the Senate failed to pass the federal funding bill. A major political risk catalyst, triggering safe-haven flows into Gold.
FED : Probability of a -25bps rate cut in October rises to 96.2% → almost certain.
Key Events Today (ET / UTC) :
• ADP Employment Change: 08:15 ET / 12:15 UTC
• ISM Manufacturing PMI: 10:00 ET / 14:00 UTC
→ Both will be crucial data points that may shake Dollar and Gold.
📌 Summary : US politics + FED easing = Gold remains supported, but ADP & ISM tonight could spark strong volatility in the US session.
📈 Technical Analysis (H1)
Main Trend : Bullish after multiple BoS.
EMA : EMA 34 > EMA 89 → bullish momentum intact.
Resistance :
3,897 – 3,907 (Sell scalp – Fibo 0.5–0.618).
3,920 – 3,921 (Liquidity / ATH test).
Support :
3,872 – 3,876 (old high retest).
3,833 – 3,841 (OB zone).
3,814 – 3,822 (deep Support Zone – losing this shifts bias).
🎯 Trade Plan
✅ Buy (trend priority)
Buy Zone 1 : 3,872 – 3,876
• SL: 3,869
• TP: 3,897 → 3,907 → 3,920
Buy Zone 2 (OB) : 3,833 – 3,841
• SL: 3,826
• TP: 3,872 → 3,897 → 3,907
Buy Zone 3 (Deep Support) : 3,814 – 3,822
• SL: 3,808
• TP: 3,841 → 3,872 → 3,897
⚡ Sell (short scalps only – lower RR)
Sell Zone 1 : 3,897 – 3,907
• SL: 3,912
• TP: 3,885 → 3,876 → 3,841
Sell Zone 2 (ATH sweep) : 3,920 – 3,921
• SL: 3,925
• TP: 3,907 → 3,885 → 3,876
📝 Conclusion
Gold remains strongly supported by the US government shutdown + FED rate cut expectations.
Strategy today: Prioritize Buy at support; Sell only for short scalps around 3,907 – 3,921.
⚠️ Watch out: ADP & ISM tonight may trigger unexpected volatility → manage risk carefully and move SL to BE after TP1.
📢 If you find this Captain’s Log useful, don’t forget to Follow Captain Vincent ⚓ for the latest updates.
💬 What do you think, crew? Will Gold break ATH 3,920 right after ADP & ISM tonight?
Xauusdupdates

ATH $3871: Shutdown Fear & 97% Fed Cut Fuel Gold Surge
Hello, investors and traders!
Gold continues to show phenomenal strength, setting a new ATH at $3,871.45/oz (on Sept 30), and closing at $3,843.43/oz. This gain confirms the strongest September since 2011, solidly confirming the explosive growth trend for the yellow metal.
Fundamental Analysis: Politics and the Fed Drive Buying Wave
Two core drivers are pushing gold prices higher, making any attempt to short (call the top) extremely risky:
Political Instability: The risk of a looming US Government shutdown is ratcheting up uncertainty and strongly boosting safe-haven demand.
Low-Rate Expectations: Weakening US jobs data has nearly locked in the probability that the Fed will cut interest rates in October. The market is currently pricing in a 97% chance of a Fed rate cut.
Technical Analysis & Trading Strategy
After a recent shock drop of 70 points, Gold quickly absorbed the selling pressure and created a new ATH, proving that buying pressure is overwhelming. The strong upward bias is undeniable.
Outlook: Continue to Prioritize Buy given the powerful trend and supportive fundamentals. Only attempt Sell strategies near psychological resistance levels with an extremely tight Stop Loss (SL).
Key Resistance: $3894, $3904, $3914, $3924
Key Support: $3869, $3843, $3834
Suggested Trading Strategy (Absolute Risk Management):
BUY SCALP
Zone: $3870 - $3868 / SL: $3864
TP: $3875 - $3885 - $3900
BUY ZONE
Zone: $3834 - $3832 / SL: $3824
TP: $3842 - $3862 - $3892
SELL SCALP (High Risk)
Zone: $3904 - $3906 / SL: $3910
TP: $3901 - $3891 - $3876
SELL ZONE (High Risk)
Zone: $3925 - $3927 / SL: $3935
TP: $3917 - $3907 - $3897 - $3887 - $3877 - $3867
The market is running on fear and rate-cut anticipation. Are you betting on the $3900 mark this week? 👇
#Gold #XAUUSD #ATH #Fed #GovernmentShutdown #TradingView #InterestRates #FinancialMarkets

XAUUSD – Gold Smashes to New ATH: Bulls in Full Control📊 Market Overview
Gold has surged into uncharted territory, breaking through to a fresh All-Time High (ATH). The earlier dip toward 3,800 USD acted as nothing more than a springboard, allowing buyers to reload before launching this powerful breakout.
Safe-haven demand continues to fuel the rally, as concerns over a potential US government shutdown and expectations of more Fed rate cuts strengthen bullish momentum.
📍 Crucial Levels to Watch
🔴 SELL Reaction Zone
3,911 – 3,915 (Liquidity Resistance) → Potential short-term ceiling, profit-taking may appear here.
🟢 BUY Reaction Zones
3,830 – 3,820 (Fibo Support) → First pullback level for intraday buyers.
3,808 – 3,810 → Secondary support zone for a deeper correction.
3,747 – 3,752 (Liquidity BUY Zone) → Stronger base for swing buyers.
🎯 Trading Setups
1️⃣ Buy the Dip (Primary Play)
Entry: 3,830 – 3,820, confirmation needed.
Targets: 3,900 → 3,915, extend toward 3,950+ if momentum remains strong.
Stop: Below 3,808.
2️⃣ Sell the Spike (Countertrend)
Entry: 3,911 – 3,915, only on visible rejection.
Targets: 3,871 → 3,830.
Stop: Above 3,922.
3️⃣ Swing Buy Opportunity
Entry: 3,752 – 3,747 (Fibo confluence).
Targets: 3,830 → 3,900.
Stop: Below 3,735.
⚡ Pro Tips
Trend bias = Strongly Bullish, prioritize long setups.
Countertrend shorts are tactical; keep stops tight.
Headlines from the US political scene and Fed could trigger extra volatility at highs.
💬 Discussion
Will gold extend to 3,950 – 4,000 USD, or is a sharp pullback around the corner? Drop your views and charts below 👇

US Government Shutdown, Gold Benefits & FOMO BUY Continues📊 Market Context The gold market kicks off Q4/2025 with great enthusiasm as safe-haven flows continue to surge.
Not only that, the potential delay of the NFP employment report this week further fuels the market's "thirst" for directional information, positioning gold as the central asset in everyone's sights. Meanwhile, the USD is under pressure from political uncertainties and expectations that the Fed is moving closer to further rate cuts.
Combined, the current picture shows that gold is not only maintaining its strength after a breakout rally but also has the opportunity to expand and conquer new high price territories, as safe-haven capital and FOMO momentum from the BUY side continue to amplify.
🔎 Technical Analysis (H1/H4)
The price maintains the main upward trend, staying above the support structure.
Important BUY ZONE: 3833–3831 (Fibo + CP zone) – this area is likely to react strongly.
Secondary BUY ZONE: 3817–3815 (OBS zone) – stronger support, suitable for accumulating additional BUY orders.
Resistance area 3919–3923 (Liquidity Sell Zone) may be where liquidity traps appear.
✅ BUY ZONE 1: 3833–3831
SL: 3827
TP: 3838 - 3842 - 3846 - 3850 - 3855 - 3860 - 3870 - ???
✅ BUY ZONE 2: 3817–3815
SL: 3810
TP: 3822 - 3826 - 3830 - 3835 - 3840 - 3850 - 3860 - 3870 - ???
✅ Summary Gold is directly benefiting from political instability and the delay in US economic data. The main trend remains BUY with safe-haven flows, with strategic zones at 3833–3831 and 3817–3815. The expansion target aims for 3870–3880 and beyond to 3920+ if buying momentum remains strong.

XAUUSD Daily Plan – Gold’s Pullback Before the Next Leg Higher📊 Market Overview
Gold has pulled back from its fresh record highs but the move looks more like healthy accumulation than a reversal. The 3,800 zone has acted as a strong support, absorbing selling pressure and keeping the broader bullish trend intact. Immediate rebounds confirm that buyers are still in control, preparing for the next breakout.
📍 Key Levels to Watch
🔴 SELL Reaction Zone
3,871 – 3,872 → First resistance level, possible short-term rejection.
3,915 – 3,920 (Fibo Liquidity Zone) → Stronger sell wall where profit-taking may appear.
🟢 BUY Zones
3,808 – 3,810 (Fibo 0.786 Support) → Important reaction zone for intraday buy setups.
3,747 – 3,752 (Fibo Liquidity Buy Zone) → Deep correction level, strong long-term demand area.
🎯 Trading Scenarios
1️⃣ Bullish Continuation Setup
Entry: Buy near 3,808 – 3,810 on bullish candlestick confirmation.
Targets: 3,871 → 3,900+
Stop: Below 3,795
2️⃣ Deep Pullback Opportunity
Entry: 3,747 – 3,752 if price flushes lower.
Targets: 3,808 → 3,871
Stop: Below 3,735
3️⃣ Countertrend SELL Setup
Entry: 3,915 – 3,920 only with strong rejection.
Targets: 3,871 → 3,808
Stop: Above 3,928
⚡ Trading Notes
Gold remains in a strong bullish channel – selling should only be tactical and short-term.
Watch US political headlines and end-of-month flows, as they could trigger volatility.
Stick to defined Fibo zones for best risk-to-reward setups.
💬 Community Discussion
Do you think Gold will test 3,900+ this week or will we see a deeper correction first? Share your charts and ideas below 👇

GOLD ATH: US Shutdown Drama! Buy The Dip, Yaar? Gold just smashed a new record at $3,833.37/oz (Sept 29) on high safe-haven demand due to the impending US Govt shutdown (Oct 1) and solid FED rate cut hopes. USD pullback (0.2%) also playing its part.
The sudden dip to $3,794 looks like pure end-of-month profit-booking, not a proper reversal. If US tensions worsen, the Buy opportunity is still very much active!
📈 Technical View & Intraday Trade Setup
Gold has done a major flush, stopping out the weak hands. Selling pressure is there, but the drop without big news suggests caution. Look for a technical bounce to fill the FVG before a potential continuation lower.
Key Levels:
Resistance: $3827 / $3846 / $3870
Support: $3787 / $3778 / $3763
Detailed Trading Strategy (US Session):
1. BUY Zone (Aggressive Dip Buy):
Entry: $3784 - $3782
SL: $3774
TP: $3792 / $3812 / $3832
2. SELL Scalp (Quick Short):
Entry: $3827 - $3829
SL: $3833
TP: $3824 / $3814 / $3804
3. SELL Zone (Main Short Entry):
Entry: $3866 - $3868
SL: $3876
TP: $3858 / $3838 / $3818
⚠️ Alert! The US Government Shutdown news is the main event. If budget talks are positive, Gold might see a sharp fall. Manage risk (SL) like a boss!
Kya lagta hai? Will Gold fly to $4K or take support near $378x? 👇
#XAUUSD #Gold #MCX #TradingStrategy #USShutdown #FED #TechnicalAnalysis #Intraday #MarketUpdate #Commodities

XAUUSD – Gold Daily Plan | Sharp Drop, What’s Next?Gold printed a sudden 70+ point drop from 388x to 380x, leaving traders questioning:
– Was this a big player manipulation?
– Or simply institutional profit taking?
Key reaction zones will define if Gold holds above 3800 or dives deeper.
📍 Critical Levels
🔴 SELL Reaction Zone
387x → Strong resistance where sellers may step in.
🟢 BUY Zones
3780 (Retest Breakout + Trendline) → First demand zone.
375x (Fibo Support Zone) → Strong liquidity pocket, potential reversal.
🎯 Trading Scenarios
1️⃣ SELL Idea
Entry: 387x
Targets: 3800 → 3780
SL: Above 3888
2️⃣ BUY Idea
Entry: 3780 – 375x
Targets: 3838 → 387x
SL: Below 3745
⚡ Trading Notes
High volatility expected near 3800 psychological mark.
Stick to zone trading – avoid mid-range traps.
Monitor USD strength; any spike could pressure XAU further.
💬 Discussion
Do you think Gold will break below 3800 or bounce back to test 387x? Drop your views 👇

Gold 30/09 - Safe-haven flows surge | Gold sails toward new ATH 🟡 XAU/USD – 30/09 | Captain Vincent ⚓
🔎 Captain’s Log – Context & News
US Politics : Meeting between Trump and bipartisan leaders ended without agreement → growing risk of a US government shutdown by Wednesday.
Conflict : Democrats demand concessions, Republicans fiercely oppose → wide gap remains, both sides blaming each other.
Market : Investors watch JOLTS data and speeches from 3 FED members, but political risks are the strongest catalyst for Gold.
Trend : Safe-haven flows keep pouring into Gold → increasing likelihood of testing new ATH.
⏩ Captain’s Summary : US political seas are stormy, Gold becomes the fortress of safety. The voyage toward ATH is widening.
📈 Captain’s Chart – Technical Analysis (H1)
EMA : EMA 34 (yellow) > EMA 89 (red) → bullish trend clearly dominant.
Golden Harbor (Support / Buy Zone)
Big Volume Dock: 3,827
Storm Breaker (Resistance / Sell Zone)
ATH test: 3,916 – 3,917
Market Structure : Gold broke out strongly, now trading around 3,870. Main trend remains bullish, with 3,842 – 3,827 as key anchor zones.
🎯 Captain’s Map – Trade Plan
✅ Buy (main priority)
Buy Zone 2 – Big Volume
Entry: 3,827 – 3,824
SL: 3,815
TP: 3,870 – 3,899 – 3,916
⚡ Sell (short scalp – high risk)
Sell Zone – ATH test
Entry: 3,917 – 3,920
SL: 3,925
TP: 3,899 – 3,870 – 3,856
⚓ Captain’s Note
“The Golden sails are filled by safe-haven winds, pushing the ship close to ATH. Golden Harbor 🏝️ (3,842 – 3,827) is the ideal dock for sailors to position Buys. Storm Breaker 🌊 (3,916 – 3,920) may unleash violent waves, suitable only for short Quick Boarding 🚤 scalps. If the political storm from Washington breaks out, Gold’s voyage could surpass the peak and expand its horizon.”
📢 If you find the Captain’s Log useful, don’t forget to Follow for the earliest updates.
💬 What’s your view, crew? Will Gold conquer ATH around 3,917 this week?

H1 bullish momentum intact | Buy 3,792–3,765, target 3,821🟡 XAU/USD – 29/09/2025 | Captain Vincent ⚓
🔎 Captain’s Log – Structure & Trend
H1 continues to print consecutive BoS → bullish trend sustained.
Price broke the long-term downtrend line and surged to new highs.
EMA 34 & EMA 89 both pointing up and below price → confirming short-to-mid-term bullish momentum.
📈 Captain’s Chart – Key Zones
Storm Breaker (Sell Zone / ATH test) : 3,818 – 3,821
Golden Harbor (FVG – Buy Zone) : 3,792 – 3,779
OB Harbor 1 : 3,772 – 3,765
OB Harbor 2 (deeper) : 3,731 – 3,724
Core Idea: 3,792 – 3,765 is the main support “cushion” for trend-follow Buys; 3,818 – 3,821 is the wave edge where profit-taking may occur.
🎯 Captain’s Map – Trade Plan
✅ Golden Harbor (BUY – main priority)
Buy Zone 1 – FVG (3,792 – 3,779)
Entry: 3,792 – 3,779
SL: 3,765
TP: 3,805 – 3,818 – 3,821+
Buy Zone 2 – OB1 (3,772 – 3,765)
Entry: 3,772 – 3,765
SL: 3,758 (below 3,765)
TP: 3,792 – 3,805 – 3,818 – 3,821
Buy Zone 3 – OB2 deep (3,731 – 3,724)
Entry: 3,731 – 3,724
SL: 3,714
TP: 3,745 – 3,765 – 3,792 – 3,805
⚡ Quick Boarding (SELL – scalp only)
Sell Zone – Storm Breaker (3,818 – 3,821)
Entry: 3,818 – 3,821
SL: 3,828
TP: 3,805 – 3,796 – 3,792
Breakdown Short (conditional)
Only consider Short if H1 closes below 3,724
SL: 3,735
TP: 3,710 – 3,700 – 3,690
⚓ Captain’s Note
“The Golden sails remain filled after consecutive BoS . Golden Harbor 🏝️ (3,792 → 3,765) is the anchor dock to board in trend’s direction. Storm Breaker 🌊 (3,818 – 3,821) may trigger profit-taking waves – only go Quick Boarding 🚤 if clear signals appear. If the tide drags below 3,724, let the ship retreat to OB2 to gather strength before resuming the northbound voyage.”

New ATH Above 3800 & FOMO Buying Still Driving the Market📊 Market Context
Gold has once again set a new all-time high above 3800 USD/oz, showing no signs of losing bullish momentum. The surge is fueled by strong FOMO buying flows, as traders continue to pile into safe-haven assets.
Concerns about a possible US government shutdown and renewed discussions around tariff policies have weighed on the dollar, while expectations of upcoming Fed rate cuts keep gold supported. Meanwhile, Fed speeches and incoming US data remain key drivers that could inject short-term volatility, but the broader bullish narrative remains intact.
🔎 Technical Analysis (H1/H4)
Price is firmly holding above the 3800 psychological level, confirming the breakout.
Buy zones remain intact at 3790–3792 and 3784–3782, with solid demand expected on any dip.
Sell liquidity sits around 3823–3825, where short-term profit-taking or traps may emerge before the next leg higher.
🔑 Key Levels
Resistance / Sell Zone: 3823–3825
Support / Buy Zones: 3790–3792, 3784–3782
📈 Scenarios & Trading Plan
BUY ZONE 1: 3790–3792
SL: 3786
TP: 3795 - 3800 - 3810 - 3820 - 3830 - ???
BUY ZONE 2: 3784–3782
SL: 3778
TP: 3790 - 3795 - 3800 - 3810 - 3820 - 3830 - 3840 - ???
SELL ZONE (Liquidity Trap Zone): 3823–3825
SL: 3830
TP: 3818 - 3814 - 3810 - 3805 - 3800 - ???
⚠️ Risk Notes
Beware of liquidity sweeps near 3823–3825 before continuation higher.
Fed comments and macro data may cause sudden spikes — adjust risk accordingly.
Stick to confirmation entries around zones to avoid being trapped by false moves.
✅ Summary
Gold is riding strong FOMO-driven bullish momentum, printing new highs above 3800. Main bias: buy on dips at 3790–3782, while monitoring short-term sell liquidity at 3823–3825 for potential pullbacks. The broader trend remains bullish, so patience and disciplined entries will be key.

Gold awaits PCE | EMA squeeze, big waves ahead🟡 XAU/USD – 26/09 | Captain Vincent ⚓
🔎 Captain’s Log – Context & News
Trump : Announced a 100% tariff on branded drugs if not produced in the US → escalating trade tensions.
PCE tonight : The FED’s most important inflation gauge, key to shaping October rate cut expectations (current probability 91.09%).
The market is in “hold breath” mode, awaiting the PCE spark to decide the next direction.
⏩ Captain’s Summary : Gold is squeezed between two winds – short-term EMA pressure and major expectations from PCE.
📈 Captain’s Chart – Technical Analysis
EMA : EMA 34 (yellow) remains below EMA 89 (red) → short-term bearish pressure persists, but narrowing gap signals big volatility ahead.
Golden Harbor (Support / Buy Zone)
3,738 – 3,730
3,718
3,687
3,651
Storm Breaker (Resistance / Sell Zone)
3,755 – 3,773
🎯 Captain’s Map – Trade Plan
⚡ Sell (scalp at resistance)
Entry: 3,773 – 3,776
SL: 3,783
TP: 3,755 – 3,745 – 3,734
✅ Buy (trend-follow priority)
Buy Zone 1 (Scalping)
Entry: 3,72x – 3,718
SL: 3,710
TP: 3,750 – 3,769 – 3,776
Buy Zone 2 (Deeper OB)
Entry: 3,685 – 3,683
SL: 3,675
TP: 3,690 – 3,695 – 3,700 – 3,705 – 3,7xx
⚓ Captain’s Note
“The Golden sails are being squeezed between EMA 34 & 89. Golden Harbor 🏝️ (3,734 – 3,683) remains the safe dock for sailors to await the big wave. Storm Breaker 🌊 (3,773 – 3,776) is raising fierce waves, only suitable for short Quick Boarding 🚤 scalps. Tonight’s PCE will be the decisive wind – either pushing the ship beyond 3,78x or forcing it back to retest 3,72x.”
📢 If you find Captain’s Log useful, don’t forget to Follow for the latest updates.
💬 What do you think? Will Gold break through 3,78x or retest 3,72x first?

XAUUSD/GOLD WEEKLY BUY PROJECTION 28.09.25XAUUSD/Gold Weekly Buy Projection (27.09.25). Here’s a breakdown of what it shows:
Current Price Level: Around 3,759.85.
Technical Zones Marked:
Broke the Uptrend Line (earlier support turned resistance).
Bearish Engulfing Failed (bullish strength seen).
Fair Value Gap (FVG) near 3,740–3,750 zone, acting as a demand zone.
Projection Path:
Price expected to bounce from the FVG/demand area.
Then follow an upward zigzag movement toward the target zone around 3,860.
Trend Channel:
Multiple parallel blue channels drawn indicate a bullish structure.
Projection suggests continuation of the uptrend.
Target Price:
Marked close to 3,860, aligning with the upper channel line.
🔑 Summary of Projection:
Bias: Bullish
Entry Zone: 3,740–3,760 (Fair Value Gap zone)
Target Zone: 3,860
Risk Area: If price breaks below 3,720, projection may fail.
👉 Do you want me to prepare a trading plan (entry, SL, TP, and risk %) based on this projection for you?

XAUUSDALWAYS TAKE TRADE WITH CONFIRMATION
Note : Trading in any financial market is very risky. I post ideas for educational purpose only. It is not financial advice. Do not hold us responsible for any potential loss you may incur. Please consult your financial adviser before trading.

Jobs vs. Inflation: Gold Steady Before PCE ShowdownHello, investors!
Gold saw only a marginal 0.1% gain, closing at $3,739.42/oz on September 25. This struggle was due to better-than-expected US jobs data (jobless claims dropped sharply), which slightly pared back the market's expectation for a Fed rate cut in October (down to 85%).
However, Gold maintains support from dovish Fed comments and potential political instability (like Trump's proposed 100% drug tariff). The entire market focus now shifts to today's (Sept 26) PCE Inflation Report.
Expert Alert: If the PCE data is hotter than anticipated, Gold could face sharp, temporary downward pressure.
Technical Analysis & Strategy
Gold is currently consolidating within a triangle pattern and has yet to break the $375x resistance. While more selling pressure is possible before the PCE release, the long-term trend remains bullish.
Outlook: Prioritize Buy if the price maintains above the Key Level $373x. If the news causes the price to break $373x, be ready to flip the strategy to Sell.
Key Resistance: $3755, $3768, $3778
Key Support: $3738, $3727, $3712
Suggested Trading Strategy (Strict Risk Management):
BUY SCALP
Zone: $3739 - $3737
SL: $3733
TP: $3742 - $3747 - $3752 - $3757 - $3767
BUY ZONE
Zone: $3704 - $3702
SL: $3694
TP: $3712 - $3722 - $3732 - $3742 - $3762
SELL ZONE
Zone: $3776 - $3778
SL: $3786
TP: $3768 - $3758 - $3748 - $3728 - $3708
The market is at a critical juncture. What is your game plan for today? 👇
#Gold #XAUUSD #PCE #Fed #Inflation #TradingView #ATH

XAUUSD – FIBO MATRIX Trading Plan | Key Levels for TodayMarket Snapshot
Gold is attracting steady buying interest as dovish Fed expectations keep the USD capped near 3-week highs.
At the same time, geopolitical tensions and tariff concerns add to safe-haven demand.
Focus now shifts to US PCE inflation data, which could trigger the next big move.
📍 Important Price Zones (M30)
🔴 SELL Reaction Zones
3767 – 377x → Major rejection area (Fibo 0.786).
3810 – 3817 → Strong SELL zone (Fibo 1.5 – 1.618).
🟢 BUY Support Zones
3725 → First support zone.
3690 – 3695 → Deep pullback support (Fibo confluence).
🎯 Trading Ideas
1️⃣ SELL Setup
Entry: 3767 – 377x (if rejection signal shows).
Targets: 3750 → 3725.
SL: Above 3778.
2️⃣ BUY Setup
Entry: 3725 with bullish confirmation.
Targets: 3760 → 377x.
SL: Below 3715.
3️⃣ Deep BUY Opportunity
Entry: 3690 – 3695 zone.
Targets: 3725 → 3760.
SL: Below 3685.
⚡ Trading Insights
Respect the Fibo reaction levels for clean entries.
Risk range: 6–8 USD to avoid stop hunts.
Book profits in steps: 1R → 2R → 3R for strong RR balance.
💬 Community Talk
Do you see gold breaking above 3770 first, or dropping to 3725/3695 before bouncing back? Share your chart view 👇

XAUUSD – Trading Plan: Gold Awaits PCE Catalyst📊 Market Context
Gold remains in consolidation mode after a sharp run earlier this week, holding steady below 3750. The market is now laser-focused on the US Core PCE Index, which could provide fresh direction for both the dollar and precious metals. With US yields stabilising and risk sentiment shifting, gold’s safe-haven appeal remains intact — but traders are weighing whether the recent pullback is a healthy correction or the start of a deeper retracement.
Meanwhile, the geopolitical backdrop continues to offer underlying support, while positioning in ETFs and futures suggests investors are cautious, awaiting clearer signals from the Fed. The upcoming data will likely decide whether gold breaks higher towards fresh highs or retests deeper liquidity zones.
🔎 Technical Analysis (H1/H4)
Price capped near short-term resistance at 3770–3772.
Immediate supports are 3741 and 3722, with deeper demand zones at 3690–3688 and 3670–3668.
The structure indicates possible liquidity sweeps before a decisive move.
🔑 Key Levels
Resistance / Sell Zone: 3770–3772
Support / Buy Zones: 3690–3688, 3670–3668
📈 Scenarios & Trading Plan
BUY ZONE 1: 3690–3688
SL: 3684
TP: 3695 - 3700 - 3710 - 3720 - 3730 - ???
BUY ZONE 2: 3670–3668
SL: 3664
TP: 3675 - 3680 - 3690 - 3700 - 3710 - ???
SELL ZONE: 3770–3772
SL: 3777
TP: 3765 - 3760 - 3750 - 3740 - ???
⚠️ Risk Notes
Watch for false breakouts at 3770–3772 before reversal.
PCE release may inject volatility across gold and USD pairs.
Position sizing and risk control are crucial into data.
✅ Summary
Gold is at a crossroads — safe-haven demand is still supportive, but technical resistance near 3770 remains a hurdle. Core strategy: buy dips into 3690–3670 zones, while staying cautious of short-term sell setups at 3770–3772. Manage exposure, wait for confirmation, and be prepared for volatility once PCE data hits.
📢 Follow MMFLOW TRADING for real-time updates and next-level trade setups.

Gold "Cools Down": A Sign of a Coming Downturn? Hello, investors!
Gold saw a notable correction on September 24, closing at $3,762.73/oz after reaching a historic high of $3,790.82/oz just one day earlier. Gold futures also dropped 0.5% to $3,795.80/oz. Is this a sign of a deeper correction or just a short-term profit-taking before key news?
Fundamental Analysis: Market "Holds Its Breath" Before the PCE Inflation Report
Yesterday's drop in gold seems to have little to do with the released U.S. economic data, as the USD index only had a slight rebound and housing data wasn't strong enough to cause such a major move. Instead, the most likely reasons are:
Cautious Profit-Taking: Investors are taking profits after a rapid run-up, aiming to mitigate risk before the upcoming PCE inflation report on September 26.
Fed Expectations: Despite short-term volatility, the market holds firm on its expectation that the Fed will cut rates in October and December with a high probability (94% and 77%). A low-rate environment and geopolitical concerns remain the core drivers supporting gold's price in the long term.
Technical Analysis: "Sell" or "Wait to Buy"?
Gold had a significant correction from the $3,770 area, indicating that a large number of profit-taking sell orders were triggered. However, the downtrend has paused and is now looking for a new balance point.
Outlook: With the current cautious sentiment, there's a chance gold may see further selling pressure in the short term. However, any deeper drop would be an excellent opportunity to buy back at a better price, as the long-term bullish momentum is still intact.
Suggested Trading Strategy (Strict Risk Management):
Sell Zone: Zone $3766 - $3768, SL $3776
Buy Zone: Zone $3702 - $3700, SL $3692
The market is highly sensitive. Do you think this correction is a buying opportunity or a time to step back? Share your thoughts! 👇
#Gold #XAUUSD #Fed #GoldAnalysis #TradingView #InterestRates #Inflation #PCE #USD

Fed Cuts & Geopolitical Risks Keep Gold Strong📊 Market Overview
Gold is holding firm above 3750 USD/oz, extending gains and refreshing daily highs in the European session. Expectations that the Federal Reserve will continue cutting rates this year are supporting bullish sentiment, while ongoing geopolitical tensions keep safe-haven demand elevated. For Indian traders, this combination of softer USD and global uncertainty keeps gold attractive both as a hedge and a short-term trading instrument.
🔎 Technical Analysis (H1/H4)
Price structure remains bullish while holding above 3750.
Buy Zones: 3742–3740 (main support) and 3757–3755 (scalp setup).
Resistance nearby at 3778, with extended upside potential towards 3813–3815 (liquidity sell zone).
A rejection at 3813–3815 could trigger a short-term pullback to demand levels.
🔑 Key Levels
Resistance: 3778 - 3813 - 3815
Support / Buy Zones: 3757 - 3755 - 3742 - 3740
📈 Scenarios & Trading Plan
✅ BUY ZONE (Main Setup): 3742–3740
SL: 3735
TP: 3748 - 3752 - 3756 - 3760 - 3770 - 3780 - …
✅ BUY SCALP (Quick Entry): 3757–3755
SL: 3750
TP: 3762 - 3766 - 3780 - …
✅ SELL ZONE (Liquidity Trap): 3813–3815
SL: 3820
TP: 3810 - 3805 - 3800 - 3795 - 3790 - 3780 - …
⚠️ Risk Management Notes
Watch out for false breakouts at 3813–3815 — liquidity sweeps are likely before reversals.
Focus on buying confirmed pullbacks rather than chasing price mid-range.
Keep trade size moderate — volatility can increase on Fed comments or geopolitical updates.
✅ Summary
Gold’s bullish trend remains intact, supported by Fed cut expectations and geopolitical risks. Trading plan: buy dips at 3757–3755 and 3742–3740, aiming for 3770–3780, while monitoring the 3813–3815 zone for short-term sell opportunities if rejection occurs.
📢 Follow MMFLOW TRADING on TradingView for intraday setups, liquidity-based strategies, and high-probability trade ideas tailored for global traders.

Gold Sets New Record: Rate Hopes Driving Price HigherHello, traders!
Gold surged to a record high of $3,726.19/oz on September 22, fuelled by growing investor expectations for a clearer Fed rate-cutting path. Traders are now betting on two more rate cuts this year with a very high probability.
The growth drivers have shifted from being primarily central bank and Asian demand to now include strong buying from Western investors, as shown by increased holdings in gold ETFs. Upcoming speeches from Fed officials and the core PCE inflation data this week will be key in determining the market's next direction.
Technical Analysis & Strategy
Gold is in a strong uptrend and is continuously setting new highs. While there was a minor correction, the bullish momentum remains intact. Shorting near resistance levels is highly risky.
Outlook: Continue to prioritize Buy positions if gold holds above $370x.
Resistance: $3785, $3794, $3804
Support: $3774, $3764, $3754
Suggested Trading Strategy:
Buy Scalp: Zone $3765 - $3763, SL $3759
Buy Zone: Zone $3754 - $3752, SL $3744
Sell Zone: Zone $3800 - $3802, SL $3810
The market is highly volatile. Do you think gold can hit the $3,800 mark this week? Share your thoughts! 👇
#Gold #XAUUSD #Fed #GoldAnalysis #TradingView #InterestRates #Inflation #ATH

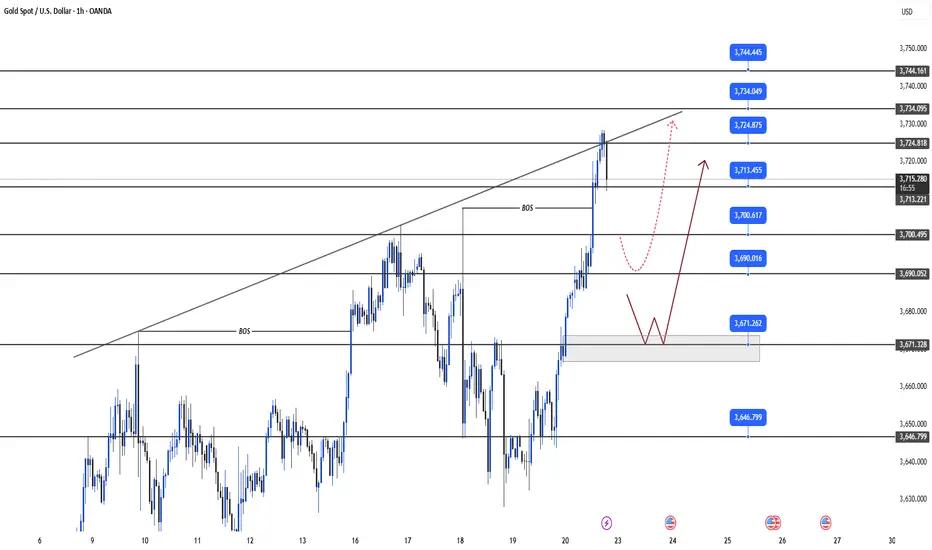
XAUUSD/GOLD 30 MIN BUY PROJECTION 23.09.25XAUUSD/Gold 30-min buy projection chart you shared for 23.09.25. Here’s the breakdown of what the chart indicates:
🔎 Chart Analysis
Trend: Price is moving within a bullish (upward) channel, shown by the blue trend lines.
Entry Zone: Around 3749.687 (marked as ENTRY, just above Support 1).
Stop Loss (SL): Around 3743.131, below the 30-min FVG (Fair Value Gap).
Supports:
Support 1: ~3749 zone
Support 2: ~3755–3757 zone
Take Profits:
TP1: Around 3765–3767 level (mid-channel target).
TP2 (ATH – All-Time High for this projection): Around 3783–3785.
Projection Path:
Price expected to bounce near entry zone → rise towards TP1 → possible pullback → continue bullish momentum towards TP2 ATH following the 30-min uptrend line.
⚡ Trading Idea (based on chart)
Buy Entry: ~3749
Stoploss: ~3743
TP1: ~3765
TP2: ~3783
This setup offers a risk-reward ratio > 1:3, which is strong for an intraday buy trade.
👉 Do you want me to calculate the exact risk-to-reward ratio (RRR) for this setup so you can evaluate position sizing?

Daily Trading Plan: Liquidity Zones & Bullish Outlook📊 Market Context
Gold is holding strong after its breakout, trading near 3760 USD/oz as safe-haven demand stays elevated. The combination of geopolitical tensions, global fund flows into ETFs, and a weaker USD continues to support the bullish bias. For Indian traders, gold’s rally is closely watched as both an investment hedge and a short-term trading opportunity. While the broader structure remains bullish, price may first sweep liquidity in key zones before pushing towards higher levels.
🔎 Technical Analysis (H1/H4/2H)
Price recently tested 3760, confirming bullish momentum.
Immediate support: 3725, marked as a CP retest zone.
Stronger support: 3689–3690, overlapping with OBS + FVG demand zone.
Resistance targets: 3788 (short-term liquidity pool) and 3805–3830 (major liquidity area).
Overall structure: Still bullish, but likely to retest demand zones before the next leg higher.
🔑 Key Levels
Resistance / Sell Zones: 3760 ➡️ 3788 ➡️ 3805–3830
Support / Buy Zones: 3725 ➡️ 3689–3690
📈 Scenarios & Trading Plan
✅ BUY ZONE 1 (Shallow Pullback): 3725
SL: 3716
TP: 3760 ➡️ 3788 ➡️ 3805 …
✅ BUY ZONE 2 (Deeper Liquidity Retest): 3689–3690
SL: 3680
TP: 3725 ➡️ 3760 ➡️ 3788 ➡️ 3830 …
✅ SELL SCALP (Liquidity Trap Setup): Around 3788–3805, if rejection patterns confirm
SL: 3810
TP: 3775 ➡️ 3760 ➡️ 3740 …
⚠️ Risk Management Notes
Watch out for false breakouts above 3788 or below 3725 – liquidity sweeps are common.
Enter trades only after confirmation; avoid chasing price in the middle of the range.
Keep risk per trade controlled, as Fed speeches and geopolitical headlines could spark volatility.
✅ Summary
Gold remains in a strong uptrend, with 3788–3805 as the next upside magnet. The plan is to buy dips at 3725 or 3689–3690, while keeping an eye on potential short-term sell setups near 3788–3805. The bias stays bullish, but risk management is key.
📢 Follow MMFLOW TRADING for intraday updates, liquidity-based setups, and strategies tailored for global gold traders.

Gold's Rally Continues: Why a Fed Cut Isn't Slowing It DownHello, traders!
Gold started the new week on an impressive note, trading at $3,685 in early Monday's session. The main drivers are the market's continued reaction to the Fed's recent rate cut and escalating geopolitical events. So, the big question is, how far will this rally go?
Fundamental Analysis: Why Is Gold Still Soaring?
Although the Fed cut interest rates by 0.25%—the first time in 2025—Chair Jerome Powell maintained a cautious stance, calling it a "risk management cut." While this initially caused some market jitters, in the long run, lower interest rates are a strong supporting factor for gold.
Lower Rates: They reduce the opportunity cost of holding gold, which is a non-yielding asset.
Geopolitical Tensions: Conflicts in Ukraine and the Middle East are escalating, boosting safe-haven demand. Ukrainian President Zelenskyy reported that Russia carried out a major drone and missile attack, reaffirming gold's role as a protective asset against global risks.
Technical Analysis: Breaking Resistance, The Uptrend Continues
Gold had a powerful rally at the start of the week, successfully breaking the key resistance zone at $370x. The price is currently hovering around $3720 with a slight correction, but the uptrend remains firmly intact.
Outlook: Given the strong upward momentum, short-selling (going short) with a tight stop-loss is extremely risky. We will continue to prioritize long positions (going long) as long as gold holds above the $370x level.
Suggested Trading Strategy (Strict Risk Management):
BUY SCALP
Zone: $3413 - $3711
SL: $3407
TP: $3716 - $3721 - $3726 - $3731 - $3741
BUY ZONE
Zone: $3700 - $3798
SL: $3790
TP: $3708 - $3718 - $3728 - $3738 - $3758
SELL ZONE
Zone: $3734 - $3736
SL: $3744
TP: $3726 - $3716 - $3706 - $3796 - $3779
The market is showing unpredictable volatility. Can gold overcome all barriers and set new records? Share your opinion in the comments below! 👇
#Gold #XAUUSD #Fed #GoldAnalysis #TradingView #FinancialMarkets #TechnicalAnalysis #GoldTrading #USD #Geopolitics
Fed Dovish Signals & Geopolitical Tensions Boost Gold📊 Market Context
Gold continues to receive solid support from the Fed’s dovish tone and rising geopolitical tensions. However, the USD has extended its rebound from multi-year lows, which may temporarily limit gold’s upside. Broader risk-on sentiment in financial markets could act as a short-term headwind for XAU/USD before the next round of Fed speeches. Still, the long-term bullish trend has re-emerged, and gold is positioned to challenge new all-time highs in the near term—an important signal for Indian traders watching for fresh momentum in precious metals.
🔎 Technical Analysis (H1/H4)
Price has broken above the descending trendline, confirming that bullish momentum has returned.
Short-term support: 3686–3684, maintaining this level preserves the bullish structure.
Additional support: 3670–3668, overlapping with CP and liquidity zones on the chart.
Key resistance: 3720–3722, a crucial reaction level for profit-taking or liquidity sweeps.
🔑 Key Levels
Resistance: 3707 ➡️ 3720
Support: 3685 ➡️ 3669 ➡️ 3658
📈 Scenarios & Trading Plan
✅ BUY ZONE 1: 3686–3684
SL: 3680
TP: 3690 ➡️ 3695 ➡️ 3700 ➡️ 3705 ➡️ 3710 ➡️ 3720 ➡️ …
✅ BUY ZONE 2: 3670–3668
SL: 3664
TP: 3675 ➡️ 3680 ➡️ 3690 ➡️ 3700 ➡️ …
✅ SELL ZONE (Liquidity Trap Watch): 3720–3722
SL: 3726
TP: 3715 ➡️ 3710 ➡️ 3705 ➡️ 3700 ➡️ …
⚠️ Risk Management Notes
Watch for false breakouts at 3720–3722 — price could sweep stops before reversing lower.
Only enter longs with price action confirmation at the buy zones; avoid chasing price mid-range.
Manage trade size carefully given potential volatility from Fed comments and geopolitical news.
✅ Summary
Gold’s long-term bullish trend is firmly back, supported by Fed dovishness and geopolitical factors—key drivers for India’s gold market sentiment. The plan focuses on buying dips at 3686–3684 and 3670–3668 targeting 3705–3720, while short-term selling at 3720–3722 is valid if rejection appears.
📢 Stay updated with MMFLOW TRADING on TradingView for fresh market insights and actionable setups tailored for gold traders
