Elliott Wave Analysis – XAUUSD July 18, 2025
Momentum
• D1 timeframe: Momentum is preparing to turn bullish. The current decline has lasted for 5 daily candles – this is often the usual number that completes wave D. Therefore, the current stage is sensitive, and price could reverse upward at any time. However, during such periods, price often sweeps liquidity to the downside first, so caution is required.
• H4 timeframe: Momentum is still bearish, suggesting that price may continue falling on Monday. That said, a reversal to the upside on Monday is also possible.
• H1 timeframe: Momentum is already in the oversold zone, with the lines sticking together. If price continues to fall at the Asian session open, a gap may appear. In that case, pay close attention to the downside target zones.
Wave Structure
• D1 timeframe: On the daily chart, we can see a completed abcde corrective structure, followed by a strong rally. The current move is a decline, likely forming waves 1 and 2 (green) within the 5-wave structure of the larger wave 5. The latest D1 candle shows a long upper wick, indicating that selling pressure still remains.
• H4 timeframe: A 5-wave impulse (12345, black) has formed, which could represent wave 1 (green). Afterward, a 3-wave ABC correction (purple) developed. The market is likely within wave C (purple) at the moment. With H4 momentum still bearish, this supports the scenario that wave C (purple) is continuing. Key downside targets to watch: 3322 and 3298.
• H1 timeframe: Within wave C (purple), a 5-wave impulse (12345, black) is unfolding. The market is currently in the late stage of wave 4 and the start of wave 5. Wave 5 will be confirmed if price breaks below 3331. Key downside targets for wave 5:
o Target 1: 3322
o Target 2: 3315
o Target 3: 3299
Trading Plan
• Scenario 1:
o Buy Zone: 3323 – 3321
o SL: 3312
o TP1: 3333
o TP2: 3350
o TP3: 3381
• Scenario 2:
o Buy Zone: 3300 – 3298
o SL: 3290
o TP1: 3333
o TP2: 3350
o TP3: 3381
Xauusdupdates

XAUUSD Bullish Trend Continuation: Potential Move to $3,400!The price action shows a higher high ("high") and a higher low ("low"), which are characteristic of an uptrend. An upward trendline has been established, connecting a series of higher lows, which is acting as a dynamic support level. A significant horizontal support zone has also been identified around the $3,260 - $3,280 price range, where the price previously found support.
Recently, the price experienced a pullback and bounced off the upward trendline. The analysis anticipates a continuation of the upward momentum toward a key resistance zone. This resistance zone is located around the $3,400 - $3,420 level. A specific target price of $3,408.833 is highlighted within this zone, suggesting a potential area where the upward movement might pause or reverse.
The chart includes a potential corrective wave pattern labeled with "C"s, indicating a recent three-wave pullback within the larger trend. The current price is shown at $3,353.520, positioned above both the horizontal support and the upward trendline, reinforcing the bullish sentiment.

Elliott Wave Analysis – XAUUSD – August 15, 2025
1. Momentum
• D1 Timeframe: Momentum is preparing to reverse and the two lines are converging. We need to wait for the daily candle close for confirmation. At this stage, buying pressure is weak, but sudden downward spikes to sweep liquidity are still possible.
• H4 Timeframe: Momentum is rising, suggesting a potential rebound today. If this rebound fails to break above Wave B’s high, another downward move is likely.
• H1 Timeframe: Momentum is turning down, so a short-term drop is possible. If price breaks below 3331 and approaches the lower targets, it will align with H4’s upward momentum, creating the basis for a more stable rally.
2. Wave Structure
• D1 Timeframe: The abcde triangle pattern may have completed. We now have a black 5-wave structure, with Wave 1 formed and price possibly in Wave 2. A break below 3270 would invalidate this 5-wave count.
• H4 Timeframe: The black 12345 5-wave structure appears complete. Price may now be forming a purple ABC correction, with Waves A and B done, and price currently in Wave C. Based on Fibonacci from W12345, Wave C has two potential targets:
o Target 1: 3322 (Fibo 0.618)
o Target 2: 3298 (Fibo 0.782)
• H1 Timeframe: Within Wave C, a black 5-wave structure seems to be developing, and price may now be in Wave 4. Wave 4 has two possible targets: 3343 and 3350, after which price could drop to complete Wave 5.
3. Key resistance zones where Wave 5 may end:
• Target 1: 3322
• Target 2: 3315
• Target 3: 3299
4. Trade Plan
• Scenario 1:
o Buy Zone: 3322 – 3320
o SL: 3312
o TP1: 3332
o TP2: 3357
o TP3: 3381
• Scenario 2:
o Buy Zone: 3300 – 3298
o SL: 3290
o TP1: 3314
o TP2: 3343
o TP3: 3381

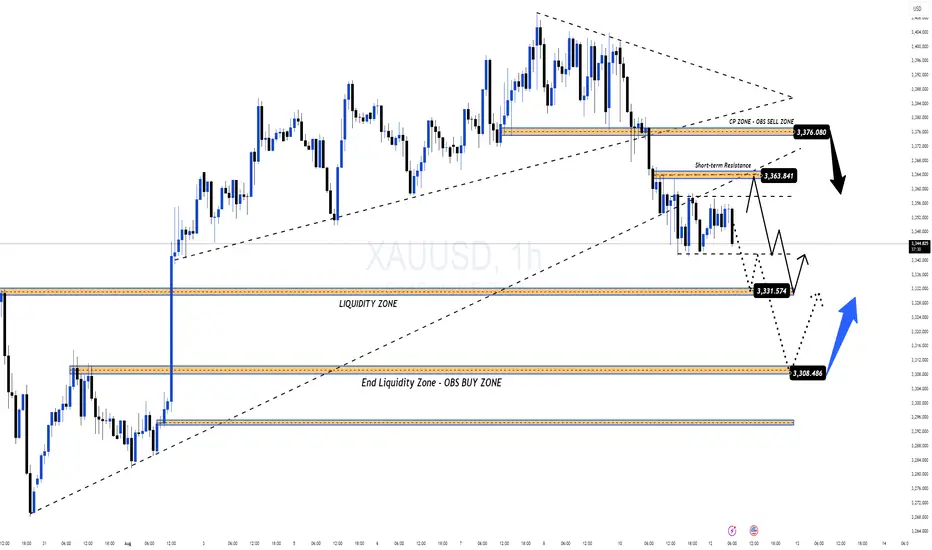
3330 Liquidity Zone – A Fresh Bullish Structure is Emerging!The 3330 liquidity zone continues to prove its strength as gold rebounds sharply from this level, forming a clean new bullish structure on the M30 timeframe. Buyers are now pushing price to trade around 334x, and if this momentum holds, the next upside targets lie at the FIB – CP Zones above 335x and 336x.
On the higher timeframe, the corrective wave is still in play, but short-term price action is opening opportunities for both BUY & SELL setups, provided we time our entries with precision.
Market Context & Key News
Today, the market will be watching the Trump–Putin meeting, which could trigger sharp geopolitical-driven moves.
This Friday also brings the usual liquidity sweep, adding to potential volatility.
That’s why MMFLOW recommends observing the trend closely to pick safe entry points and avoid getting caught in false breaks.
Trading Plan
1. SELL Zones
3355 – Prime OBS SELL ZONE, expecting strong reaction.
3362 – Higher resistance, aligned with the descending trendline. Note: Best to take entries here if reached during Asia or early London; late London/NY session tests are prone to false break traps.
2. BUY Zones
Watch 3334 – 3336 for early BUY entries on lower timeframes.
Safe stop-loss: below 3330.
If 3330 breaks → wait patiently for BUY opportunities around 331x.
Action Strategy
Prioritise early BUYs at 3334–3336 with confirmation signals.
SELL at 3355 or 3362 if clear rejection occurs.
Manage risk strictly – SL below 3330 for BUYs and above 3365 for SELLs.
💡 MMFLOW NOTE: This is gold – volatility can erupt at any moment. Control your emotions, wait for precise setups, and you’ll gain the edge.

Fed Set to Cut 50bps: Gold Gains as the Bullish Wave Forms Again📌 Macro Overview
US Treasury Secretary Bessent gives the green light for a potential 50-basis-point rate cut by the Fed in September.
July CPI remains soft → USD weakens, bond yields fall, boosting gold’s bullish outlook.
Gold briefly touched $3,370/oz, closing at $3,355.9/oz (+0.24%).
Gains capped as US equities continue to break records and geopolitical tensions ease.
Market focus now shifts to PPI data, jobless claims, and the anticipated Trump–Putin meeting for the next directional cues.
🧐 Technical Outlook – MMFLOW Analysis
The bullish recovery wave is clearly re-emerging after a corrective phase, with price hunting liquidity zones left behind in the recent retracement.
Preferred strategy: Trade around key liquidity levels or continuation zones for SELL opportunities; BUY entries will be taken earlier to catch the recovery wave within the current price channel.
Price Structure & Observation Zones:
Short-term uptrend channel intact, primary support at 3336 – 3334 (Liquidity – OBS BUY Zone).
Major resistance at 3394 – 3396 (Liquidity Grab Zone + H1 Supply).
🎯 MMFLOW Trading Plan
🔹 BUY SCALP – Catch the recovery wave
Entry: 3336 – 3334
SL: 3330
TP: 3340 – 3345 – 3350 – 3355 – 3360 – 3365 – 3370 – 3380 – ???
🔹 SELL SCALP – Counter-trend at resistance
Entry: 3394 – 3396
SL: 3400
TP: 3390 – 3385 – 3380 – 3370 – 3360
📊 Key Levels
Resistance: 3365 – 3370 – 3395
Support: 3340 – 3336 – 3330
💡 MMFLOW Strategy Tip:
Wait for price to retest the 3336 – 3334 BUY ZONE for trend-following BUY positions.
Watch for liquidity absorption signals at 339x – a potential SELL reversal zone.
Gold Price Faces Key Resistance — Can Bulls Break $3,440?The XAU/USD (Gold vs. USD) 1-hour chart shows a strong bullish structure within an upward channel, supported by higher highs and a recent ATH (All-Time High) retest.
Resistance Zone: $3,410 – $3,440 is acting as a significant supply area. Price may face selling pressure here.
Support Levels: First support lies near $3,300 (supply zone), followed by the $3,225–$3,250 demand zone.
Trend: The price is respecting the upward trendline, but a break below could trigger a retest of the green supply zone.
Bullish Scenario: A breakout and close above $3,440 could lead to a continuation toward $3,475+.
Bearish Scenario: Rejection from the resistance zone with a break below $3,300 could push price toward the $3,225 support.
Overall, gold is currently in a bullish trend, but needs to overcome the $3,440 barrier for further upside momentum.

Elliott Wave Analysis – XAUUSD August 14, 2025Elliott Wave Analysis – XAUUSD August 14, 2025
1. Momentum Analysis
• D1 timeframe: Momentum is showing signs of reversal. Although price may not reverse immediately when the two momentum lines converge, this is a clear signal that the current selling pressure is weakening.
• H4 timeframe: Momentum is declining and has only formed 2 H4 candles since the reversal began. It will likely take another 2–3 H4 candles to enter the oversold zone and potentially reverse upward.
• H1 timeframe: Momentum is also falling, suggesting a likely downward move during the Asian session.
________________________________________
2. Wave Structure
• On H1, price is moving in a choppy manner, indicating a corrective phase that has nearly reached its target.
• However, the D1 momentum preparing to reverse upward creates two possible scenarios:
Scenario 1: D1 momentum reverses upward and confirms → The uptrend could last for 4–5 days, conflicting with the current scenario of a corrective wave B. In this case, we would have an alternative scenario of an initial diagonal wave 1 as shown in the right-hand chart.
Scenario 2: D1 momentum enters the oversold zone and stays there → A strong drop would be needed to confirm that the current price action is wave B.
________________________________________
3. Two Potential Price Scenarios
1. WXY corrective pattern → Target for wave Y is around 3381.
2. Initial diagonal wave 1 → Wave 2 could decline toward 3345 before wave 3 rises again. This scenario currently aligns better with the D1 momentum signal.
________________________________________
Conclusion: At present, there is a conflict between momentum signals and wave structure. Further observation is required to determine a clearer trading plan, so no trade recommendation for today.

Elliott Wave Analysis – XAUUSD (August 13, 2025)
1. Momentum
• D1 Timeframe: Momentum is about to enter the oversold zone. By the end of today, it is likely to be fully in oversold territory. This stage often leads to strong price movement – either a sharp decline or a bullish reversal.
• H4 Timeframe: Momentum is preparing to turn upward. We need to wait for the current H4 candle to close for confirmation. If confirmed, a recovery move is likely to occur today.
• H1 Timeframe: Momentum is currently tightening and approaching the overbought zone – a typical sign of sideways price action. This explains why, despite the high probability of a recovery, H1 does not yet provide a good entry signal.
________________________________________
2. Wave Structure
• RSI shows a bullish divergence between price and the indicator – a pattern often seen in wave 3 or wave 5. This supports the view that wave 5 (black) has completed around the 3333 level.
• With a complete 5-wave structure, wave A (red) of the ABC (red) correction may already be in place.
• A recovery in wave B (red) is expected, which aligns with H4 momentum preparing to turn upward. Wave B typically forms a 3-wave corrective structure, where price moves in a choppy, overlapping manner rather than trending strongly.
• Wave B target zones:
1. 3371
2. 3381
These two levels are close to each other, so they can be treated as one combined zone. The plan is to take the first target as the base level while extending the SL to cover the second target. If price approaches these levels, it’s best to watch real-time price action before entering a trade.
• Alternative scenario: If wave 5 (black) is not yet complete, the 3323 zone remains a good Buy opportunity (as per the previous analysis).
________________________________________
3. Trading Plan
Sell Setup:
• Entry Zone: 3371 – 3373
• SL: 3385
• TP1: 3358
• TP2: 3331
• TP3: 3323
Buy Setup:
• Entry Zone: 3323 – 3321
• SL: 3313
• TP1: 3331
• TP2: 3357
• TP3: 3371
2. Wave Structure
• RSI shows a bullish divergence, often seen in wave 3 or 5, suggesting wave 5 (black) may have completed around 3333.
• Wave A (red) of the ABC cycle may be complete; wave B (red) is expected to recover in a 3-wave, choppy pattern.
• Wave B target zone: 3371–3381 (treated as one zone; monitor price action before entry).
• Alternative scenario: If wave 5 (black) is not yet complete, 3323 remains a potential Buy zone.

GOLD SURGES AFTER CPI – TARGETING 337x BEFORE SELL-OFF? MMFLOW TECHNICAL OUTLOOK
📌 Market Overview
Following the CPI release, gold reacted with strong buying momentum (FOMO BUY), pushing prices swiftly from the 333x area up to 335x.
The main driver here is the BUY side taking advantage of remaining liquidity gaps above, aiming to break through the critical 3358 resistance – the first major barrier before reaching 337x, a key equilibrium zone that previously acted as a strong price-holding area for SELL orders.
Current structure indicates:
Short-term trend: Bullish, but approaching key distribution levels.
Liquidity Hunt: A decisive break above 3358 with strong volume could trigger a rapid move towards 337x, activating SELL volume from pending limit orders.
Macro context: No major news events today, with expected daily range ~35–40 points, increasing the chance of range-bound traps before a breakout.
🧐 Technical Outlook – MMFLOW View
Market Structure: Gold has formed a Higher Low around 333x and is now testing short-term resistance.
Key Levels & Liquidity Zones:
Liquidity BUY ZONE at 3338–3336 has reacted well, confirming BUYers are still defending this zone.
Supply Zone / CP Zone at 3375–3377 aligns with an H1 Order Block, holding a high concentration of pending SELL orders.
Volume Flow: Increasing volume as price approaches resistance suggests a potential “last push” before a reversal.
🎯 MMFLOW Trading Plan
🔹 BUY SCALP – Following the main trend
Entry: 3338 – 3336
SL: 3332
TP: 3342 – 3346 – 3350 – 3355 – 3360 – 3370 – 3380
🔹 SELL SCALP – At the distribution zone
Entry: 3375 – 3377
SL: 3382
TP: 3370 – 3365 – 3360 – 3355 – 3350 – 3340
📊 Key Technical Levels
Resistance: 3358 – 3365 – 3376
Support: 3342 – 3337 – 3330 – 3310
💡 MMFLOW Insight: With the current setup, the optimal strategy is to wait for a BUY opportunity near early support (334x) to ride the short-term bullish momentum, then watch for price reaction at 337x to catch potential SELL entries once top-side liquidity is swept.

PROACHING LIQUIDITY ZONE – WAITING FOR CPI TO DECIDE NEXT MOVE📌 MARKET RECAP
Gold kicked off the week with a sharp $50 drop, breaking through key trendlines and nearby support zones.
The selling pressure came from:
Profit-taking after the recent strong rally.
USD strength expectations ahead of CPI data (forecast ~0.1% better than the previous reading).
Geopolitical factor: Ukraine–Russia ceasefire talks moving towards a conclusion, fueling risk-off sentiment.
🧐 WHAT’S NEXT?
If CPI beats expectations → USD strengthens → Gold could drop further into the Liquidity Zone 333x – 330x.
If CPI disappoints → USD weakens → Gold may quickly bounce back toward key level 337x (previous breakdown zone) for a retest before deciding direction.
🎯 MMFLOW GAME PLAN
1️⃣ BUY SCALP
📌 Entry: 3331 – 3329
📌 SL: 3325
📌 TP: 3335 – 3340 – 3345 – 3350 – 3360 – 3370 – 3380
2️⃣ BUY ZONE
📌 Entry: 3310 – 3308
📌 SL: 3304
📌 TP: 3314 – 3318 – 3322 – 3326 – 3330 – 3335 – 3340 – 3350 – 3360 – ???
3️⃣ SELL SCALP
📌 Entry: 3363 – 3365
📌 SL: 3370
📌 TP: 3360 – 3356 – 3352 – 3348 – 3344 – 3340
4️⃣ SELL ZONE
📌 Entry: 3376 – 3378
📌 SL: 3382
📌 TP: 3372 – 3368 – 3364 – 3360 – 3355 – 3350 – 3340
⚠️ RISK NOTE
CPI is the market’s dice roll – even a small deviation could trigger massive stop hunts.
Always watch the KeyLevels marked on the chart before entering trades.
Elliott Wave Analysis – XAUUSD August 12, 2025
1. Momentum Analysis
• D1 Timeframe: Momentum is declining → the downtrend remains intact. It may take another 2–3 daily candles for price to reach the oversold zone and potentially reverse.
• H4 Timeframe: Momentum is rising → from now until the U.S. session, price may either retrace upwards or move sideways.
• H1 Timeframe: Momentum is preparing to turn down → a minor pullback could occur in the short term, so this move should be monitored.
________________________________________
2. Elliott Wave Structure
• The green wave structure in the form of an ending diagonal may have been completed. This could mean that Wave 5 or Wave C (black) has formed.
• Personally, I do not want to see the Green 5-Wave Structure end with an ending diagonal at this stage because:
o If this is an impulsive uptrend structure, we are only at Wave 1 of the larger degree.
o An ending diagonal in Wave 5 (black) indicates weak buying pressure, which is not ideal when price hasn’t broken the previous high to confirm a new trend → increasing the probability that this is a corrective wave.
• Looking at the current downward wave structure, I tentatively label it as five black waves 1-2-3-4-5. The current slight rebound is expected to be Wave 4, which could take the form of either a Flat or Triangle.
• Wave 4 targets:
1. 3358
2. 3364
• If price breaks 3381, the current 1-2-3-4-5 bearish count will be invalidated (Wave 4 would overlap Wave 1). In that case, the structure could turn into a corrective ABC or a new 5-wave advance.
• With a Wave 4 target at 3364, the projected Wave 5 target would be 3323.
________________________________________
3. Combining Momentum & Wave Structure
• D1 downtrend → supports the scenario of another drop, forming Wave 5.
• H4 rising + H1 declining → could indicate Wave 4 forming as a triangle, with the key signal being that the current drop does not break 3342.
o If 3342 breaks, Wave 5 may already be in play, targeting 3323.
• Since H4 momentum is still rising, there remains a chance that price breaks above 3381, which would require a full recount—possibly turning into an ABC correction or a 5-wave rally.
________________________________________
4. Trading Plan
• If Wave 4 forms as a triangle → the 3358 area is a good sell zone, or wait for a breakout below 3342.
• Limit Sell Order:
o Entry: 3364 – 3366
o SL: 3374
o TP1: 3342
o TP2: 3333
o TP3: 3323

XAU/USD Bullish Bounce from Demand Zone !Gold (XAU/USD) on the 4H chart is showing a potential bullish reversal setup. Price has pulled back into a Fair Value Gap (FVG) and high supply/demand zone near 3,329–3,315, aligning with the 0.382–0.5 Fibonacci retracement.
Key Points:
Support Zone: 3,329–3,315 (demand + FVG).
Bullish Rejection Expected: Price may bounce from this zone, targeting upper resistance levels.
Upside Targets:
TP1: 3,356
TP2: 3,375
TP3: 3,440–3,459 (major resistance)
Invalidation: A daily close below 3,315 could open room for deeper downside toward 3,278–3,245.
Indicators: EMA(9) and Ichimoku showing potential for trend resumption if price closes above 3,362.
Overall, the chart suggests a buy setup on bullish confirmation, aiming for the 3,375–3,459 zone.

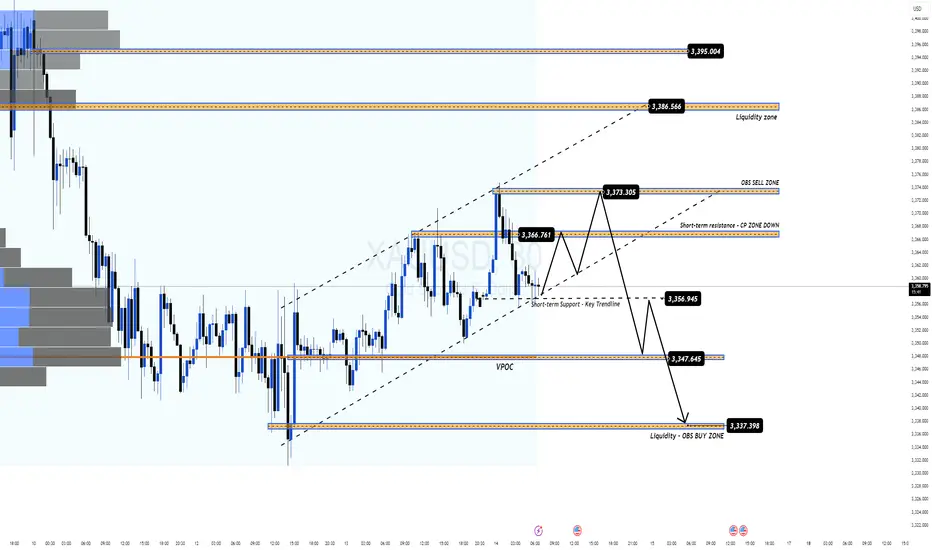
Awaiting the BreakDown or a Snap Back to Resistance?XAUUSD – Game of Patience: Awaiting the BreakDown or a Snap Back to Resistance? | MMFlow Trading
1. Market Context
The week opened with a sharp sell-off in Gold — driven by profit-taking and stop-loss hunting on late-week FOMO BUY positions.
Buying momentum is fading, while sellers are lurking at the ascending channel’s support.
Price is currently reacting at KeyLevel 336x–337x, with H1 candles showing lower wicks → signs of indecision.
2. Technical Outlook
Overall structure: Still within an H1-H4 uptrend channel, but BUY momentum is weakening.
No clear SELL confirmation yet → need a BreakDown from the channel to confirm seller dominance.
Scenario 1: Break the channel → target 335x & 333x zones.
Scenario 2: No break → price may rebound to retest 339x – 340x – 342x resistance levels.
3. Fundamental & Macro View
This week brings major USD economic data: CPI & PPI.
Forecasts lean positive for USD, which could increase downward pressure on Gold.
However, expect false breakouts before/after news releases — risk management is key.
4. MMFlow Trading Plan
BUY SCALP
Entry: 3353 – 3351
SL: 3345
TP: 3358 – 3362 – 3366 – 3370 – 3375 – 3380
BUY ZONE
Entry: 3332 – 3330
SL: 3325
TP: 3336 – 3340 – 3345 – 3350 – 3360 – 3370 – 3380
SELL SCALP
Entry: 3394 – 3396
SL: 3400
TP: 3390 – 3385 – 3380 – 3370 – 3360
SELL ZONE
Entry: 3425 – 3427
SL: 3430
TP: 3420 – 3415 – 3410 – 3405 – 3400 – 3390 – 3380
5. Risk Management
Avoid FOMO — wait for clear candle confirmations before entering.
Reduce position size ahead of CPI/PPI events.
Focus on pre-defined key levels, avoid trading in noise zones.

Elliott Wave Analysis – XAUUSD August 10, 2025
1. Momentum Analysis
• D1 Timeframe: Daily momentum lines are still overlapping without a confirmed reversal signal. This suggests that a potential reversal could occur within the next 1–2 days.
• H4 Timeframe: Momentum is currently rising, indicating that prices may continue to climb during the Asian session tomorrow.
• H1 Timeframe: Momentum is also rising, further supporting the expectation of continued upside movement in the Asian session.
________________________________________
2. Wave Structure Analysis
• Current price action is overlapping, reinforcing the hypothesis that an ending diagonal is forming.
• This structure could either be part of Wave 5 (black) or Wave C (black). In both cases, it represents an ending diagonal 12345, with the market currently in Wave 4 (blue).
• Confirmation signal: A sharp and steep decline will confirm the ending diagonal — as mentioned in previous plans, this has not yet occurred.
• The projected completion targets are at 3412 or 3419. If the price breaks 3439, it will likely confirm the completion of Wave 5 (black).
________________________________________
3. Possible Scenarios
• Scenario 1: If the current move is part of a 5-wave 12345 black structure, once Wave 5 completes, a corrective ABC 3-wave decline could follow, targeting 3333.
• Scenario 2: If the current move is part of a 3-wave ABC black structure, once Wave C completes, a 5-wave bearish sequence could unfold, breaking below 3315.
________________________________________
4. Combining Momentum & Wave Structure
Given that:
• D1 is in the overbought zone and could reverse within 1–2 days,
• H4 momentum is rising, and
• Price is likely in Wave 4 (blue),
→ On Monday, we may see one more upward push to complete Wave 5 (blue). This presents a potential SELL opportunity in the 3412–3419 target area.
Since this is a wide zone, it’s best to wait for clear reversal signals before entering.
________________________________________
5. Trade Plan
SELL ZONE 1: 3411 – 3413
• SL: 3416
• TP1: 3400
• TP2: 3381
• TP3: 3342
SELL ZONE 2: 3419 – 3421
• SL: 3429
• TP1: 3400
• TP2: 3381
• TP3: 3342

XAUUSD Weekly Plan Final Bullish Push Before a Liquidity Sweep?XAUUSD Weekly Plan – Final Bullish Push Before a Liquidity Sweep?
1. Market Context
Last week, Gold kept moving inside the H2–H4 bullish channel, pushing into the FVG High Zone and approaching the major resistance at 3426–3428 (OBS Sell Zone).
Momentum is fading – candles are compressing, and volume is dropping – signaling potential distribution.
2. Macro Outlook (High-Impact USD Data Ahead)
CPI – Aug 12 → Primary driver.
PPI – Aug 14 → Usually a leading signal for CPI.
Unemployment Claims – Aug 14 → Short-term impact.
Expectations:
CPI & PPI likely better than previous month → USD strength → Gold correction (liquidity sweep to the downside).
Weaker-than-expected CPI/PPI → USD weakness → Gold could spike for one last bullish leg before reversing.
3. Technical Overview
H2 bullish channel top aligns with FVG High Zone → big players’ sell limit & profit-taking area.
Main scenario: Test 3426–3428 → Bearish reaction → Channel breakdown → Retest 3395–3400 (VPOC) → Drop toward liquidity pools below.
4. Key Levels
SELL Zone: 3426 – 3428
SL: 3434
TP: 3420 → 3415 → 3410 → 3405 → 3400 → 3395 → 3390 → 3380 → 3370 → 3360
BUY Zone: 3330 – 3328
SL: 3322
TP: 3335 → 3340 → 3350 → 3360 → 3370 → 3380
5. Trading Plan
🔹 Primary SELL Setup:
Wait for price to reach 3426–3428 with H1/H2 bearish candle confirmation.
Take profits gradually at each downside target.
🔹 Counter-trend BUY:
Enter only if price sweeps liquidity into 3330–3328 with strong bullish reaction.
6. Trader’s Notes
Gold may still push $30–$40 higher early next week before hitting OBS Sell Zone.
Expect large SELL volume once in this zone (profit-taking + top-picking by big players).
This should be a short-term correction, not a full trend reversal.
Best to SELL from highs and hold after a confirmed channel breakdown.
7. Risk Note
High-impact week → Possible false breaks before/after CPI & PPI.
Avoid oversized positions during news releases.
A break & hold above 3434 with strong volume invalidates SELL scenario → wait for new structure.
📌 Summary:
Bias: SELL from 3426–3428 → Target liquidity pools down to 3360.
Backup Plan: BUY from 3330–3328 if liquidity grab confirmed.
Manage risk tightly, especially during high-volatility events.
— MMFlow Trading

Elliott Wave Analysis – XAUUSD August 8, 2025📊
🔍 Momentum
• D1 Timeframe: Daily momentum is currently turning down, limiting the potential for a long-term rally in the current bullish wave. This also suggests that the top may already have formed around the 3,409 level.
• H4 Timeframe: Momentum is still declining and needs about one more H4 candle to reverse upward. For now, the downward move is likely to continue, so caution is advised.
• H1 Timeframe: Showing early signs of a short-term bearish reversal. This decline is important and will be analyzed further after the wave structure review.
🌀 Wave Structure
The current price action suggests a potential Ending Diagonal formation. Once completed, this pattern is typically followed by a sharp and sudden drop.
So far, no sharp decline has occurred, meaning the ending diagonal may not be finished yet. The ideal completion zones for Wave 5 are around 3412 or 3419.
Ending diagonals tend to develop in a complex manner, so a safer approach is to enter trades after price breaks below the lower boundary of the diagonal.
👉 Additional Scenario: If H1 momentum reverses downward and price breaks below 3381, it is likely to drop toward 3371. This area could be considered for a Buy setup.
Conversely, if price does not break below 3381 and instead rises toward 3412, it may indicate that Wave 5 is completing at that level.
📈 Trading Plan
• SELL Zone 1: 3412 – 3414
o SL: 3417
o TP1: 3393
o TP2: 3372
• SELL Zone 2: 3419 – 3421
o SL: 3429
o TP1: 3395
o TP2: 3372

Buy Gold 3385OMG 😳 Yesterday All Target hit 🎯🤟
Nect buy now 3378,3380,3383,3385
Target 🎯 3390,3392,3399,3405,3420
So please don't sell gold
Only Buy side Active

Elliott Wave Analysis – XAUUSD | August 7, 2025📊
________________________________________
🔍 Momentum Analysis:
• D1 Timeframe: Daily momentum is turning bearish, signaling that a medium-term downtrend may have already started and could last until mid-next week.
• H4 Timeframe: Momentum is rising, but the slope of the two momentum lines is relatively flat → indicating weak bullish strength. We should closely watch the overhead resistance zones.
• H1 Timeframe: Momentum has entered the overbought zone → a short-term reversal is likely, especially near the 3386 level.
________________________________________
🌀 Elliott Wave Structure:
• Based on the bearish momentum shift on the D1 chart, we expect the market is entering an ABC corrective pattern (in green).
• Currently:
o Wave A is completed.
o Wave B is in progress.
• Since Wave A appears to be a 3-wave structure, Wave B may unfold as a flat correction. In that case, potential target zones for Wave B are:
o 3385
o or 3395 → these are the key resistance levels to monitor.
• Within Wave B (green), we observe an internal 3-wave ABC structure (in red), where:
o Wave C (red) may reach:
3386
or extend toward 3395
→ In alignment with the D1 momentum signal, 3386 is considered a potential entry point for a short position.
________________________________________
📈 Trade Plan:
• SELL Zone: 3386 – 3389
• Stop Loss: 3397
• Take Profits:
o TP1: 3370
o TP2: 3353
o TP3: 3333

Elliott Wave Analysis – XAUUSD August 6, 2025📊
________________________________________
🔍 Momentum Analysis
• D1 Timeframe:
Daily momentum is showing signs of a potential bearish reversal. However, we need to wait for today’s candle to close to confirm the signal. While waiting for confirmation, price may still experience a minor upward move on lower timeframes, but the current bullish momentum is weak and unlikely to extend far.
• H4 Timeframe:
Momentum is also preparing to reverse. We need to observe the current H4 candle for confirmation. Notably, the reversal signal is forming just below the overbought zone, suggesting there may be one more upward push before a potential decline.
• H1 Timeframe:
Momentum is approaching the oversold zone. It may take 1–2 more bearish candles before a short-term bullish rebound occurs.
________________________________________
🌀 Elliott Wave Structure Update
Yesterday’s bullish move was disappointing — instead of pushing directly to the 3402 or 3419 target zones to complete Wave 5, price only broke slightly above 3385 before reversing. This behavior complicates wave analysis by introducing conflicting possibilities.
We currently consider two main scenarios:
Scenario 1: Wave 5 is not yet complete
• Given that D1 momentum is preparing to reverse downward, it’s unlikely that the current move is Wave 1 of Wave 5. A more likely scenario is that Wave 3 of Wave 5 has completed and price is currently in Wave 4.
• The current corrective structure has stopped at the 0.382 Fibonacci level. As long as price remains above 3370 (the 0.5 Fib level), this strengthens the case for a Wave 4 retracement before another leg up in Wave 5.
• Since bullish strength appears limited, we now focus on two main target zones for Wave 5: 3395 and 3402, instead of the previous high at 3419.
Scenario 2: Full 5-wave structure is complete – now in correction
• If the 5-wave pattern has already finished, the current decline marks the beginning of a corrective phase.
• With current momentum conditions, this is still a viable scenario. However, due to the remaining upside possibility, we recommend waiting for today’s D1 candle to confirm momentum before taking any trade.
________________________________________
📌 Trade Plan
For experienced traders:
• Wait for price to reach the 3395–3402 zones.
• Look for reversal signals in those areas to enter short positions.
Suggested trade plan for newer traders:
• Sell Zone: 3395 – 3398
• Stop Loss: 3408
• Take Profits:
o TP1: 3385
o TP2: 3370
o TP3: 3349
________________________________________
✅ Note:
This trade plan should be reassessed after today’s D1 candle closes for confirmation of the momentum shift.

Elliott Wave Analysis – XAUUSD, August 5, 2025📊
________________________________________
🔍 Momentum Analysis:
• D1 Timeframe:
Momentum has entered the overbought zone. As anticipated in previous plans, we've seen four consecutive bullish days, and the current overbought condition signals that bullish momentum is weakening.
• H4 Timeframe:
Momentum is reversing downward → We expect a potential pullback today, at least until the US session.
• H1 Timeframe:
Momentum is also turning down → This supports the possibility of a short-term pullback on the H1 chart.
________________________________________
🌀 Wave Structure Analysis:
Currently, there are two key scenarios to consider:
✅ Scenario 1 – ABC Correction Structure (black labels):
• If this is a C wave completing an ABC correction, the current bullish move is likely over.
• In this case, price may break below the 3315 support zone, resuming the medium-term bearish trend.
✅ Scenario 2 – Impulse Wave 12345 (black labels):
• If this is wave 5 of a 5-wave impulse, the uptrend may not be complete yet.
• Currently, wave 5 has reached its first target at 3385, however, we must still watch for an extended target around 3402.
• Notably, wave 4 took the form of a triangle. According to Elliott Wave theory, when wave 4 is a triangle, wave 5 typically travels a distance equal to the triangle’s maximum height → This makes 3385 a highly probable peak area.
________________________________________
🧭 Trade Plan (Reference Only):
🔹 Sell Setup #1 – Near Potential Wave 5 Top:
• Sell Zone: 3375 – 3378
• Stop Loss: 3387
• TP1: 3365
• TP2: 3344
• TP3: 3333
🔹 Sell Setup #2 – In Case of Extended Wave 5:
• Sell Zone: 3400 – 3402
• Stop Loss: 3410
• TP1: 3385
• TP2: 3368
• TP3: 3333

Elliott Wave Analysis – XAUUSD, August 3, 2025📊
🔍 Momentum Analysis:
D1 Timeframe: Momentum continues to rise strongly. It's expected that the price will keep rising for at least two more trading days, pushing the momentum indicator into the overbought territory, reinforcing the current bullish trend.
H4 Timeframe: Momentum is showing signs of a potential bearish reversal, indicating a possible corrective pullback during Monday’s trading session.
H1 Timeframe: Momentum is strongly bullish, especially evident from the powerful upward move on Friday. Price may continue rising at the open of the Asian session, potentially creating a Gap. However, caution is advised, as this Gap could signal exhaustion.
📌 Wave Pattern Analysis:
Given Friday's strong price action, the primary scenario currently favors wave 3 within the 5-wave bullish structure (12345 – black). However, we cannot entirely eliminate the possibility that this is wave C within an ABC corrective structure (black).
Presently, the price is forming a smaller 5-wave bullish structure (blue), likely in the final wave 5. Attention should be paid to two critical target zones:
🎯 Blue Wave 5 Targets:
• Target 1: 3368
• Target 2: 3385
⚠️ Next Scenario:
Upon completing the blue 5-wave structure, a corrective move downward will occur.
• If the correction does not break below 3315, the larger 5-wave bullish structure (12345 – black) is confirmed, and the price will continue upward to complete black wave 5.
• If the correction breaks below 3315, the structure shifts to an ABC corrective pattern (black), increasing the likelihood of a deeper decline to complete the larger corrective wave C (red).
🧩 Combining Momentum & Wave Analysis:
• D1 momentum strongly supports the continuation of the bullish trend.
• H4 momentum forecasts a short-term bearish correction on Monday, aligning with the formation of wave 4 correction.
• H1 momentum suggests the possibility of a Gap at Monday's Asian session open, marking the beginning of a corrective pullback as momentum reverses.
🎯 Short-term Trading Plan:
We will trade the current blue wave 5 with the following limit order plan:
✅ Sell Limit Zone: 3385 – 3387
⛔️ Stop Loss (SL): 3399
🎯 Take Profit (TP1): 3368
🎯 Take Profit (TP2): 3355
📌 Note:
The detailed trading plan for capturing the larger wave 4 correction (black) will be updated once sufficient evidence confirms the completion of the blue wave 5.
Happy trading, everyone! 🚀

Gold (XAU/USD) in Symmetrical Triangle – Short‑Term Squeeze,Price Structure & Technical Setup
Gold is consolidating within a symmetrical triangle, showing lower highs and higher lows—a classic precursor to breakout in either direction
Fxglory Ltd
+5
TradingView
+5
Babypips.com
+5
TradingView
+2
Babypips.com
+2
TradingView
+2
.
Trendlines converge tightly around $3,326–$3,334, hinting at imminent directional acceleration
Investopedia
+4
TradingView
+4
TradingView
+4
.
🎯 Key Levels & Targets
Scenario Trigger Confirm Area Targets Stop Loss
Bullish Breakout above $3,344–$3,350 $3,369 → $3,396 → $3,422–$3,550 ~$3,340
Bearish Breakdown below ~$3,326–$3,320 $3,320 → $3,300 → $3,297 → $3,255 ~$3,335–$3,340
A breakout above $3,344–$3,350 validated with volume may drive prices toward $3,400+, with extended targets up to $3,550 or higher in bullish conditions
Traders Union
Time Price Research
.
A drop below $3,326–$3,320 risks further decline, targeting $3,300, $3,297, and eventually $3,255 if breakdown momentum builds .
📉 Market Context & Drivers
U.S. dollar strength, easing safe-haven demand, and optimistic trade sentiment are constraining gold’s upside unless breakout forces emerge .
Key upcoming catalysts: FOMC guidance, U.S. macro data (GDP, inflation), and geopolitical developments—their tone could tip the bias direction .
⚙️ Trade Rules & Risk Management
Wait for a confirmed breakout or breakdown—do not trade mid-range.
Confirm break with at least one close outside the triangle and rising volume .
Position sizing: Risk 1–2% per trade, adjust stop-loss to price structure ($8–$15 depending on volatility).
Take profits in stages: scale out at minor milestones (first targets), trail stop for extended targets.
Avoid chasing price within the middle of the triangle—risk/reward is unfavorable.
🧠 Why This Plan?
Follows textbook symmetrical triangle trading methodology: entry on breakout, stop beyond pattern opposite side, projection based on triangle height .
Aligns with broader outlook: bearish unless convincing upside breakout appears, consistent with analyst consensus hedging current bull exhaustion and wait‑and‑see on policy signals .
✅ Summary
Gold is coiling inside a tight triangle range near $3,326–$3,334, with breakout potential identified to either side:
Bullish breakout over $3,344–$3,350 targets up to $3,550 or beyond.
Bearish breakdown under $3,326–$3,320 risks slide towards $3,300–$3,255.
Wait for confirmation, apply disciplined risk controls, and let volume validate the move.

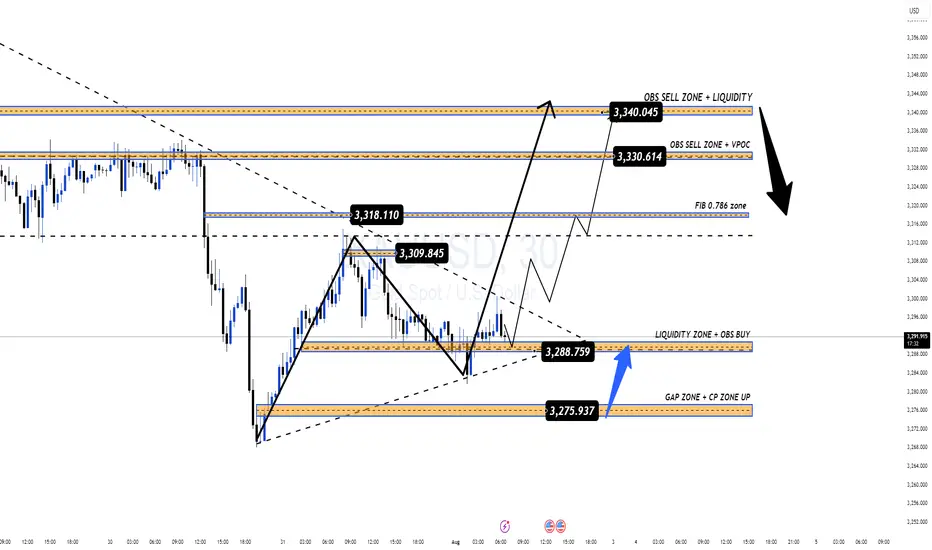
GOLD NFP Plan – Waiting for Breakout & Riding the Bullish Wave – GOLD NFP Plan – Waiting for Breakout & Riding the Bullish Wave
Gold is currently trading inside a large sideways triangle pattern, with price compressing toward the apex. However, based on recent candle structure and yesterday’s reaction at the key level, there’s strong momentum building for bullish continuation—likely forming a Wave 3 breakout if price can decisively break above the current descending trendline.
🔎 Technical Breakdown:
✅ BUY ZONE: 3276 – 3274 (confluence of CP ZONE + GAP + OBS BUY from yesterday)
📈 Price already reacted with +160 PIPS profit from this zone, confirming buyer control
⛓️ Descending trendline is compressing price – a breakout above it could unleash strong bullish momentum
🔄 SELL ZONE: 3339 – 3341 marked by OBS SELL ZONE + liquidity layer
📰 Fundamental Focus:
Today is Nonfarm Payrolls (NFP) day. With current forecasts pointing toward weaker-than-expected U.S. job data, the dollar could face pressure—creating the perfect scenario for gold to spike higher on BUY-side FOMO.
📌 Trade Plan:
🎯 BUY ZONE: 3276 – 3274
❌ Stop Loss: 3270
🎯 Take Profits:
3280 – 3284 – 3290 – 3294 – 3300 – 3305 – 3310 – 3320 – 3330 – 3340 – 3350
⚠️ SELL ZONE (counter-trend): 3339 – 3341
❌ Stop Loss: 3345
🎯 Take Profits:
3335 – 3330 – 3325 – 3320 – 3315 – 3310 – 3305 – 3300
📌 Key Notes:
Favor BUY setups in line with the trend—focus on reaction zones outlined on the chart.
If NFP data is bearish for the dollar, wait for strong confluences before entering any SELL, and avoid shorting prematurely against bullish momentum.