Elliott Wave Analysis – XAUUSD August 1, 2025📊
________________________________________
🔍 Momentum Analysis:
• D1 Timeframe:
Momentum has reversed to the upside. Based on this signal, we expect a bullish trend to continue for the next 5 daily candles — likely until mid-next week.
• H4 Timeframe:
Momentum has also turned upward → This suggests that from now until the U.S. session, the price will likely continue to rise or consolidate with an upward bias.
• H1 Timeframe:
Momentum is currently turning down → We anticipate a short-term corrective move. We should wait for H1 to enter the oversold zone and give a bullish reversal signal before looking for long entries.
________________________________________
🌀 Wave Structure Analysis:
The current wave structure remains complex and lacks clear confirmation. Thus, the current wave labeling should be considered provisional. However, the wave count has not been invalidated, and D1 momentum supports a bullish outlook — so we continue to maintain our wave structure bias.
Important Note:
Wave (C) in red appears relatively short. This leaves open the possibility that the price may continue lower, targeting:
• ⚠️ 3246
• ⚠️ 3200
→ This scenario will be triggered if price breaks below 3268, especially given today's Nonfarm Payroll (NFP) report.
________________________________________
📌 Two Possible Wave Scenarios:
1. Scenario 1: Black Waves 1 – 2 – 3
o Wave 1 (black) is complete.
o We are now in Wave 2 (black) → Preparing for Wave 3.
o Wave 3 tends to be strong, impulsive, and sharp with large candle bodies.
o Target: 3351
2. Scenario 2: Black ABC Correction
o The market is currently in Wave B (black).
o Potential target for Wave C: 3328
________________________________________
🛡 Support Zones & Trade Strategy:
• Support Zone 1: 3290 → A good area for potential buying, but we must wait for H1 to enter the oversold region and show a bullish reversal.
• Support Zone 2: 3275 → Deeper buy zone if the price corrects further.
________________________________________
💡 Trade Plan:
📍 Option 1 – Buy Limit:
• Buy Zone: 3290 – 3289
• Stop Loss: 3280
• Take Profit 1: 3309
• Take Profit 2: 3328
• Take Profit 3: 3351
📍 Option 2 – Buy Limit:
• Buy Zone: 3275 – 3273
• Stop Loss: 3265
• Take Profit 1: 3309
• Take Profit 2: 3328
• Take Profit 3: 3351
________________________________________
📎 Notes:
• Experienced traders should wait for clear confirmation signals on H1 before entering trades.
• New traders may consider using limit orders in the proposed buy zones.
Xauusdupdates

Liquidity Sweep Complete – Bullish Continuation Ahead?GOLD ANALYSIS 31/07: Liquidity Sweep Complete – Bullish Continuation Ahead?
🔍 Technical View | XAUUSD | 2H Chart | End of Month Setup
Gold has completed a final liquidity sweep around the 3269–3271 zone and has since rebounded strongly, in line with the prevailing bullish structure. The sharp drop yesterday during the FOMC rate statement appears to have served its purpose: grabbing final sell-side liquidity before preparing for the next bullish leg.
As of now, price is reacting at the 3295 zone, which coincides with the M30 CP (Change of Character) Zone, showing minor intraday retracement. A healthy pullback is likely before a potential bullish breakout of the descending trendline that has been holding price down over recent sessions.
🔵 BUY Strategy: Trend Continuation Setup
We’re watching for potential re-entries on a dip toward the OBS Buy Zone (3286–3284), created after the recent bullish move. This could be the last opportunity to catch the next impulsive leg higher.
Buy Zone: 3286–3284
Stop Loss: 3278
Targets: 3290 → 3294 → 3298 → 3304 → 3308 → 3312 → 3316 → 3320 → 3330 → ???
Key breakout confirmation will come if price closes strongly above 3313 (first key resistance). If broken, this opens the door toward the VPOC zone at 3328–3330, where a high-volume cluster awaits.
🔴 SELL Strategy: Short-Term Rejection Levels
Shorts only become favorable below the VPOC Sell Zone (3328–3330). If price closes above this area, bearish pressure is likely to fade, and bulls will dominate the next leg.
Sell Zone: 3328–3330
Stop Loss: 3335
Targets: 3324 → 3320 → 3315 → 3310 → 3305 → 3300
⚠️ Important: Selling inside a bullish breakout structure is high-risk unless the market gives clear rejection at major supply. Always wait for price action confirmation.
🕯️ Monthly Candle Insight (July Close)
Today marks the final trading day of July. Notably, the last two monthly candles have closed as Doji with long wicks, reflecting deep indecision and ongoing liquidity grabs. This aligns with the upcoming interest rate cut discussions at the next FOMC, which could ignite significant volatility.
📌 Summary:
Liquidity sweep at 3269–3271 is likely complete.
Price now retracing after strong bullish rebound from OBS Buy Zone.
Watch for confirmation above 3313, then 3328–3330 for breakout toward higher zones (335x–337x).
End-of-month close + macro narrative (FOMC) will be crucial to confirm direction.
💡 Pro Tip: Avoid entering late into reactive moves. Wait for retests of clean liquidity zones and use volume-based confluences to validate bias.
📲 Follow us @MMFlowTrading for real-time updates, macro analysis, and market structure insights on gold & major pairs.

GOLD: Is This a Bottom or the Calm Before the Storm?🌐 Fundamental & Macro Landscape
The recent US–EU trade and defense pact has temporarily reduced gold’s appeal as a safe haven.
The US Dollar and stock markets remain strong thanks to positive macroeconomic data.
Current sentiment is risk-on, which typically shifts capital away from metals and into riskier assets.
But the real volatility could come later this week:
📅 High-Impact Events to Watch:
US ADP Employment Report
FOMC Statement + Nonfarm Payrolls (NFP)
These will likely decide whether gold resumes its uptrend or continues sliding lower.
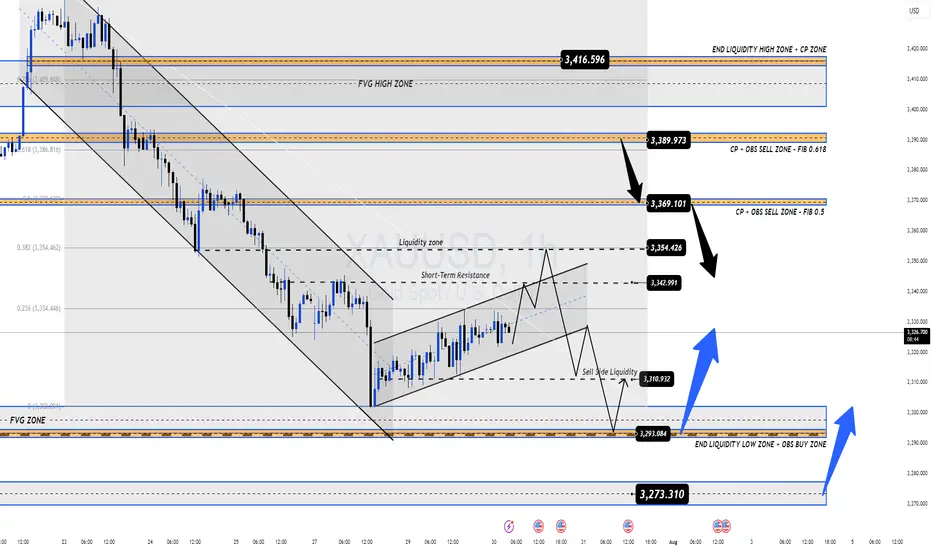
📊 Technical Outlook (H1–H4)
Gold is currently trading within a parallel bullish channel after rebounding from local lows.
However, price is now approaching a key resistance zone around 3342, where we might see either a breakout or a rejection, depending on market sentiment during the upcoming data releases.
🔍 Key Price Zones
🔺 Short-Term Resistance: 3342
🔺 Major Supply Zone: 3369–3388 (Order Block + FVG + Fib 0.5–0.618)
🔻 High-Liquidity Demand Area: 3293–3290
🔻 Deep Demand Zone (FVG): 3275–3273
🔺 Long-Term Resistance Target: 3416
📈 Trade Plan – Based on Price Reaction, Not Prediction
The best trades come from waiting for the right reaction at key zones. No chasing. No guessing.
✅ Scenario 1 – Buy the Dip (Scalp Setup)
Entry: 3293 – 3291
Stop Loss: 3286
Targets: 3296 → 3300 → 3304 → 3308 → 3312 → 3315 → 3320 → 3330
🟢 Works well in high-liquidity zones for quick short-term gains.
✅ Scenario 2 – Buy from Deeper Support (Swing Setup)
Entry: 3275 – 3273
Stop Loss: 3269
Targets: 3280 → 3284 → 3288 → 3292 → 3300 → 3305 → 3310 → 3320 → 3330
🟢 Great setup if price absorbs selling pressure and reverses from FVG demand.
❌ Scenario 3 – Short from Short-Term Resistance
Entry: 3340 – 3342
Stop Loss: 3346
Targets: 3335 → 3330 → 3325 → 3320 → 3310
🔴 Valid only if price fails to reclaim above 3342.
❌ Scenario 4 – Short from Major Supply Zone
Entry: 3369 – 3372
Stop Loss: 3376
Targets: 3365 → 3360 → 3355 → 3350 → 3345 → 3340 → 3330 → 3320
🔴 Higher risk – only act after confirmation (e.g., rejection wicks or bearish candle pattern).
⚠️ Risk Management Tips
Avoid entering right at London or New York opens – too much volatility and false breakouts.
Always wait for confirmation (candle rejection, pin bars, engulfing, etc.).
Use strict stop-loss rules – FOMC + NFP can spike price in both directions.
💡 Final Tips for Indian Traders
Trade with patience – the best setups often appear when others are panicking.
Respect your capital – don’t overleverage during high-volatility news events.
Focus on price action – not emotions or fixed bias.
📌 If you found this gold analysis helpful, feel free to drop your thoughts in the comments or follow for daily updates on XAU/USD.
Let’s grow and trade smarter, one setup at a time.
Namaste 🙏 | Trade safe, trade with clarity.
Elliott Wave Analysis – XAUUSD | July 30, 2025📊
🔍 Momentum Analysis
• D1 Timeframe: Momentum has started to reverse upward, but we need to wait for today’s daily candle to close for confirmation. Until then, there is still a risk of another short-term decline.
• H4 Timeframe: Momentum lines are clustering in the overbought zone, signaling a possible weakening of the current upward move. However, this signal alone is not enough to confirm that the uptrend has ended.
________________________________________
🌀 Wave Structure
• Price has reached the projected target for wave e, but there has been no strong bullish reaction. The recent candles are short-bodied and overlapping – typical of corrective structures. Also, this wave has lasted longer than previous corrective upswings, suggesting that the decline may not be over yet and the wave count needs to be reviewed.
Currently, we are facing two equally probable scenarios (50/50), but they suggest opposite outcomes:
➤ Scenario 1: Zigzag (5-3-5) Structure
• The current structure may represent only wave A of a larger zigzag.
• We are now in wave B, which tends to be complex and unpredictable, making it not ideal for wave-based trading.
• The red zones marked on the chart indicate potential target areas for wave B.
➤ Scenario 2: Completed 5-Wave Correction
• The downtrend may have completed at wave (e).
• The current upward movement could be wave 1 forming as a triangle – a potential start of a new bullish cycle.
• However, to confirm this scenario, price must hold above 3309. If it fails to do so and H4 momentum reverses downward, a new low is very likely.
________________________________________
📝 Trading Plan
Given the current market conditions, I only recommend short-term scalp trading based on the predefined support and resistance zones.
Avoid wave-based trading until the structure becomes clearer. Once clarity returns, I will provide an updated trading plan.

Elliott Wave Analysis – XAUUSD – July 28, 2025📊
________________________________________
🔍 Momentum Analysis:
• D1 Timeframe: Momentum has entered the oversold zone. This strongly suggests a potential bullish reversal today, which could lead to a rally or sideways movement lasting around 4–5 days.
• H4 Timeframe: Momentum is reversing upward. This indicates a likely bullish or sideways move in the short term, at least until momentum reaches the overbought zone (estimated within the next 2 H4 candles).
• H1 Timeframe: Momentum is currently overbought, so we may first see a pullback or sideways movement until a clearer reversal signal appears.
________________________________________
🌀 Wave Structure Analysis:
• On the H4 chart, as noted in previous plans, the assumption that price is forming a contracting triangle (abcde) is still valid. Price is currently in the final leg (wave e) of this triangle.
• On the H1 chart, we can observe a channel structure, within which an abc corrective pattern is unfolding.
• The lower boundary of the triangle (marked by the green trendline) combined with support zones will be critical areas to monitor for the end of wave e.
🔺 Note: Wave e does not necessarily end precisely at the triangle boundary – it can slightly overshoot. Hence, we’ll rely on smaller wave structures to identify potential reversal zones.
________________________________________
🎯 Key Price Zones to Watch:
• Target 1: 3329
• Target 2: 3309
• Target 3: 3290
________________________________________
🔎 Lower Timeframe Structure (M10):
From the current price action (as shown in the chart), we can see a leading diagonal triangle structure forming. This is a pattern commonly seen in wave 1. If this pattern is confirmed, a sharp and steep decline toward the 3329 zone is likely.
________________________________________
⚖️ Combining Momentum & Wave Structure:
• D1: Signals a potential reversal → favors Buy setups.
• H4: Momentum is rising, but price hasn’t confirmed a new bullish trend → need to stay alert and tighten Stop Loss.
• H1: Overbought + possible leading diagonal → Expecting a pullback for wave 2 toward 3329 → this would be the optimal Buy zone.
________________________________________
🧭 Trade Plan:
• For experienced traders:
→ Wait for price to reach key levels and watch for reversal signals before entering.
• For beginners:
→ Use the following Limit Buy setup:
✅ Setup 1:
• Buy zone: 3330 – 3328
• Stop Loss: 3320
• TP1: 3351
• TP2: 3370
• TP3: 3385
✅ Setup 2:
• Buy zone: 3310 – 3308
• Stop Loss: 3300
• TP1: 3328
• TP2: 3351
• TP3: 3370

GOLD: Is This Just the Calm Before a Bigger Move? – GOLD: Is This Just the Calm Before a Bigger Move?
Gold has dropped nearly $50 in the last 4 sessions — showing strong bearish momentum, but is the downside exhausted? Or is this just a pause before continuation?
🔍 Macro Drivers:
Recent US–EU defense and trade agreements have weighed on gold's safe-haven appeal.
Strong US economic data has pushed USD and equities higher, redirecting flows out of precious metals.
Market sentiment is leaning short-term risk-on, which is bearish for gold – but key technical levels are approaching.
📊 Technical Context – H12 Structure:
Price broke below 3,342 key support, retested it and rejected — validating short-term supply zone.
Price is now consolidating between Sell-side liquidity (3,301–3,292) and deeper FVG/OBS zone around 3,270.
Above, multiple sell zones align at Fib 0.5–0.618 retracement with order blocks and fair value gaps.
🔧 Trade Scenarios (Plan for Reaction – Not Prediction):
🟢 BUY SCALP – Quick bounce off demand zone
Entry: 3,292 – 3,290
SL: 3,285
TPs: 3,296 → 3,300 → 3,305 → 3,310 → 3,315 → 3,320 → 3,325 → 3,330
📍Low-risk intraday bounce play from liquidity pocket
🟢 BUY SWING – Deeper test of FVG/OBS zone
Entry: 3,272 – 3,270
SL: 3,265
TPs: 3,276 → 3,280 → 3,284 → 3,288 → 3,292 → 3,294 → 3,300 → open
📍Higher R:R setup if price sweeps final liquidity zone
🔴 SELL SCALP – Rejection from short-term resistance
Entry: 3,340 – 3,342
SL: 3,346
TPs: 3,335 → 3,330 → 3,325 → 3,320 → 3,310
📍Reaction-based trade if price fails to reclaim the zone
🔴 SELL SWING – Deeper pullback into macro zone
Entry: 3,370 – 3,372
SL: 3,376
TPs: 3,365 → 3,360 → 3,355 → 3,350 → 3,345 → 3,340 → 3,330 → 3,320
📍FVG + CP zone overlap with strong OB; ideal for patient sellers
⚠️ Risk Notes:
Watch for false breakouts/liquidity traps near session opens.
Wait for price confirmation; reaction over prediction.
Maintain disciplined risk management – this is a volatile area.
🧭 I’ll be tracking price behavior at these zones closely.
If this approach to mapping price action resonates with you —
Feel free to stay connected or share your bias in the comments.

XAU/USD 1H – Range Consolidation Below Ichimoku Cloud. Chart Review & Technical Insight
1. Ichimoku Cloud & Overall Structure
Price is below the Ichimoku Cloud, with the cloud ahead sloping downward—indicative of bearish short‑term momentum and resistance overhead as long as the cloud holds above price.
The Kijun-sen (blue) line is above the Tenkan-sen (red), reinforcing the bearish bias on this timeframe.
2. Price Action & Key Zones
A support zone around 3,327–3,330 USD/oz is visible, underpinned by multiple rejection taps and price consolidation (“$$$” zone). A clean break below could open the path toward the 3,320’s or lower imbalance region.
On the upside, resistance lies near 3,339–3,340, backed by the cloud’s lower boundary and the Kijun-sen level.
The highlighted green rectangle appears to signal a potential bullish breakout target zone toward 3,365–3,392, contingent on recovery above the cloud.
3. Momentum & Trade Considerations
Momentum is weak, with price moving sideways inside a low‑volatility rectangle on diminishing volume and few directional impulses.
Possible ABC corrective structure is forming as marked, suggesting price may oscillate sideways or continue correcting within established bounds.
A bullish scenario would require clearing the Ichimoku Cloud and resistance at 3,340–3,360 USD.
Conversely, a bearish breakdown below ~3,327 could confirm continuation deeper into the 3,320s or toward the next significant demand zone near 3,300 USD.
✅ Summary
Bias: Slightly bearish to neutral until price can clear the Ichimoku Cloud.
Key Levels to Watch:
Support: 3,327–3,330 (immediate), then 3,320–3,300.
Resistance: 3,339–3,365, cloud top near 3,365, further target zone 3,392.
Scenarios:
Bullish breakout: Close above cloud → potential rally toward 3,365–3,392.
Bearish breakdown: Close below 3,327 → deeper correction toward 3,320 and lower imbalance areas.

Gold (XAU/USD): Supply Zone Rejection & Bearish Breakdown Chart Breakdown:
Supply zone rejection: Gold revisited the “supply zone” (light green/grey area) and failed to break above — a classic signal of seller dominance.
Uptrend invalidated: A sharp rise (steep black trendline) ended with a peak marked by the green arrow, followed by a decisive breakdown.
Ichimoku Cloud test: Prices slipped through the Ichimoku components, reinforcing the shift to bearish sentiment.
Potential targets: The red/green risk‑reward box highlights a short position, targeting ~3,347 then ~3,318 levels (blue labels) as initial support zones.
Strong supply base: The extensive grey zone below marks a "stronger supply zone" — this could cap any modest bounce and keep the downtrend intact.
🔍 Interpretation:
Bias: Bearish — sellers have taken control after a failed breakout.
Strategy: Short on rallies toward the mid‑green/red box (~3,373–3,380), targeting ~3,347 first and then ~3,319. Watch for support at the strong supply region (~3,292) for potential reversal or consolidation.
Risk management: Keep stop above the red zone—above recent highs (~3,380+) to limit risk.
🚀 In a nutshell: After failing to break supply and losing its short‑term uptrend, gold appears poised for a pullback. The next key levels to watch are ~3,347 and ~3,319—where buyers might step back in, or the downtrend continues toward the deeper supply base.

Gold Tests Key Support – Time to Buy or More Downside Ahead?🌐 Market Overview
Gold remains under pressure following yesterday’s sharp sell-off, driven largely by macro-political tensions and profit-taking at recent highs.
🔻 On July 24th, former President Trump made a surprise visit to the Federal Reserve headquarters — a move interpreted by markets as subtle pressure on the Fed to start cutting rates.
While the Fed hasn’t signaled any immediate easing, short-term bond yields have dipped slightly — reflecting growing rate-cut expectations.
The US Dollar, however, remains firm, showing markets are still hesitant to fully price in a Fed pivot after strong economic data.
📊 Technical Outlook
On the H2 timeframe, gold continues to trade within a broader bullish structure, but price action is now hovering near a critical Keylevel at 3338, aligned with a rising trendline and VPOC zone. A breakdown below this level could open the door for deeper liquidity grabs toward 332x and even 329x.
Volatility is high, and price is moving in wide ranges — ideal conditions for short-term scalp setups.
🎯 Trading Strategy
🔽 Scalp Buy (Short-Term Bounce Opportunity)
Entry: 3338 – 3336
Stop Loss: 3332
Targets: 3342 – 3346 – 3350 – 3354 – 3360 – 3365 – 3370 – 3380
🟢 Buy Zone (Deeper Pullback, Reversal Potential)
Entry: 3312 – 3310
Stop Loss: 3305
Targets: 3316 – 3320 – 3325 – 3330 – 3340 – 3350 – 3360 – 3370 – 3380
🔻 Sell Zone (If Price Retests Resistance)
Entry: 3374 – 3376
Stop Loss: 3380
Targets: 3370 – 3366 – 3360 – 3355 – 3350 – 3340 – 3330
🧭 Key Price Levels
Support: 3350 – 3338 – 3325 – 3310 – 3294
Resistance: 3374 – 3390 – 3400 – 3421
⚠️ Risk Management & Notes
As we head into the weekend, the market is prone to unexpected liquidity sweeps and sharp reversals.
Only consider short-term BUY positions for today. Avoid holding long-term buys until there's confirmation that the lower liquidity zones have been fully swept.
Strictly follow TP/SL discipline to protect capital — especially in volatile, low-news sessions like this.
💬 Enjoying these detailed trade plans?
📈 Follow the MMF TradingView channel for daily market updates, high-probability trade setups, and pro-level insights designed for serious traders.

Elliott Wave Analysis – XAUUSD July 25, 2025📊
________________________________________
🔍 Momentum Analysis
• D1 Timeframe: Momentum is declining. Based on the current pace, it’s likely that only 1–2 more daily candles are needed before momentum enters the oversold zone → suggesting one more potential downward leg.
• H4 Timeframe: Momentum is about to turn bearish, indicating we might see a sideways movement or a slight drop in the short term.
• H1 Timeframe: Momentum is currently falling. By the end of the current H1 candle, momentum will likely enter the oversold zone → potential for a bullish reversal soon.
________________________________________
🌀 Elliott Wave Structure
• A clear 5-wave Wave A has already formed with no irregular patterns, so I’m expecting Wave B (black) to unfold as a 3-wave structure.
• Within this black Wave B, price is now developing Wave B (blue), meaning Wave A (blue) has already completed. Looking at the lower timeframe, I can identify a 5-wave structure → suggesting a zigzag correction in the form of 5-3-5 for black Wave B.
• Target for Wave B (blue): The 3360 area – this is a support level and also aligns with Fibonacci confluence, making it a strong candidate for the end of Wave B (blue) and a potential reversal zone.
• If price respects the 3360 level, then projected targets for Wave C (blue) would be around 3386 or 3402.
• However, if price breaks below 3351, the current wave count becomes invalid. In that case, we will shift to an alternate scenario and look for a buy opportunity near the lower edge of the triangle (c)-(e) and other confluence support zones.
________________________________________
🔄 Combining Momentum & Wave Structure
• D1 momentum shows weakening in this downward move, and the lower boundary of the triangle (c)-(e) is a prime area to look for the end of Wave e.
• Ideally, we want to see:
o A short-term bounce upward aligning with H1 momentum reversal to complete Wave C (blue).
o Then a confluence with H4 momentum turning bearish, indicating possible trend continuation or reversal.
________________________________________
📌 Trade Plan
• For experienced traders:
Watch closely around 3385 and 3401 for reversal signals to enter Sell positions.
• For beginners, I recommend the following limit setup:
o SELL ZONE: 3399 – 3402
o SL: 3501
o TP1: 3374
o TP2: 3351

Elliott Wave Analysis – XAUUSD July 24, 2025📊
________________________________________
🔍 Momentum Analysis:
• D1 Timeframe: Momentum is currently in a downtrend, indicating that the dominant trend in the short term (at least until early next week) is likely to remain bearish or sideways.
• H4 Timeframe: Momentum has entered the oversold zone and is showing signs of a potential bullish reversal. This suggests that a corrective upward move may occur today.
• H1 Timeframe: Momentum is still declining and is expected to need around two more H1 candles before entering the oversold zone, implying that one more leg down may occur before a recovery begins.
________________________________________
🌀 Elliott Wave Structure Update:
Yesterday’s expectation of a breakout above the resistance zone at 3453 to confirm the start of a new bullish trend did not materialize. Instead, price dropped to the 3374 region, opening up two primary scenarios:
✅ Scenario 1: The correction is still unfolding
• Wave (d) in blue appears to be complete.
• The current leg is likely wave (e), the final leg in a contracting triangle correction.
• In this case, the lower boundary of the triangle and overlapping support zones will serve as key levels to watch for the completion of wave (e).
✅ Scenario 2: Wave 1 of a new bullish trend has completed
• The current decline is wave 2 in a new bullish impulsive sequence.
• The objective here is to identify the bottom of wave 2 to prepare for a potential buy entry into wave 3, which is expected to be stronger and longer than wave 1.
📌 Key difference between the two scenarios:
• Scenario 1 → Wave (e) completes, followed by wave 1 of wave 5.
• Scenario 2 → Wave 2 completes, followed by a powerful wave 3 of wave 5.
________________________________________
🧩 Current Wave Structure:
• A five-wave bearish structure is currently unfolding on the chart.
• According to Elliott Wave Theory, corrective patterns do not typically form five-wave structures.
• Therefore, this is likely wave A in a zigzag (5-3-5) formation.
• Possible targets for wave 5 within wave A:
o Target 1: 3374 – current reaction zone.
o Target 2: 3360 – next significant support level.
________________________________________
📌 Combining Wave Structure with Momentum:
The D1 momentum is firmly bearish, reinforcing the view that the market is undergoing a larger ABC correction.
On the H4 timeframe, momentum is oversold and showing early signs of reversal, aligning with the potential formation of wave B — typically a weak, sideways upward move. The likely resistance zone for the end of wave B lies between 3401 and 3410.
Meanwhile, H1 momentum is still falling and not yet in the oversold zone, suggesting there may be one more move down to complete wave 5. The ideal target for this final leg is around 3360.
Summary:
• D1 bearish → confirms ongoing major correction.
• H4 oversold → supports a potential weak wave B.
• H1 still declining → wave 5 may complete around 3360 before a recovery begins.
________________________________________
💼 Suggested Trading Plan:
For traders with limited experience or those not yet confident in reading live market signals, a Buy Limit strategy at clear support levels is recommended:
• Buy Zone: 3362 – 3360
• Stop Loss: 3352
• Take Profit:
o TP1: 3384
o TP2: 3400
🎯 For experienced traders, it is advised to observe price action at the target support zones and look for real-time reversal signals to optimize entry timing.

Watch for a Potential Pullback (July 23) - GOLD PLAN XAUUSD – Is the Bullish Wave Losing Steam? Watch for a Potential Pullback (July 23)
📰 Market Overview
Gold made a strong rally last night, fueled by:
Fed Chair Powell’s speech, which avoided any controversial remarks or hints about stepping down.
Rising geopolitical tensions between the US, China, and the EU, with August 1st looming as a critical deadline.
A dip in US bond yields and the dollar, giving risk assets — including gold — room to rise.
While there’s no major news on today’s calendar, the market could remain volatile within a wide range.
📉 Technical Outlook
Gold seems to be wrapping up its bullish wave as seen on the H4 chart. On the H1 and M30 timeframes, reversal candles are starting to form — an early signal of potential correction.
The short-term support at 3412 – 3410 is the key zone to watch. If that breaks and we get a clean breakdown from the trendline, a deeper pullback could be underway — possibly heading toward liquidity zones lower down.
Two main Fair Value Gap (FVG) areas on H1 are also in play as high-probability liquidity targets.
Down at the 335x region, we have a confluence of FIB 0.618 retracement and historical buying interest — making it an attractive zone for long setups if the price reacts properly.
📌 Trade Setups for Today
🔻 SELL ZONE: 3469 – 3471
Stop Loss: 3475
Take Profits: 3465, 3460, 3455, 3450, 3445, 3440, 3430, 3420
→ Ideal zone to look for bearish setups after a retest.
🔸 BUY SCALP: 3385 – 3383
Stop Loss: 3379
Take Profits: 3390, 3394, 3398, 3402, 3406, 3410
→ Short-term buy for intraday traders catching the pullback.
🔹 LONG-TERM BUY ZONE: 3356 – 3354
Stop Loss: 3350
Take Profits: 3360, 3364, 3368, 3372, 3376, 3380, 3390, 3400
→ This is the deep liquidity zone worth watching for high-conviction buy entries.
⚠️ Risk Reminder
With fewer news catalysts, gold may trap traders by sweeping liquidity in both directions.
Stick to your plan, follow TP/SL strictly, and avoid chasing price. Let the market come to you.
💬 Sometimes the best trade is waiting for the right level. Stay patient, stay sharp.

GOLD - PULLBACKS LIKELY BEFORE CONTINUED UPSIDE - UPTREND INTACTSymbol - XAUUSD
CMP - 3369.50
Gold has been advancing steadily since the start of the trading session, moving toward the 3374 area of interest. Following a breakout above prior consolidation resistance, the metal may now be poised to retest this breakout level before continuing its upward trajectory.
The current rally is supported by heightened trade related risks and a softening US dollar. After briefly declining to 3310, gold resumed its upward momentum, with a key objective at the 3368 resistance level. The recovery is underpinned by ongoing uncertainty surrounding Trump’s trade policy, market anticipation ahead of Powell’s upcoming speech, and broader geopolitical tensions - including trade disputes with the EU, political instability in Japan, and recent criticism of the Federal Reserve from the White House. These factors have prompted a temporary flight to safety, benefiting gold.
From a technical perspective, gold is in a post-breakout realization phase following the consolidation breakout. However, resistance at 3368 has capped further gains for now, and a near-term pullback remains possible. The 3350–3355 support zone is currently in focus. Sustained bullish control above this level could reignite upward momentum and reestablish the breakout continuation.
Key Resistance Levels: 3368, 3374
Key Support Levels: 3345, 3332
The broader market bias remains bullish, bolstered by dollar weakness and persistent risk aversion. Market participants are closely monitoring developments involving Trump and remarks from Powell. Should Powell signal a dovish shift - such as a potential rate cut announcement (e.g. during tomorrow’s 12:30 GMT statement) - gold may extend its gains.

Elliott Wave Analysis – XAUUSD July 23, 2025
________________________________________
🔍 Momentum Analysis:
• D1 Timeframe: Daily momentum is showing signs of a potential bearish reversal. We need to wait for today’s daily candle to close to confirm this. It signals that the bullish momentum is weakening.
• H4 Timeframe: Momentum is turning down. It may take around 2 more bearish H4 candles to push momentum into the oversold zone → suggesting continued downside movement today.
• H1 Timeframe: Momentum is already in the oversold zone and the indicators are “clinging” together → implying possible continued minor declines or sideways movement.
________________________________________
🌀 Elliott Wave Structure Update:
• On the H1 chart, a 5-wave structure (yellow) is unfolding.
o Wave 3 (yellow) appears completed, supported by a clear 5-wave internal structure in blue.
o The market is currently in Wave 4 (yellow) – a corrective move.
🔸 Potential Wave 4 (yellow) targets:
• Target zone 1: Around 3412
• Target zone 2: Around 3402
📌 Once Wave 4 (yellow) completes, we anticipate the market will form Wave 5 (yellow).
🔸 Projected Wave 5 (yellow) targets:
• TP1: 3461
• TP2: 3492 (in case of an extension)
________________________________________
🔄 Combining Momentum & Wave Structure:
• The potential bearish reversal in D1 momentum suggests the current bullish trend may be nearing its end – consistent with Wave 5 being the final push before a broader correction.
• H4 and H1 momentum support the ongoing correction in Wave 4.
✅ Wave 4 typically takes the form of a zigzag, flat, or triangle → Wait for a strong bullish H1 candle to confirm the end of Wave 4 and initiate a buy entry.
________________________________________
📊 Trade Plan:
🟩 Buy Zone 1:
• BUY ZONE: 3414 – 3412
• SL: 3407
• TP1: 3439
• TP2: 3461
• TP3: 3492
🟩 Buy Zone 2:
• BUY ZONE: 3403 – 3401
• SL: 3393
• TP1: 3439
• TP2: 3461
• TP3: 3492

Elliott Wave Analysis – XAUUSD | July 22, 2025
🔍 Momentum Overview
• D1 timeframe: Momentum has entered the overbought zone, signaling a potential reversal within the next 1–2 sessions. That said, the current bullish leg may still extend — it’s important to wait for tomorrow’s D1 candle close for confirmation. Entering overbought territory is a warning that upside momentum is weakening.
• H4 timeframe: Momentum is currently declining. Unless a strong bullish candle closes above 3391 to trigger a reversal, the price is likely to continue moving sideways or downward today.
• H1 timeframe: There are signs of a bullish reversal. If the price holds above 3385 and posts a strong breakout candle above 3391, it could present a short-term buying opportunity.
🌀 Elliott Wave Structure Update
• Price is consolidating within the 3390 – 3402 range — a key zone to monitor closely.
• The 3380 level is a critical threshold, aligned with the 0.382 Fibonacci retracement of Wave (3). A daily close below this level would raise the possibility that the move is part of a correction rather than Wave 4.
• A flat ABC correction is currently unfolding, with the 1.618 extension of Wave A already reached at 3385.
• If price breaks below 3360, it would overlap with the previous Wave 1, invalidating the current impulsive wave count. In that case, we should consider the potential continuation of a larger abcde triangle correction.
🔗 Momentum & Wave Structure Combined
• H1 is showing early signs of a bullish reversal, but H4 momentum remains bearish. Without a strong breakout candle above 3391, price is likely to drift sideways or lower until H4 reaches the oversold zone.
• Conservative approach: Wait for H4 to enter oversold territory before considering any long positions.
• The ideal buy setup would be a bullish reaction from the 3382 – 3380 zone.
📈 Trade Setup
• Buy Zone: 3382 – 3380
• Stop Loss: 3372
• Take Profit 1: 3402
• Take Profit 2: 3412
• Take Profit 3: 3428

XAUUSD DAILY UPDATES DATE:22/07/2025XAUUSD retest between 0.5 and 0.618 i can buy this level... otherwise i will wait for confirmation bullish candle at 1hr and 4hr trendline.
This is just an idea not a financial advise, Please manage proper risk management

Elliott Wave Analysis – XAUUSD | July 21, 2025🔍 Momentum Analysis
- D1 Timeframe: Momentum is currently rising → the dominant trend over the next 3 days is likely to remain bullish.
- H4 Timeframe: Momentum is approaching the oversold area → just one more bearish H4 candle could complete the entry into oversold territory.
- H1 Timeframe: Momentum is about to reverse downward → suggesting a short-term corrective pullback in the current session.
🌀 Elliott Wave Structure Update
On the H4 chart, price continues to consolidate within a corrective triangle structure. According to our previous plan, price approached the 3358 zone, and we expect:
- Wave 1 (black) may have completed at the 3358 high.
- Currently, Wave 2 (black) is likely unfolding:
+ Wave A appears to have completed.
+ The current upward leg is part of Wave B.
+ A final drop in Wave C is expected, with two key target zones:
- Target 1: 3342
- Target 2: 3332
🔎 Combining Momentum & Wave Structure
- If price breaks above 3358, we want to see a sharp, impulsive, and steep rally to confirm the beginning of Wave 3.
- If price movement remains choppy or overlapping, the market is likely still in a corrective phase.
- Key resistance zone to monitor: 3390–3402 – a clean breakout above this range would significantly strengthen the Wave 3 scenario.
📌 Trade Plan
1️⃣ BUY Setup #1
Entry Zone: 3343 – 3341
Stop Loss: 3337
Take Profit 1: 3358
Take Profit 2: 3390
2️⃣ BUY Setup #2
Entry Zone: 3333 – 3331
Stop Loss: 3323
Take Profit 1: 3358
Take Profit 2: 3390
📎 Note: Prioritize entries that come with clear confirmation signals from price action and momentum. Avoid buying during choppy or indecisive market conditions.

Elliott Wave Analysis – XAUUSD July 18, 2025
🔍 Momentum Analysis
D1 Timeframe: Momentum is showing signs of a bullish reversal. While we need to wait for today's D1 candle to close for confirmation, it's likely that yesterday’s upward move marks Wave 1, signaling the beginning of a new bullish trend.
H4 Timeframe: Momentum is preparing for a bearish reversal → suggesting a potential corrective pullback, likely forming Wave 2.
H1 Timeframe: Momentum is about to reverse upward → supporting the expectation of a short-term bullish move during the current session.
🌀 Elliott Wave Structure Update
On the H4 chart, the abcde triangle correction structure remains largely unchanged.
However, a strong H4 bullish candle appeared yesterday, indicating unusual market behavior that deserves attention.
There are two main scenarios:
Wave 1 (black) has already completed, and the market is now entering Wave 2 correction.
Alternatively, the current movement could be Wave 4 within Wave 1 (black).
🔎 Combining Momentum & Wave Structure
With D1 momentum signaling a potential uptrend lasting the next 4–5 days, it suggests that Wave e (blue) may have completed.
This opens the door for an impulsive 5-wave advance. Specifically:
If H1 continues its bullish reversal, the current move could be Wave 5 of Wave 1 (black), targeting the 3358 level.
Afterwards, a retracement toward the 3330–3323 zone would form Wave 2 (black).
Alternatively, price might drop directly to 3330–3323, implying Wave 1 has already finished and the current move is Wave 2.
🎯 => Both scenarios converge at the 3330–3323 price zone, making it a high-probability BUY ZONE.
🧭 Trade Plan
BUY ZONE: 3330 – 3327
Stop Loss: 3320
Take Profits:
TP1: 3342
TP2: 3358
TP3: 3402
📌 Note: Since this is a relatively wide entry zone, it's best to wait for price action confirmation at this level before entering.

Elliott Wave Analysis – XAUUSD July 17, 2025
🔍 Momentum Analysis
D1 timeframe: Momentum is still trending downward, but we’re starting to see signs of convergence between the indicator lines. Normally, we would expect another two daily candles to reach the oversold zone and trigger a potential reversal. However, with the current narrowing pattern, we cannot rule out the possibility of an earlier reversal. Today’s daily close will be crucial for confirmation.
H4 timeframe: Momentum is clearly declining, suggesting that the market may either continue downwards or consolidate sideways throughout the day.
🌀 Elliott Wave Structure
On the H4 chart, price action is compressing tightly at the end of a symmetrical triangle pattern – a classic setup in Elliott Wave theory. Notably, this final point of compression coincides with the POC (Point of Control), indicating a key price level where high volume has accumulated.
Wave W (in black) follows a 3-wave structure. Yesterday, price surged to the beginning of wave W and then sharply reversed, forming the basis for two potential scenarios:
Scenario 1 – WXY structure with current price completing wave Y within wave e (green):
+ Target 1: 3327
+ Target 2: 3303
Scenario 2 – Wave e (green) evolves into a triangle:
+ In this case, price may consolidate sideways above the 3327 zone.
🔗 Combining Wave and Momentum Analysis
Both D1 and H4 momentum indicators are still pointing downward. However, the price candles appear overlapping and lack clear directional strength – a common trait of compression near the triangle’s apex. With price sitting right on the POC, there’s a high chance of continued tightening before a breakout. At this stage, the recommended strategy is to wait for a strong bullish candle at one of the target zones before entering a BUY position.
📈 Trade Setup
✅ Scenario 1 – BUY at 3327 – 3326
+ Stop Loss: 3317
+ Take Profit 1: 3342
+ Take Profit 2: 3358
+ Take Profit 3: 3402
✅ Scenario 2 – BUY at 3305 – 3302
+ Stop Loss: 3295
+ Take Profit 1: 3327
+ Take Profit 2: 3358
+ Take Profit 3: 3402

Elliott Wave Analysis – XAUUSD July 16, 2025🔄 Momentum Analysis
D1 timeframe: Momentum is currently reversing to the downside, suggesting that the price may continue to decline or move sideways in the short term.
H4 timeframe: Momentum is rising, indicating that the current recovery may continue. The next resistance zones to watch are 3342 and 3358.
🌀 Elliott Wave Structure
At present, price action is being compressed within a contracting triangle corrective pattern, with its range narrowing further—signaling market consolidation. We should closely monitor for signs of a breakout that could end this correction.
Based on the current wave structure, it is expected that wave d (green) has completed, and the current downward move is likely part of wave e (green).
The trading strategy focuses on waiting for the price to approach the lower boundary of the triangle—drawn from the low of wave a to the low of wave c—looking for confluent support areas near this trendline to identify a potential BUY opportunity.
🎯 Target & Trade Plan
BUY ZONE: 3303 – 3300
Stop Loss (SL): 3290
Take Profits (TP):
- TP1: 3327
- TP2: 3358
- TP3: 3402

Elliott Wave Analysis – XAUUSD | July 15, 2025
🟢 Trade Update
The BUY order at the 3342 – 3340 zone was triggered at 3341. As of now, price has moved up by 140 pips, and the market is still following the planned scenario from the previous analysis.
📊 Momentum Analysis
D1 Timeframe: Momentum is in the overbought zone, and indicator lines are showing signs of crossing — a warning signal of a potential reversal on the daily chart.
H4 Timeframe: After a 6-candle decline from 3377 to 3342, H4 momentum has reversed upward. With 2 bullish candles already formed, we expect another 3–5 bullish candles, aiming toward the 3390 zone.
🌀 Elliott Wave Update
Price action is currently moving toward the end of the abcde contracting triangle. We are monitoring two potential scenarios:
Scenario 1 – Ongoing Triangle Correction
If price returns to the lower boundary of the triangle, it is likely forming wave e, which would present a buy opportunity for the final leg of the triangle.
Scenario 2 – 5-Wave Impulse Extension
The current structure shows a 5-wave impulsive move, with wave 4 completed and wave 5 now beginning.
The projected target for wave 5 aligns with the resistance zone at 3398 – 3402.
After completing wave 5, the market could enter a corrective phase, consistent with the idea that wave d ends at this resistance.
🔔 If the price breaks above 3402, it would likely confirm that the abcde correction is complete and that a new impulsive bullish wave has started.
🎯 Trade Plan
📍SELL Zone: 3396 – 3398
⛔️ Stop Loss: 3406
🎯 TP1: 3376
🎯 TP2: 3327
📍BUY Zone: 3295 – 3293
⛔️ Stop Loss: 3285
🎯 TP1: 3327
🎯 TP2: 3365
🎯 TP3: 3402
✅ Note: Prioritize entries only after confirmation from price action and momentum at key levels.

GOLD SHOWING A GOOD UP MOVE WITH 1:8 RISK REWARD GOLD SHOWING A GOOD UP MOVE WITH 1:8 RISK REWARD
DUE TO THESE REASON
A. its following a rectangle pattern that stocked the market
which preventing the market to move any one direction now it trying to break the strong resistant lable
B. after the break of this rectangle it will boost the market potential for break
C. also its resisting from a strong neckline the neckline also got weeker ald the price is ready to break in the outer region
all of these reason are indicating the same thing its ready for breakout BREAKOUT trading are follws good risk reward
please dont use more than one percentage of your capitalfollow risk reward and tradeing rules
that will help you to to become a bettertrader
thank you

Elliott Wave Analysis – XAUUSD July 10, 2025🌀 Elliott Wave Structure
On the H4 timeframe, price has returned to test the upper boundary of the converging triangle – currently acting as dynamic resistance. Based on the current wave count, wave e (purple) may have completed at the 3279 low, and price is potentially starting a breakout move.
👉 A confirmed breakout above the triangle would validate the end of the abcde correction and mark the beginning of a new upward trend.
🔋 Momentum Analysis
D1 timeframe: As forecasted yesterday, momentum is entering oversold territory and showing early signs of a reversal. This suggests that an upward trend could dominate over the next 5 days.
H4 timeframe: The two momentum lines are sticking together, indicating a weakening upward drive. A minor pullback may be needed before the next leg up. Key nearby resistance levels to watch are 3330 and 3342.
🎯 Key Price Levels & Validation Zones
The following support zones are crucial for identifying potential entries:
Support Zone 1: 3306 – 3308
Support Zone 2: 3294 – 3297
‼️ Important: A break below 3294 would invalidate the current wave structure, and a new count would be required.
📌 Trade Plan
Scenario 1 – Buy at higher support:
Buy Zone: 3308 – 3306
SL: 3303
TP1: 3342
TP2: 3366
TP3: 3390
Scenario 2 – Buy at deeper support (if stronger correction occurs):
Buy Zone: 3297 – 3294
SL: 3287
TP1: 3342
TP2: 3366
TP3: 3390
Scenario 3 – Safer option (breakout confirmation):
Wait for a breakout above the triangle, then enter on the retest (around 3325–3330)
SL: Based on structure formed during the retest
TP range: 3366 – 3390
📌 Preferred strategy: Wait for H4 to reach oversold or wait for a confirmed breakout and retest to enter safely in alignment with the new uptrend.
