Elliott Wave Analysis – XAUUSD (June 12, 2025)📊 Elliott Wave Analysis – XAUUSD (June 12, 2025)
🌀 Wave Structure
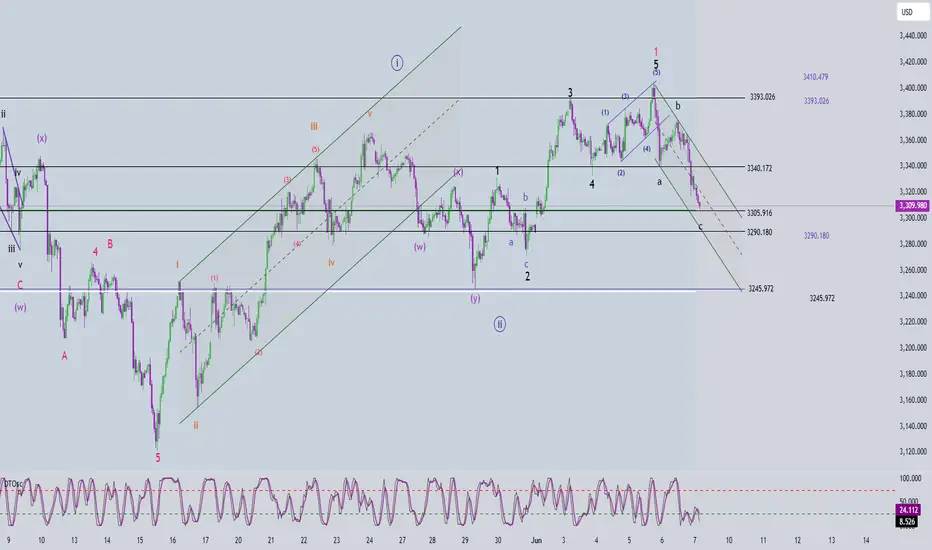
According to yesterday's plan, the green abc corrective wave likely completed around the 3293 level. The subsequent bullish move is considered Wave 1 in a triangle form, and last night’s news helped Wave 5 hit the target, yielding over 200 pips in profit.
After that, price corrected in a black abc structure. Although the CPI release printed a sharp H1 wick (alongside overlapping waves supporting sellers), the price reversed sharply to the upside — further reinforcing the idea that the correction phase has ended.
Currently, price is testing the previous green Wave b high at 3375.954. A break and close above this level could strengthen the bullish wave scenario. If Wave 1 is indeed a triangle, Wave 3 may extend strongly, with a potential upside target near 3428.
In the short term, price may be forming Wave 1 within Wave 3, and we are watching two key zones:
3358 – 3355
3390 – 3393
⚠️ If price breaks and closes below 3350, the current wave count will be invalidated, and we will shift to a deeper corrective scenario. I will update accordingly to avoid confusion.
🔍 Momentum Outlook
D1: Momentum is rising, supporting the continuation of Wave 3 into next week.
H4: Still bullish; needs 1–2 more candles to reach the overbought zone.
H1: Currently overbought → possible pullback if price hits the 3390–3393 resistance.
⏱️ Bearish momentum reversal at 3390–3393 → confluence zone for a SELL setup
⏱️ Bullish momentum reversal at 3358–3355 → confluence zone for a BUY setup
🎯 Trading Plan
BUY ZONE: 3358 – 3355
SL: 3348
TP1: 3375 | TP2: 3389
SELL ZONE: 3390 – 3393
SL: 3404
TP1: 3375 | TP2: 3358
Xauusdupdates

Elliott Wave Analysis – XAUUSD | June 11, 2025
📊 Elliott Wave Structure – H1 Outlook
Currently, the price is moving sideways within a channel.
🔍 Wave Structure Analysis:
Looking closely at the wave patterns inside this price channel, we can clearly see a series of 3-wave structures developing. Previously, we also observed what appears to be an abc corrective pattern (black), which leads me to suspect that we might be forming a triangle structure as the beginning of a wave 1 sequence (12345 in green).
It seems that wave 4 has already completed, and the price is currently in wave 5. Structurally, wave 5 may take the form of a 3-wave move, and the key confirmation we want to see is a break above 3349, signaling that the top of wave 5 is in place.
☄️ Typically, once a wave 1 triangle completes, the market tends to enter a sharp and deep corrective move in the form of a zigzag.
🎯 Potential Target Zones (based on Fibonacci + Volume Profile):
Target Zone 1: 3352 – 3355
Target Zone 2: 3362 – 3365
⚡ Momentum Outlook:
D1 Momentum: Starting to turn bullish, suggesting the current correction is nearing completion and we could see a bullish week ahead.
H4 Momentum: Currently in overbought territory – I expect the price to break above 3349, followed by a momentum reversal on H4, which could provide a great SELL opportunity at the upper targets.
H1 Momentum: Is about to turn bearish, indicating a short-term pullback may occur. If this correction fails to break below 3315, the price may be completing wave 5 as a 3-wave structure. In that case, we should wait for H1 momentum to turn bullish and then bearish again to confirm wave 5 completion.
📌 Trading Plan:
🔻 SELL Zone: 3352 – 3355
⛔ Stop Loss: 3369
🎯 TP1: 3334
🎯 TP2: 3307

XAUUSD Bearish Rejection Setup Unfolding – June 11, 2025XAUUSD Bearish Rejection Setup Unfolding – June 11, 2025 🧠🔍
📊 Technical Breakdown:
🔴 Resistance Rejection Zone (Supply Area)
Price recently tested the $3,440 - $3,460 resistance zone, marked with red arrows. This zone previously acted as a strong supply area, leading to aggressive sell-offs.
📉 Bearish Rejection Candle
A rejection occurred near the same supply zone again, hinting at a potential double top or failure to break structure. Sellers seem to defend this area aggressively.
📍 Current Price: $3,338.6
Price is hovering below mid-range resistance at $3,396.5, indicating weakness after a failed breakout.
📉 Bearish Plan in Motion:
🔁 Scenario Highlighted:
Price might retest the $3,396.5 level (purple line) before resuming the downward move (illustrated by the blue and black arrows).
A breakdown below the $3,290.3 support zone will likely trigger further downside.
🎯 Target Levels:
1st Target: $3,290.3 – Key structural support. A close below this level will confirm the bearish momentum.
2nd Target: $3,207.0 – Final support area aligned with previous accumulation zone.
🛑 Invalidation Point:
A sustained breakout above $3,460 would invalidate the bearish bias and suggest continuation to the upside.
✅ Summary:
Bias: Bearish 📉
Strategy: Sell on pullback to $3,396.5 with stops above $3,460.
Targets: 🎯 $3,290.3 ➡️ $3,207.0
Watch for a strong bearish confirmation candle below $3,290.3 to load in shorts.
🔔 Stay alert for volume spikes and lower time-frame breakdowns to fine-tune entries! 💼📊

Elliott Wave Analysis – Trading Strategy Update | June 10, 2025
📊 Elliott Wave Analysis – Trading Strategy Update | June 10, 2025
Currently, the market is presenting multiple wave scenarios with nearly equal probabilities. To avoid noise and gain clarity, we are shifting our analysis to the H4 timeframe.
🔹 Key Price Zone
As highlighted in yesterday’s update, the 3340 level remains a critical resistance. Price failed to break above this level and has since pulled back to 3307.
🔹 Momentum & Volume Profile
- H4 Momentum: Just one more H4 candle and the momentum indicator will likely enter the oversold zone, suggesting that the bearish momentum is weakening.
- Volume Profile: Price is clearly reacting at the green POC zone, with no signs of a breakdown yet.
🧩 Two Main Scenarios:
Scenario 1: Wave 5 Continues Lower
Price is potentially forming wave 5, with:
🎯 Target 1: 3290
🎯 Target 2: 3279
✅ Confirmation: Break below 3294
⚠️ Note: This is the most obvious scenario, and in trading, what’s most obvious often requires the most caution.
Scenario 2: Correction Completed – Wave 3 Uptrend Forming
- The black ABC correction has likely completed.
- The recent upward move could be wave 1; the current pullback is wave 2.
- Wave 3 is expected next.
✅ Necessary Condition: Price breaks above 3340
✅ Sufficient Condition: Price breaks the top of wave b (black)
➡️ For this scenario, limit orders may not be effective — real-time confirmation will be required.
📉 Momentum Overview:
- D1 Timeframe: Approaching oversold territory — likely to see a recovery over the next 5–7 daily candles.
- H4 Timeframe: Also nearing oversold — an intraday bounce is expected today.
🎯 Trading Plan:
🔵 Buy Zone 1:
Entry: 3292 – 3289
Stop Loss: 3282
TP1: 3306
TP2: 3340
TP3: 3375
🔵 Buy Zone 2:
Entry: 3281 – 3279
Stop Loss: 3271
TP1: 3307
TP2: 3340
TP3: 3375

Elliott Wave Pattern – XAUUSD Trading Plan for June 8, 2025
Elliott Wave Analysis
After Friday’s deep decline, price touched the level of wave 1 (black), invalidating the flat wave 4 scenario. Currently, the structure of wave 5 (black) appears to be a terminal triangle, and the sharp and steep drop afterward is consistent with post-terminal triangle behavior.
Post wave 5 completion, two possible bearish scenarios emerge:
Scenario 1: Price is forming a zigzag (abc in black). Wave c may have completed at 3305 — the first target. However, 3290 remains a significant lower target. A recovery that breaks above 3340 would help invalidate Scenario 2.
Scenario 2: Price is in a 5-wave bearish impulse. To confirm this, price must not break above 3340, as that would overlap with wave 1 and invalidate the structure. If this holds, the next key target lies below 3245.
Momentum Analysis
Daily (D1): When the market opens this week, momentum is expected to enter oversold territory — suggesting a weakening downtrend. Confirmation is needed.
H4: Momentum is already in oversold territory, indicating a potential bullish move early in the week.
H1: Also oversold. A reversal is likely during the Asian or European session, favoring Scenario 1 and a buy setup near wave c = wave a.
Trading Plan
Buy 3305 – 3302
SL: 3295
TP1: 3340
TP2: 3393
Buy 3292 – 3289
SL: 3282
TP1: 3305
TP2: 3340
TP3: 3393
Gold Uptrend Continues June 6, 2025As yesterday Gold made high of 3403, I was expecting to cross upto 3430 but it dropped sharply. News was strong and as it made cautious to investors and safe heaven asset declines moved back to riskers market to 3340.
Now today you can check a pattern and gold is moving in that support and resistance, expecting it to move upward. Currently the situation is unexpected as gold may come down to 3340 and then move upward or directly upward from 3358. Our target is 3375-3389-3400.
Key point.
Resistance - 3360, 3375, 3389, 3400
Support - 3340, 3354
Any Query Reach Us or comment down
Rudra Vasaikar Wishes You A Great And Very Amazing Trading Life. Trade Safe, Trade Right.
RISK WARNING 🔴 🔴 🔴
There is high risk of loss in Trading Forex, Crypto, Indices, CFDs, Features and Stocks. Choose your trade wisely and confidently, please see if such trading is appropriate for you or not. Past performance is not indicative of future results. Highly recommended - Information provided by Pro Trading Point are for Educational purpose only. Do your investment according to your own risk. Any type of loss is not our responsibility.
HAPPY TRADING.
#gold #xauusd #xauusdtrading #goldtrading #goldanalysis #forextrading #forex #trendline #goldsignals #goldnews goldlatestanalysis #xauusdtradesetup #forextradingguide #fxgold

XAUUSD – Bearish Outlook from Resistance Zone📊 XAUUSD – Bearish Outlook from Resistance Zone
🕒 Date: June 5, 2025
💰 Instrument: Gold (XAUUSD)
📍 Current Price: 3,352.730 USD
🟨 Key Resistance Level
🔴 Price has sharply reacted from the 3,375–3,400 USD zone, highlighted as a strong resistance area.
📉 This zone has previously triggered significant sell-offs, confirmed again by the current bearish rejection (red arrow 🔻).
📉 Bearish Market Structure
The price structure suggests a classic lower high rejection scenario with potential for further downside:
🔻 Immediate Drop Expected
After rejection from resistance, the price shows early signs of breakdown. A minor pullback is expected before continuation.
🧭 TP1 – First Target Zone:
📍 3,245.560 USD
This level aligns with a previous demand area (light red box), likely to act as temporary support or reaction point.
🎯 TP2 – Final Bearish Target:
📍 3,127.527 USD
This blue demand zone is a major support level, previously a strong rally base (green arrow 🟢). Expect buyers to step in here again.
🔄 Trade Idea Summary
💼 Setup Type: Resistance Rejection
🛑 Bias: Bearish
📍 Entry Zone: ~3,350–3,360 USD (confirmed rejection)
🎯 Take Profit 1: 3,245.560 USD
🎯 Take Profit 2: 3,127.527 USD
🔒 Stop Loss: Above 3,400 USD (outside resistance zone)
📌 Observations:
🔁 The market repeated its previous pattern: bouncing from the blue demand zone and rejecting at the yellow resistance zone.
🧱 A solid breakdown below TP1 could accelerate movement toward TP2.
🔍 Watch for any bullish reaction around TP2 for potential reversal setups.
📉 Bias: Bearish
📆 Outlook: Short-term to mid-term swing

Chart Overview Instrument: Gold Spot (XAU/USD)🔍 Chart Overview
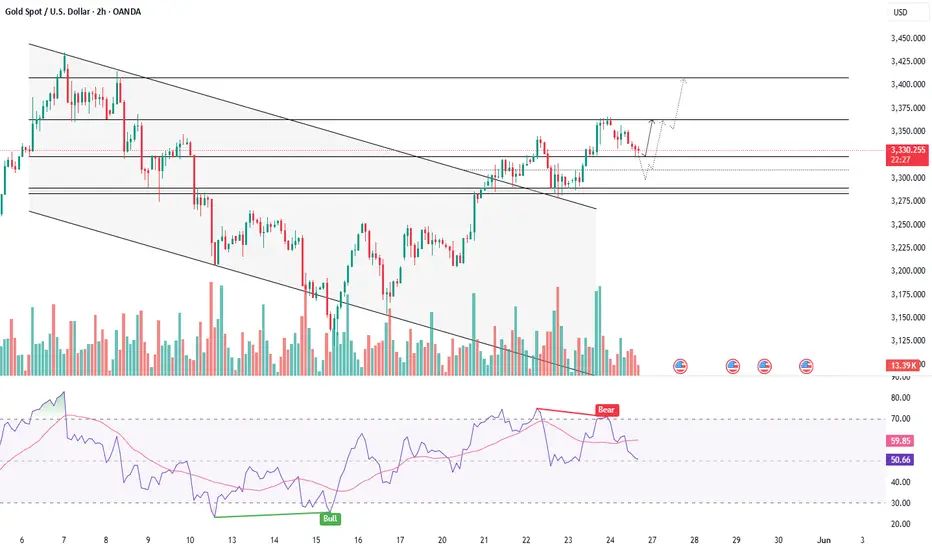
Instrument: Gold Spot (XAU/USD)
Timeframe: 2H (2-hour candles)
Date/Time: Chart ends on June 5th, 2025, 19:14 UTC.
🟩 Support & Resistance Zones
✅ Resistance Zone
Level: Around 3,355 – 3,375 USD
📌 This zone has seen repeated tests and rejections, indicating strong selling pressure.
✅ Support Zone
Level: Around 3,160 – 3,180 USD
🛡️ Price bounced from this zone previously, confirming it as a strong support area.
⚙️ Key Observations
📈 Range-Bound Trading
The price is currently trapped between the strong support and resistance zones.
Multiple rejections at the resistance zone suggest sellers are active above 3,355 USD.
💡 Horizontal Consolidation
Price has formed a horizontal range (sideways movement) in recent sessions.
This range-bound behavior signals market indecision or a buildup before a potential breakout.
📉 Previous Price Action
🔽 Sharp Reversal Drop
Around the middle of May, there was a strong rejection at resistance, followed by a rapid sell-off to the support zone.
This shows that the resistance zone is significant and that sellers are quick to act.
🔮 Potential Scenarios
✅ Bullish Breakout
If price closes above 3,375 USD with strong momentum, expect a potential bullish rally toward 3,400+ USD.
✅ Bearish Rejection
If price fails to close above 3,355 USD and shows rejection candles (like dojis or bearish engulfing patterns), price may retest 3,280 USD and even support at 3,160 USD.
🔔 Key Takeaway & Trader’s Tip
⚠️ Watch for breakout signals near resistance and support.
✅ Volume spikes and momentum indicators will help confirm true breakouts or fakeouts.
🔍 Neutral to Bearish Bias
Given repeated rejections at resistance, short-term bias is neutral to bearish unless a breakout occurs.
📝 Summary with Emojis
🔴 Resistance Zone: 🔝💪
🟩 Support Zone: 🛡️🟢
📉 Bearish Momentum likely below 3,355 USD
📈 Bullish Breakout above 3,375 USD
🕵️♂️ Watch for consolidation and breakout setups!

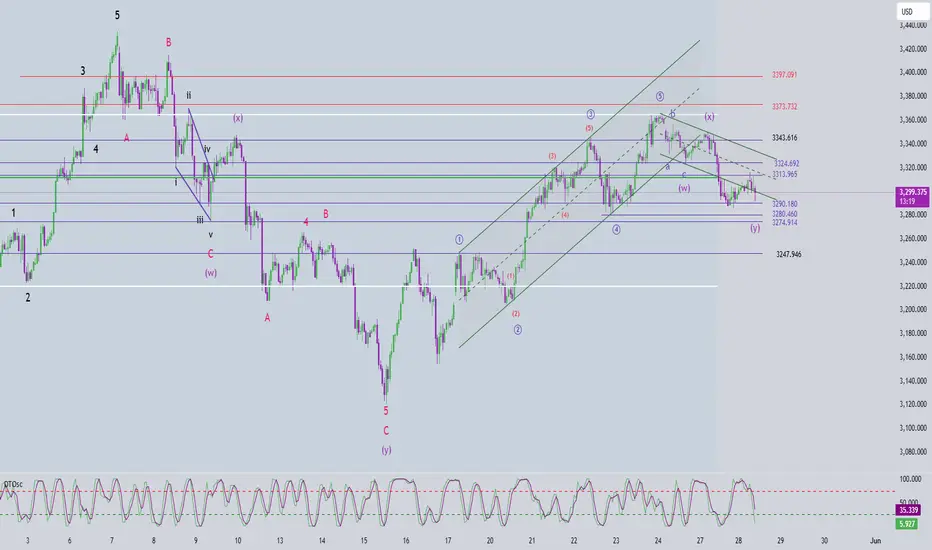
Elliott Wave Analysis – XAUUSD Trading Plan 5/6/2025
🌀 Current Wave Structure
On the H1 timeframe, price action is currently overlapping — a sign that the corrective phase may not be over yet. If the correction had indeed ended at 3334, we would expect a sharper and more impulsive rally typical of wave 3 (green) within wave 3 (black). The lack of that strong momentum suggests the correction could still be unfolding.
Both wave a and wave b (red) are showing 3-wave structures, which points to the development of a Flat correction in the red abc pattern.
Within wave b (red), we’re currently seeing a smaller abc structure (green), with price likely forming wave c (green) right now.
🎯 Target Zones
Wave c (green) target zone: 3390–3393, which is our ideal Sell zone.
If price reverses from this zone, we expect wave c (red) to complete somewhere between 3334–3324.
⚡️ Momentum Outlook
D1 timeframe: Momentum is starting to turn bearish. A confirmation will depend on how today’s daily candle closes. Until then, short-term upside is still possible.
H4 timeframe: Momentum has already turned bearish, supporting the case for a potential wave C (red) to unfold.
H1 timeframe: Currently oversold, which opens the door for a minor push up or some sideways action to finish wave c (green).
📌 Trade Setup
🔻 SELL Zone:
Entry: 3390 – 3393
Stop Loss (SL): 3400
Take Profit (TP1): 3370
Take Profit (TP2): 3357
🔺 BUY Zone:
Entry: 3334 – 3331
Stop Loss (SL): 3322
Take Profit (TP1): 3357
Take Profit (TP2): 3393
Take Profit (TP3): 3410

GOLD - BULLISH OUTLOOK WITH SHORT TERM PULLBACKSymbol - XAUUSD
Gold is currently testing the liquidity zone near the 3350 level, exhibiting signs of a potential false breakout above resistance within the prevailing upward trend. A short-term correction may occur before the continuation of the broader bullish movement.
The fundamental backdrop in the market remains complex and somewhat contradictory. Presently, attention is centered on geopolitical developments, particularly the heightened tensions between Russia and Ukraine following the recent weekend escalation. Market participants are closely monitoring diplomatic negotiations taking place in Turkiye. Additionally, the ongoing uncertainty surrounding international tariff policies continues to exert pressure on sentiment.
Since the session's open, gold has demonstrated strong upward momentum, approaching a key liquidity & resistance zone. A false breakout at resistance appears to be forming, which could prompt a corrective pullback toward a key area of interest. Simultaneously, the US dollar is testing a support level, potentially signaling a local correction before resuming its directional movement. This interplay may influence gold prices, which retain an overall bullish outlook.
Resistance levels: 3350, 3365, 3409
Support levels: 3303, 3264
The price has broken out from a consolidation phase, having tested resistance and triggered liquidity above the 3350 mark. Given the current positioning, a retracement toward support levels is plausible before the uptrend resumes.

Gold on it’s target - Next Move BullishOur yesterday analysis went TRUE . As expected after reaching high gold came down for correction. As you all know today there is PMI news today, so market will come down and after that take upward momentum. So do wait for it and after that execute the trade.
Key point.
Support - 3348, 3335, 3329
Resistance - 3354, 3362, 3371
Any Query Reach Us or comment down
Rudra Vasaikar Wishes You A Great And Very Amazing Trading Life. Trade Safe, Trade Right.
RISK WARNING 🔴 🔴 🔴
There is high risk of loss in Trading Forex, Crypto, Indices, CFDs, Features and Stocks. Choose your trade wisely and confidently, please see if such trading is appropriate for you or not. Past performance is not indicative of future results. Highly recommended - Information provided by Pro Trading Point are for Educational purpose only. Do your investment according to your own risk. Any type of loss is not our responsibility.
HAPPY TRADING.
#gold #xauusd #xauusdtrading #goldtrading #goldanalysis #forextrading #forex #trendline #goldsignals #goldnews goldlatestanalysis #xauusdtradesetup #forextradingguide #fxgold

XAU/USD Bearish Rejection at Resistance – Potential Drop Ahead!XAU/USD Bearish Rejection at Resistance – Potential Drop Ahead! 💥
🔍 Technical Analysis:
Instrument: Gold vs US Dollar (XAU/USD)
Timeframe: Daily
Current Price: $3,363.26
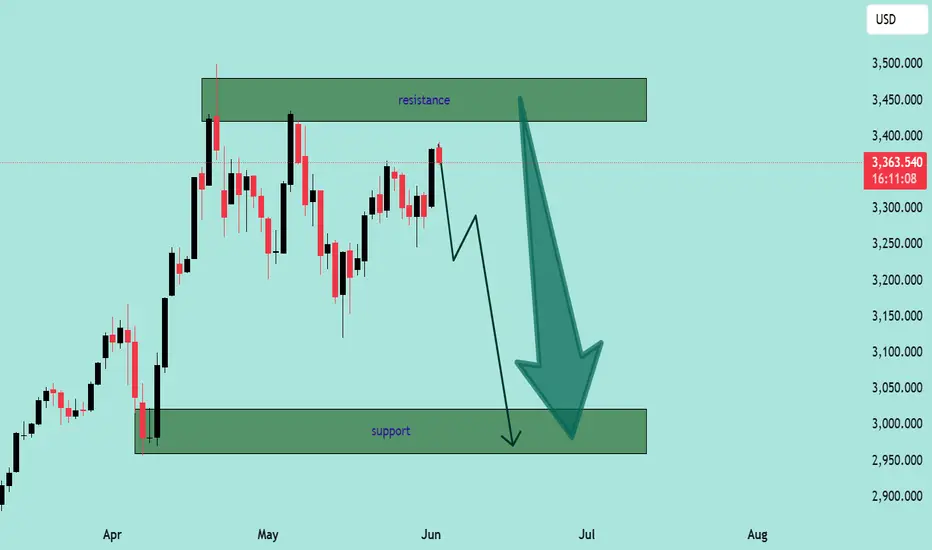
Resistance Zone: $3,380 – $3,470
Support Zone: $2,970 – $3,100
🧠 Market Context:
Gold has recently approached a well-defined resistance zone near the $3,380–$3,470 range. Price action shows multiple rejection wicks and failed attempts to break above this level, indicating strong selling pressure from bears. 🐻
The current candlestick structure suggests the market is printing lower highs, which may indicate a transition from a consolidation phase into a potential bearish trend.
📉 Projection:
The chart projects a move down toward the support zone, around $2,970–$3,100, possibly due to:
Repeated rejections at the resistance zone 🔄
Lack of bullish momentum near highs ⚠️
Bearish engulfing or reversal candlestick formations 🔻
✅ Key Levels to Watch:
Level Type Price Zone Action
🔴 Resistance $3,380 – $3,470 Strong rejection expected
🟢 Support $2,970 – $3,100 Major demand zone; potential bounce
🧭 Trading Outlook:
⚠️ If price fails to break above the resistance zone, short opportunities may develop with a target near the support zone. A confirmed break and close below $3,300 would strengthen bearish sentiment.
📌 Bearish Bias Maintained Until Resistance Breaks
XAU/USD Price Action Analysis – Bullish Breakout Setup XAU/USD Price Action Analysis – Bullish Breakout Setup 🚀
🔍 Chart Overview:
This chart illustrates the price movement of XAU/USD (Gold vs USD) on a mid-term time frame, highlighting a potential bullish breakout scenario from a key resistance zone.
🟩 Key Levels:
Support Zone: 🛡️
➤ $3,140 – $3,200
This zone has acted as a strong support multiple times, preventing further declines and serving as a springboard for bullish moves.
Breakout Zone (Current Level): ⚡
➤ $3,340 – $3,390
Price is currently testing this crucial resistance-turned-potential-breakout zone. A successful close above this level could confirm bullish continuation.
First Target: 🎯
➤ $3,435.87
This intermediate resistance aligns with a previously tested high. It may act as the first barrier after the breakout.
Second Target: 🥇
➤ $3,502.13
This is the major resistance zone. If bulls maintain momentum, this area will likely be tested.
🧭 Market Structure & Bias:
Price is forming higher lows, signaling growing bullish strength.
The chart shows a bullish breakout of a sideways consolidation zone.
The upward arrows and curved projection suggest a potential pullback-retest scenario at the breakout level before rallying towards targets.
🧠 Trading Plan (Illustrated by Chart):
📈 Breakout Entry:
Wait for confirmation above $3,390 with strong bullish candles and volume.
🔁 Retest Opportunity:
If price pulls back to the breakout zone ($3,340 – $3,390), this may serve as a solid re-entry point for long positions.
🎯 Profit Targets:
TP1: $3,435
TP2: $3,502
🛑 Invalidation:
A strong close back below $3,320 may invalidate the bullish bias.
📌 Conclusion:
The chart indicates a bullish continuation setup for XAU/USD with clearly defined breakout, retest, and target zones. Traders should monitor price action closely around the breakout area for confirmation before entering long positions. Risk management remains key. 🧮⚖️

Gold (XAU/USD) – Inverse Head & Shoulders Breakout Setup🧠 Chart Pattern Identified: Inverse Head & Shoulders
🟡 Left Shoulder ➡️ Formed at a local dip.
⚫ Head ⬇️ Deepest low around 3,274.103.
🟡 Right Shoulder ➡️ Bouncing near the same zone.
🔁 This is a classic bullish reversal pattern — a break above the neckline could signal a strong upside move.
📊 Key Levels & Zones
🔵 Support Zone:
🟦 Area: 3,274 – 3,294
✅ Strong bounce seen here (highlighted by the head and shoulders base)
🔵 Resistance Zone:
📏 Just below 3,305 (marked as neckline)
✋ Price must break this to confirm the reversal
🔵 Target Point:
🎯 3360 📈
📏 Based on the height from head to neckline
🔵 Stop Loss Zone:
❌ 3,274.526
🔻 Below the head for safe risk control
⚙️ Trading Setup Summary
🔹 📍 Entry Point:
📌 Around 3,294.449
🚪 Enter on breakout above neckline
🔹 🎯 Target Point:
🏁 3360
🔹 🛑 Stop Loss:
🚫 3,274.526
🔹 Risk-Reward Setup:
🔍 Targeting a move of ~65 points
⚖️ Risk of ~20 points → solid R/R ratio
📈 Indicator:
🧮 EMA 70 ➡️ 3,305.005
⏳ Price currently testing it — a break above EMA would boost bullish confirmation.
📅 Economic Events:
📆 Multiple event icons suggest upcoming news — expect volatility!
⚠️ Be cautious during these times.
✅ Final Thoughts:
📊 Pattern suggests a bullish breakout is near 🚀
🔒 Use stop-loss and enter after breakout to manage risk effectively
🎯 Keep an eye on volume during breakout — it confirms strength

Elliott Wave Analysis – XAUUSD Trading Plan | June 2, 2025
🌀 Current Wave Structure
On the H1 timeframe, wave 2 (black) appears to have completed as a zigzag pattern, with price reacting strongly after touching the 3272 level — signaling that the abc corrective wave (green) may be finished.
Zooming into the M10 timeframe, the recent rally shows a 5-wave leading diagonal, indicating that wave 1 (red) is complete.
Currently, price is in the pullback phase of wave 2 (red).
📍 The ideal correction zone for wave 2 (red) is around 3281, which is our key area to look for Buy opportunities.
However, if price breaks below 3272, this wave count becomes invalid, and we’ll wait for a new setup aligned with deeper correction.
🔋 Momentum Outlook
• D1: Momentum is preparing to turn bullish ⇒ supports the start of wave 3 (black) and a bullish outlook for the week
• H4: Momentum is bottoming and about to reverse ⇒ supports wave 3 (red) forming in upcoming sessions
• H1: Currently declining ⇒ expect early-session pullback. Watch for bullish reversal signals as long as 3272 holds for potential entries
✅ Trade Setup
🎯 BUY ZONE: 3282 – 3279
🛑 Stop Loss: 3272
🎯 Take Profits:
• TP1: 3308
• TP2: 3324
• TP3: 3346
⏳ Note: Price action around the 3272–3281 zone will be key to confirming whether wave 2 (red) is complete.
If confirmed, wave 3 could begin with strong momentum — especially after breaking above 3296.

GOLD - RETESTING SUPPORT BEFORE THE NEXT CLIMBSymbol - XAUUSD
CMP - 3327
Gold continues to strengthen, supported by a complex and evolving fundamental landscape.
A false breakdown below the 3285 support level has facilitated a move to a new local high at 3365
Despite a weaker US dollar, gold experienced a modest pullback from the 3365 high amid subdued market activity caused by US market holiday. Investor sentiment reflects profit-taking ahead of key US inflation data releases. Additional downward pressure is linked to optimism surrounding a potential trade agreement between the United States, Europe and Japan. Nonetheless, the decline in gold prices remains limited, as safe-haven demand persists in response to ongoing geopolitical tensions, US fiscal concerns, and instability in the Middle East.
Support levels: 3321, 3308, 3300
Resistance levels: 3363
From a technical perspective, gold appears to be executing a false breakout above consolidation resistance and is entering a corrective phase. During this correction, the price may target liquidity zones in the 3320-3303 range before resuming its upward trajectory.
XAU/USD Technical Analysis: Major Levels, Market Structure, and 🔍 XAU/USD Technical Analysis: Major Levels, Market Structure, and Trade Ideas
In this detailed analysis of XAU/USD, we highlight key supply and demand zones, dynamic trendlines, and the interplay of structural shifts to help traders navigate the current price action effectively.
🔴 Key Supply Zone (Week & Day A+ Selling Area)
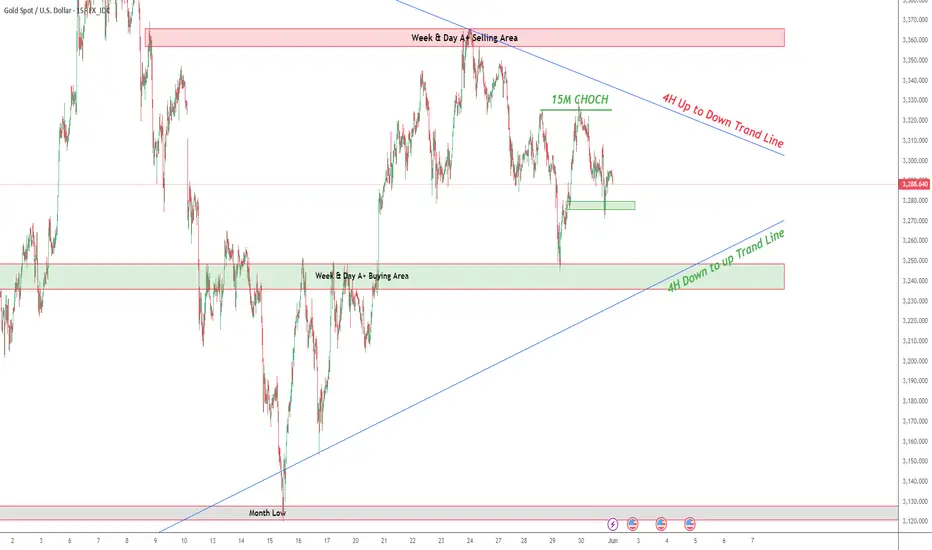
Location: Above 3,320- 3,330
Significance: This red zone has historically acted as a strong resistance area. Price has failed multiple times to break above it convincingly, suggesting institutional selling pressure.
Implication: Any revisit to this zone could trigger bearish rejection, making it a key level for short setups.
🟢 Major Demand Zone (Week & Day A+ Buying Area)
Location: 3,230–3,260 region
Significance: This green zone has consistently provided support for price, as shown by multiple bounces from it. It suggests strong buying interest from institutions or large market participants.
Implication: Traders can watch for bullish price action in this area to confirm potential long opportunities.
📈 Dynamic Trendlines
🔵 4H Down-to-Up Trend Line:
This ascending trendline, drawn from major swing lows, suggests that the broader 4H market structure remains bullish.
Use: Acts as dynamic support for possible bounces.
🔴 4H Up-to-Down Trend Line:
This descending trendline captures the bearish structure in the 4H timeframe, connecting the lower highs and indicating ongoing selling pressure.
Use: Functions as a dynamic resistance area.
✅ 15M Change of Character (CHoCH)
This micro timeframe level marks a shift in sentiment from bearish to bullish, providing early confirmation for potential reversals or continuation plays.
Use: Intraday traders can utilize this for short-term entries in line with the broader bias.
🔻 Monthly Low Level
Location: Around 3,120
Significance: This level marks the lowest point in the recent monthly cycle and serves as a crucial support area for the broader trend.
Implication: A break below this level would suggest further downside potential.
💡 Trade Scenarios
1️⃣ Bullish Scenario
If price retests the Week & Day A+ Buying Area (3,240–3,260) and forms bullish confirmation (like a bullish engulfing candle or 15M CHoCH shift), a long trade could be initiated.
Potential Targets:
4H descending trendline near 3,300
Week & Day A+ Selling Area above 3,320
2️⃣ Bearish Scenario
If price reaches the 4H descending trendline or the selling zone above 3,320 and forms bearish rejection, shorts can be considered.
A break below the 4H ascending trendline and the demand zone would open the door for deeper downside, with the ultimate target at the Month Low near 3,120.
📝 Conclusion
XAU/USD is consolidating within a crucial range, balancing supply and demand forces. The dual-trendline structure signals a potential breakout in the coming sessions. Short-term traders can leverage the 15M CHoCH for early entries, while swing traders should focus on the interplay between the higher timeframe zones and trendlines.
📌 Reminder: Always wait for confirmation before entering trades and manage risk according to your trading plan.
🔔 Follow for updates! Let me know if you have any questions or want to discuss your own analysis. Happy trading! 🚀✨
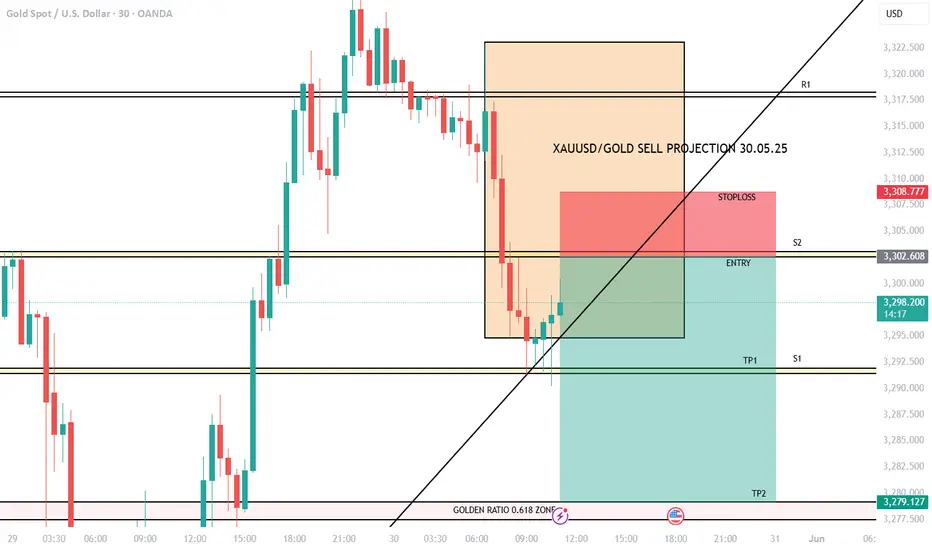
XAUUSD/GOLD SELL PROJECTION 30.05.25The red zone above the entry point marks the risk (stop loss), while the larger green zone below indicates the potential reward (profit targets TP1 and TP2), implying a favorable risk-to-reward ratio.
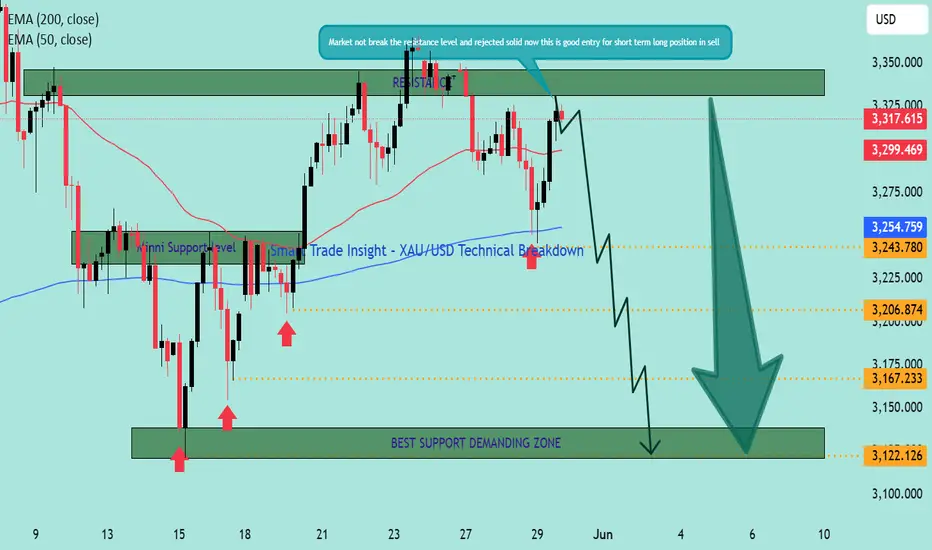
Smart Trade Insight – XAU/USD Technical BreakdownKey Levels & Technical Zones:
🔹 Resistance Zone (🔼 SELL Area):
📌 3,315 – 3,340
This area has been tested and rejected multiple times, as highlighted by the strong bearish wicks. The recent price action failed to break above it, triggering short interest.
🔹 Minor Support Zone:
📌 Around 3,243
Acted as intraday bounce area previously, now likely to offer weak support in the coming move down.
🔹 Major Demand Zone (💚 BUY Interest Zone):
📌 3,120 – 3,140
Labelled as "BEST SUPPORT DEMANDING ZONE" – historical demand visible with strong bounce history. Ideal for monitoring bullish reversal opportunities.
📈 EMA Levels:
🔴 50 EMA: 3,299
🔵 200 EMA: 3,254
Current price action is hovering near the EMAs. The rejection at the resistance while below the 50 EMA indicates weakening bullish momentum.
🔍 Market Structure Overview:
The double-top formation near the resistance shows exhaustion in buying.
Lower highs forming → structure turning bearish short-term.
Solid rejection confirms that this is a valid zone to initiate short positions 🛑📉.
📉 Forecast Path:
🔮 Projected Move:
Price is expected to break below minor support at 3,243.
Intermediate target: 3,206, then 3,167 🟠.
Final destination: Demand Zone at 3,120 – 3,140 🟩 for potential bounce 📈.
💬 "Market not break the resistance level and rejected solid — this is a good entry for short-term sell trades." ✅
✅ Trade Idea Summary:
🟥 Bias: Short
🎯 TP Targets: 3,206 → 3,167 → 3,122
📉 SL Suggestion: Above 3,340 resistance zone
🧭 Risk-Reward Setup: Favorable for short-term traders
Key Levels & Technical Zones:
🔹 Resistance Zone (🔼 SELL Area):
📌 3,315 – 3,340
This area has been tested and rejected multiple times, as highlighted by the strong bearish wicks. The recent price action failed to break above it, triggering short interest.
🔹 Minor Support Zone:
📌 Around 3,243
Acted as intraday bounce area previously, now likely to offer weak support in the coming move down.
🔹 Major Demand Zone (💚 BUY Interest Zone):
📌 3,120 – 3,140
Labelled as "BEST SUPPORT DEMANDING ZONE" – historical demand visible with strong bounce history. Ideal for monitoring bullish reversal opportunities.
📈 EMA Levels:
🔴 50 EMA: 3,299
🔵 200 EMA: 3,254
Current price action is hovering near the EMAs. The rejection at the resistance while below the 50 EMA indicates weakening bullish momentum.
🔍 Market Structure Overview:
The double-top formation near the resistance shows exhaustion in buying.
Lower highs forming → structure turning bearish short-term.
Solid rejection confirms that this is a valid zone to initiate short positions 🛑📉.
📉 Forecast Path:
🔮 Projected Move:
Price is expected to break below minor support at 3,243.
Intermediate target: 3,206, then 3,167 🟠.
Final destination: Demand Zone at 3,120 – 3,140 🟩 for potential bounce 📈.
💬 "Market not break the resistance level and rejected solid — this is a good entry for short-term sell trades." ✅
✅ Trade Idea Summary:
🟥 Bias: Short
🎯 TP Targets: 3,206 → 3,167 → 3,160
📉 SL Suggestion: Above 3,340 resistance zone
🧭 Risk-Reward Setup: Favorable for short-term traders
XAUUSD/GOLD SELL PROJECTION 29.05.25R1 (Resistance): Just above entry, marking the recent high.
S1 & S2 (Support levels): Intermediate levels where price might pause or bounce.
Low Zone: Aligns with TP2, marking a significant potential support zone.

Elliott Wave Analysis – XAUUSD Trading Plan – 28th May 2025
🔍 Current Wave Structure
After a sharp drop yesterday, price has mildly recovered and is now consolidating around the 3314 zone. The correction has nearly reached the target of wave C (green). However, the current rebound is weak, marked by small, overlapping H1 candles — suggesting the bullish structure is not yet convincing.
At this point, we’re tracking two main scenarios:
✅ Scenario 1 – Correction Completed
Wave C seems complete, and price might be starting a new bullish trend.
That said, the overlapping candles on H1 could also indicate the formation of a leading diagonal for wave 1.
In this case, wave 2 is likely to be a strong retracement — typically forming as a zigzag or flat correction.
📌 Strategy:
Wait for wave 2 to complete before looking for a better buy opportunity.
🌀 Scenario 2 – Correction Still in Progress
If the price continues to move slowly or goes sideways, we could be in wave b of a double zigzag correction (wave Y).
🎯 Wave c within wave Y may target 3324.
However, if price breaks below 3284 before hitting 3324, it would likely mean wave c has started, with an expected end near 3280–3274.
📈 Momentum Outlook
D1: Momentum remains bearish ⇒ primary trend still points downward.
H4: Momentum is currently rising ⇒ we may see a temporary recovery today.
H1: Approaching oversold ⇒ if reversal signals appear, short-term buy setups may emerge.
🎯 Trade Plan for Today (28/05/2025)
🔹 Buy Scalp
Entry: 3292 – 3289
SL: 3282
TP1: 3313
TP2: 3324
🔹 Buy Swing
Entry: 3280 – 3277
SL: 3270
TP1: 3290
TP2: 3313
TP3: 3324
🕰️ Expected timing: From London session through New York close
🔸 Sell Zone
Entry: 3324 – 3327
SL: 3334
TP1: 3313
TP2: 3290
TP3: 3280
🕰️ Ideal entry: If price hits resistance during US session or late London
📌 All scenarios will be updated as soon as wave 2 completes or if price clearly breaks below 3284.
Be patient — let the market confirm before taking action.
Elliott Wave Analysis – XAUUSD Trading Plan – 27th May 2025
📊 Wave Structure – XAUUSD – H1 Timeframe
Price is likely in a corrective phase — wave iv (orange) — after completing five internal green waves within wave iii.
During this correction, we’ve seen an abc zigzag form, followed by an unclear upward bounce. This gives rise to two key scenarios:
🔸 Scenario 1: Wave iv is complete
The abc pattern is finished, and price appears to be forming an initial triangle structure. We could currently be in wave 2.
👉 A breakout and H1 candle close above 3343 would confirm the start of a new uptrend. In this case, prefer buying on dips.
🔸 Scenario 2: Zigzag correction is still ongoing
Wave X seems complete, and price may now be developing wave Y — either as another abc or triangle.
👉 This scenario gets confirmed if price breaks below the wave c (green) low at 3324.
🎯 Wave Y downside targets (based on Fibonacci + Volume Profile):
• Target 1: 3317
• Target 2: 3290
🔍 Momentum Analysis
D1 Momentum has already confirmed bearish → Downside pressure likely to persist through the week.
H4 Momentum is currently rising → Price could see a short-term rally or sideways action today.
H1 Momentum is nearing oversold → We wait for it to flip to overbought. If price fails to break 3349, there may be room for a scalp sell.
However, if 3349 is broken, wave X could extend further — or it might mark the start of a new bullish leg. We’ll reassess accordingly.
📌 Trade Plan
Buy Zone: 3317 – 3314
Stop Loss: 3307
Take Profit 1: 3334
Take Profit 2: 3373
✅ Only execute if H1 momentum shifts bullish.
❗ If this zone breaks, next buy opportunity lies around 3290.

Elliott Wave Analysis – XAUUSD – Plan for May 27, 2025📊 Price is likely in the middle of a wave iv (orange) correction, following the completion of a 5-wave structure (green) that formed wave iii.
During this correction, an ABC zigzag pattern has already formed. The recent upward move remains unclear, which opens up two possible scenarios:
🔸 Scenario 1 – Wave iv is completed
The ABC structure looks complete. Price appears to be forming a leading diagonal, currently in wave 2.
A confirmed breakout above 3343 with a candle close would validate a new bullish trend → favoring Buy entries in line with the larger trend.
🔸 Scenario 2 – Ongoing zigzag correction (double structure)
Wave X has completed, and price may now be developing wave Y (either an ABC or triangle pattern).
This scenario is confirmed if price breaks below wave c (green) at 3324.
🎯 Wave Y Target Zones (based on Fibonacci + Volume Profile):
• Target 1: 3317
• Target 2: 3290
🔍 Momentum Outlook:
• Daily (D1): Bearish momentum confirmed → downside likely to dominate into the end of the week
• H4: Momentum rising → short-term bounce or consolidation expected today
• H1: Near oversold → watch for bullish reversal.
If price fails to break above 3349, scalp shorts may be considered.
However, a break above 3349 could mean wave X continues as an extended ABC, or a new bullish trend has started — to be updated accordingly.
📌 Trading Plan:
Buy Zone: 3317 – 3314
Stop Loss: 3307
Take Profit 1: 3334
Take Profit 2: 3373
✅ Only enter on H1 bullish momentum reversal
❗ If this zone fails, watch for the next Buy opportunity near 3290
