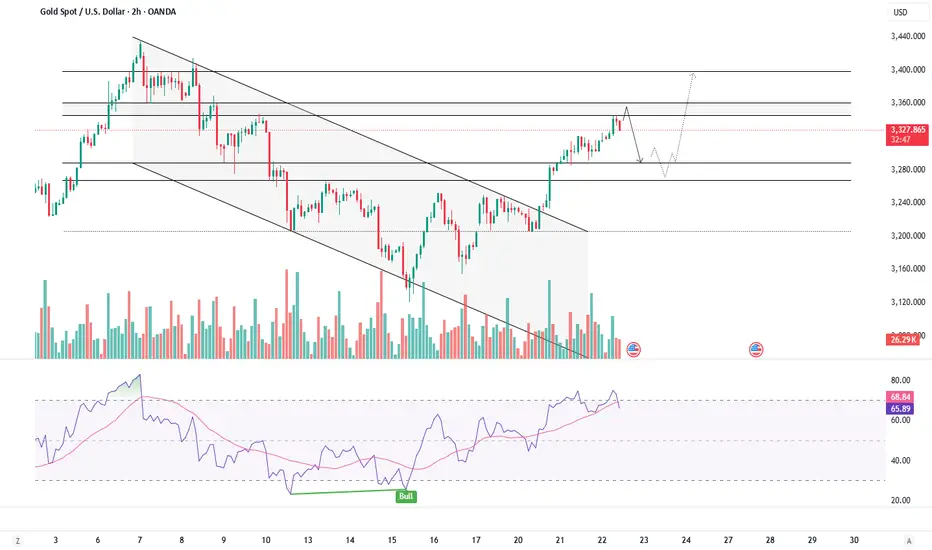
Elliott Wave Analysis – Plan XAUUSD 23/5/2025At the moment, we’re monitoring two possible wave scenarios:
🔸 Scenario 1 – ABC Correction Completed
The bullish move from the 3123 zone to the current price may have formed a completed ABC corrective structure (labeled on the top-left of the chart).
If this scenario is correct, the correction has ended and the market is now entering a new 5-wave bearish impulse.
Within this structure:
• Wave 1 is already completed
• Price is currently retracing as Wave 2
This view is supported by the strong reaction around the 3247 zone.
📍 Ideal target for Wave 2: around 3325
🔸 Scenario 2 – Bullish 5-Wave Structure in Progress
A potential impulsive structure with waves 1-2-3-4-5 is currently labeled on the chart.
In this count:
• Wave 3 (yellow) has completed
• The market is now in Wave 4 (yellow)
Wave 4 appears to be unfolding as an A-B-C corrective pattern:
• Wave A has completed
• Price is now forming Wave B (black)
✅ This scenario requires a daily close above 3247 for confirmation.
📍 Target for Wave B: also near 3325
🔎 Momentum Analysis
• Daily (D1): Overbought – the uptrend is weakening → likely a larger corrective move ahead
• H4: Momentum rising → favors a short-term bullish bounce
• H1: Momentum just flipped bullish → current rally may extend further
📌 Trade Plan (for both scenarios):
SELL ZONE: 3325 – 3328
Stop Loss: 3335
Take Profit 1: 3279
Take Profit 2: 3247
📈 Wait for price action around the 3325 zone to confirm which scenario plays out.
Xauusdupdates

GOLD - EXPECTING A PULLBACK BEFORE RESUMING UPTRENDSymbol - XAUUSD
Gold is breaking out of its descending price channel and approaching the key area of interest at 3346. A potential false breakout above resistance could prompt a short-term correction before the upward trend resumes.
Gold is advancing for the third consecutive session, trading above the 3300 level, supported by a weakening US dollar and escalating geopolitical tensions. Investor demand for safe-haven assets is increasing amid concerns surrounding US fiscal policy, ongoing trade frictions with China, and the possibility of a military strike by Israel on Iran. Additional support for gold stems from market expectations of a Federal Reserve rate cut and diminished outlook for the dollar.
From a technical standpoint, the price is approaching a significant order block and resistance zone between 3345-3360. Since the session opened, the upward momentum appears to have reached its limit, suggesting that a retest of this key level could result in a false breakout and subsequent pullback. Nonetheless, given the prevailing macroeconomic conditions, any corrective move may be temporary, with the broader bullish trend likely to persist thereafter.
Resistance levels: 3346, 3360, 3409
Support levels: 3288, 3265, 3245
Gold has re-entered the buy zone. However, the fundamental backdrop remains volatile. A reduction in economic risks could prompt renewed downward pressure. At present, attention is centered on the 3346–3360 range, where a false breakout remains a probable scenario, potentially preceding further gains.
GOLD - SHORT SQUEEZE BEFORE THE DROP?Symbol - XAUUSD
CMP - 3247
Gold is currently undergoing a phase of consolidation. The market lacks a decisive catalyst, and given the prevailing uncertainty in the macroeconomic landscape, traders have largely adopted a cautious, wait and watch approach. This period of consolidation may give way to a sharp movement at any time but the direction remains uncertain.
Investors are closely monitoring signals from the Federal Reserve and ongoing trade negotiations. The US dollar continues to exert downward pressure on gold amid anticipation of trade talks involving China, India, South Korea, and Japan along with recent statements from the Federal Reserve. Previously, gold received support from a weaker dollar following Moody’s downgrade of the US credit rating. However, rising risk appetite and optimism surrounding potential peace talks between Russia and Ukraine have reduced safe-haven demand for gold. Key market drivers namely, Fed commentary and international negotiations will remain crucial in shaping the future trajectory of both the dollar and gold prices.
From a technical perspective, the price remains within a downtrend and is currently in consolidation. A breakout from this range could be accompanied by significant momentum. However, my view is that any movement against the prevailing trend is unlikely to be sustained. A retest of resistance may result in a renewed decline.
Key Resistance Levels: 3257, 3265
Key Support Levels: 3204, 3153
Within the broader bearish trend, the most probable scenario is a short squeeze followed by a downside breakout from the consolidation triangle. As fundamental pressures and economic risks gradually ease, gold may continue to lose value. A false breakout in the 3250-3265 zone could potentially trigger a continuation of the downward trend toward the 3150-3120 zone.

GOLD SHOWING A GOOD UP MOVE WITH 1:10 RISK REWARD GOLD SHOWING A GOOD UP MOVE WITH 1:10 RISK REWARD
DUE TO THESE REASON
A. its following a rectangle pattern that stocked the market
which preventing the market to move any one direction now it trying to break the strong resistant lable
B. after the break of this rectangle it will boost the market potential for break
C. also its resisting from a strong neckline the neckline also got weeker ald the price is ready to break in the outer region
all of these reason are indicating the same thing its ready for breakout BREAKOUT trading are follws good risk reward
please dont use more than one percentage of your capitalfollow risk reward and tradeing rules
that will help you to to become a bettertrader
thank you

GOLD - RETEST OF TREND RESISTANCE BEFORE POTENTIAL DECLINESymbol - XAUUSD
CMP - 3246
Gold is staging a modest recovery amid ongoing market uncertainty. However, a significant resistance zone lies ahead, which could limit further upside and potentially initiate a reversal.
Since the session's open, prices have rebounded slightly following a week-long decline. The current upward momentum is constrained by mixed market signals: on one hand, pressure on the US dollar and Moody’s downgrade of the US credit rating are providing support for gold. On the other hand, elevated bond yields and prospects of new US trade agreements are capping gains.
Market participants are closely watching upcoming Federal Reserve commentary and tracking developments in US trade negotiations with key global partners. In an environment marked by concerns over fiscal stability and weaker economic indicators, gold may maintain a positive bias. However, the emergence of favorable trade news could shift sentiment and lead to renewed downward pressure.
Key Resistance levels: 3257, 3265
Key Support levels: 3204, 3153
A failed breakout above the identified resistance range would signal a lack of upward momentum. Should the price consolidate below the 3257 level following a false breakout of the 3257-3265 zone, it may trigger a reversal and drive the market toward key support levels.
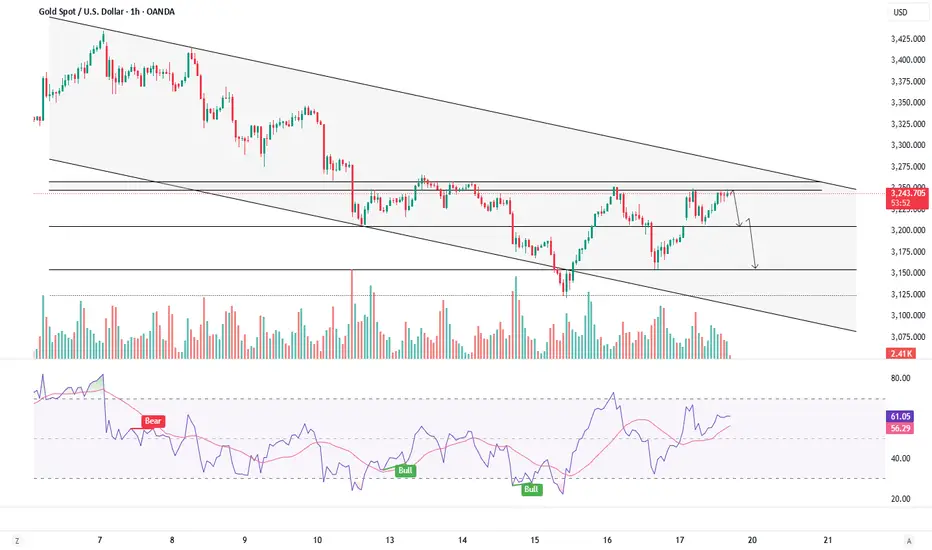
XAUUSD/GOLD 30 MIN SELL PROJECTION 20.05.25The price is expected to rise into the entry zone.
If the setup holds, it should reject from this resistance and fall toward TP1.
A deeper push would target TP2, with the golden ratio zone acting as a potential reaction area.

XAUUSD/GOLD 15 MIN BUY PROJECTION 19.05.25Entry Zone: Around 3,216.325
Breakout + Retest Zone: Around 3,212.500
Stoploss: Just below 3,210.000 (specifically marked at 3,209.969)
TP1 (Take Profit 1): Around 3,230.000

XAUUSD/GOLD BUY PROJECTION 19.05.25Entry Point: Around 3,216 (marked as "ENTRY + SUPPORT 2")
Stop Loss: Just below 3,191.916
Take Profit Levels:
TP1 (R1): ~3,260
TP2 (R2): ~3,285
TP3 (R3): ~3,340
TP4 (R4): ~3,383.921

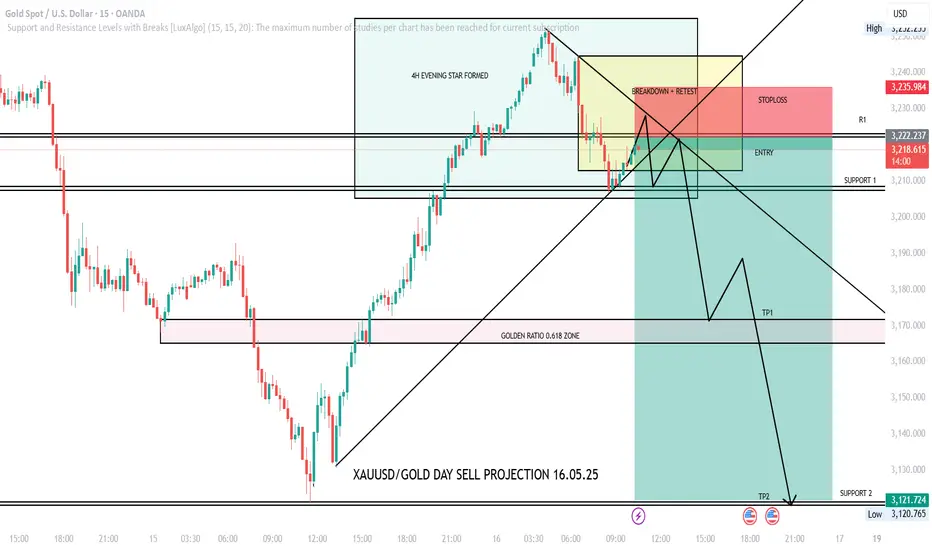
XAUUSD/GOLD DAY SELL PROJECTION 16.05.25📉 Sell Setup Overview:
Pattern Identified:
4H Evening Star — a bearish reversal pattern indicating potential downside.
Trade Setup:
Entry Zone: Around 3,219.970
Stop Loss: Above 3,235.984
Targets:
TP1 (Take Profit 1): Around 3,170.000 (Golden Ratio 0.618 zone)
TP2: Around 3,121.724 (near Support 2)
Technical Zones:
Breakdown + Retest zone highlighted in yellow (indicating confirmation of bearish reversal).
Golden Ratio (0.618) support/fib zone — used as a significant level for TP1.
Support 1 and Support 2 are drawn as potential price stalling or reversal zones.
GOLD - RESISTANCE RETEST BEFORE THE DROPSymbol - XAUUSD
Gold is currently undergoing a corrective phase, retesting a significant resistance and liquidity zone within the broader context of a prevailing downtrend. The global trend appears to be approaching a critical juncture, potentially signaling a reversal.
Ahead of the forthcoming US inflation report, gold prices have stabilized following a 3% decline, trading steadily around the 3250 level. This consolidation is occurring against a backdrop of a weaker US dollar. Market participants are awaiting the release of US Consumer Price Index (CPI) data, which is expected to provide clearer direction for both monetary policy expectations and asset flows.
Support for gold prices is being derived from a combination of factors, including optimism surrounding the US-China trade dialogue, signs of easing geopolitical tensions, and profit-taking on long dollar positions. However, the market remains cautious, closely evaluating the potential implications of inflation data on Federal Reserve policy and the demand for safe-haven assets.
Despite the current stabilization, skepticism persists regarding the sustainability of any upward momentum. Technical conditions suggest the possibility of a sharp reversal, with attention focused on key inflection points that could trigger renewed selling pressure.
Key Resistance Levels: 3269, 3284
Key Support Levels: 3246, 3200, 3167
Should the CPI report fail to deliver any major surprises, a false breakout within the 3260-3270 resistance zone followed by price consolidation could serve as a catalyst for a decline toward the 3200-3150 range.

GOLD - BEARISH FLAG OR BULLISH TREND REVERSAL?Symbol - XAUUSD
CMP - 3238
Gold is emerging from a local corrective channel, commonly identified as a 'Flag' formation. Consolidation continues near the base of this potential reversal pattern, with market focus centered on the critical 3200 level.
Gold is experiencing downward pressure amid renewed trade optimism and strength in the US dollar. Prices are retreating early Wednesday as market participants engage in profit-taking following a recent rebound from weekly lows. Although US inflation data came in below expectations, it failed to support earlier assumptions of imminent monetary easing. The Federal Reserve’s continued reluctance to initiate rate cuts is exerting additional pressure on the precious metal. Moreover, growing optimism surrounding potential trade agreements between the United States, China, the United Kingdom, and other nations-along with renewed hope for diplomatic progress in the Russia-Ukraine conflict is dampening gold’s appeal as a safe-haven asset.
From a technical standpoint, the outlook remains bearish. The absence of a meaningful rebound from support suggests sustained selling pressure. A consolidation phase appears to be developing ahead of a potential test of the 3200 support level.
Key Resistance Levels: 3243, 3257, 3269
Key Support Levels: 3222, 3200
Should price action continue to consolidate within the current local range and repeatedly test support in the 3222-3200 zone, further downside may be anticipated in the short to medium term. However, in consideration of common market maker tactics, a brief short squeeze targeting local resistance zones cannot be ruled out prior to any subsequent decline.

XAUUSD SHOWING A GOOD DOWN MOVE WITH 1:10 RISK REWARD XAUUSD SHOWING A GOOD DOWN MOVE WITH 1:10 RISK REWARD
DUE TO THESE REASON
A. its following a rectangle pattern that stocked the market
which preventing the market to move any one direction now it trying to break the strong resistant lable
B. after the break of this rectangle it will boost the market potential for break
C. also its resisting from a strong neckline the neckline also got weeker ald the price is ready to break in the outer region
all of these reason are indicating the same thing its ready for breakout BREAKOUT trading are follws good risk reward
please dont use more than one percentage of your capitalfollow risk reward and tradeing rules
that will help you to to become a bettertrader
thank you

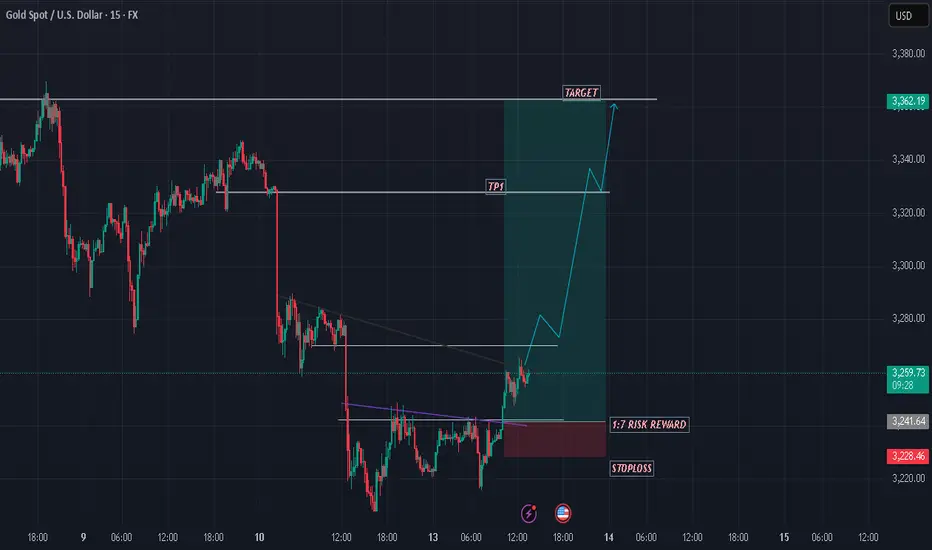
GOLD SHOWING A GOOD UP MOVE WITH 1:7 RISK REWARD GOLD SHOWING A GOOD UP MOVE WITH 1:7 RISK REWARD
DUE TO THESE REASON
A. its following a rectangle pattern that stocked the market
which preventing the market to move any one direction now it trying to break the strong resistant lable
B. after the break of this rectangle it will boost the market potential for break
C. also its resisting from a strong neckline the neckline also got weeker ald the price is ready to break in the outer region
all of these reason are indicating the same thing its ready for breakout BREAKOUT trading are follws good risk reward
please dont use more than one percentage of your capitalfollow risk reward and tradeing rules
that will help you to to become a bettertrader
thank you
XAU/USD Intraday Trade Signal**Date:** May 13, 2025
**Asset:** Gold (XAU/USD)
**Trade Type:** Intraday Buy
**Buy Zone:** 3240.00 - 3250.00
**Stop Loss:** 3207.00 (set below entry for risk management)
**Take Profit Levels:**
1st TP: 3260.00
2nd TP: 3278.00
3rd TP: 3294.74
4th TP: 3317.63
5th TP: 3347.38 (near potential high)
**Strategy:** Enter a buy position within the 3240.00–3250.00 range. Place stop loss at 3207.00 to limit downside risk. Target progressive take-profit levels, with the 5th TP at 3347.38 as a stretch goal near the daily high. Monitor price action closely and adjust trailing stops to lock in profits as targets are hit. Ensure risk-reward ratio aligns with your trading plan.

XAUUSD/GOLD 1H SELL PROJECTION 08.05.25Bearish setup on XAUUSD (Gold vs. USD) with a strong indication for a potential short/sell opportunity based on several technical signals:
Key Observations:
Three Black Crows Pattern:
Clearly marked and highlighted on the chart.
This is a classic bearish reversal pattern indicating strong selling pressure.
Break of Neckline:
The price has broken below a previously established neckline area, confirming bearish momentum.
Support Becomes Resistance:
The neckline zone (~$3350.880) is now acting as resistance after the breakdown, further validating the short setup.
Target Levels:
Support S1 around $3330.
Support 2 near $3311.354 – likely the final target area for the sell projection.
Stop Loss Zone:
Clearly marked at $3362.631, above the broken support (now resistance).
Summary:
Entry Zone: Around current price (~$3344)
Stop Loss: $3362.63
Take Profit Zones:
TP1: ~$3330 (Support S1)
TP2: ~$3311.35 (Support 2) bearish setup on XAUUSD (Gold vs. USD) with a strong indication for a potential short/sell opportunity based on several technical signals:
Key Observations:
Three Black Crows Pattern:
Clearly marked and highlighted on the chart.
This is a classic bearish reversal pattern indicating strong selling pressure.
Break of Neckline:
The price has broken below a previously established neckline area, confirming bearish momentum.
Support Becomes Resistance:
The neckline zone (~$3350.880) is now acting as resistance after the breakdown, further validating the short setup.
Target Levels:
Support S1 around $3330.
Support 2 near $3311.354 – likely the final target area for the sell projection.
Stop Loss Zone:
Clearly marked at $3362.631, above the broken support (now resistance).
Summary:
Entry Zone: Around current price (~$3344)
Stop Loss: $3362.63
Take Profit Zones:
TP1: ~$3330 (Support S1)
TP2: ~$3311.35 (Support 2)

GOLD IN PLAY - RISKY ROADS AHEAD BUT GOLD KEEPS SURGINGSymbol - XAUUSD
CMP - 3468
Gold continues to show strength, testing resistance within the established range, with bullish momentum persisting. The price has moved above the flat consolidation line and entered the buying zone, further progress now depends on the actions of the bulls.
The metal is advancing for a second consecutive session, supported by a weakening of US dollar, heightened demand for safe-haven assets, and intensifying geopolitical tensions in the Middle East and Eastern Europe.
Market sentiment remains fragile due to trade-related uncertainties and regional instability across Asia, as investors look ahead to forthcoming Federal Reserve decisions and remarks from Powell.
Gold is currently breaking out of its previous neutral range. Immediate attention is on the 3369 level and nearby resistance at 3381. The macroeconomic environment remains favorable for gold. If bullish positions are maintained above these key thresholds, upward continuation remains likely.
Resistance Levels: 3369, 3381, 3408
Support Levels: 3352, 3330
A potential retest of the local liquidity zone around 3352, possibly triggering a long squeeze, cannot be ruled out prior to a resumed upward move. For now, the focus remains on the 3369–3370 area, which currently serves as a critical support zone.

XAUUSD
ALWAYS TAKE TRADE WITH CONFIRMATION
Note : Trading in any financial market is very risky. I post ideas for educational purpose only. It is not financial advice. Do not hold us responsible for any potential loss you may incur. Please consult your financial adviser before trading.

Gold Short Trade Analysis for Swing TradingMarket Overview
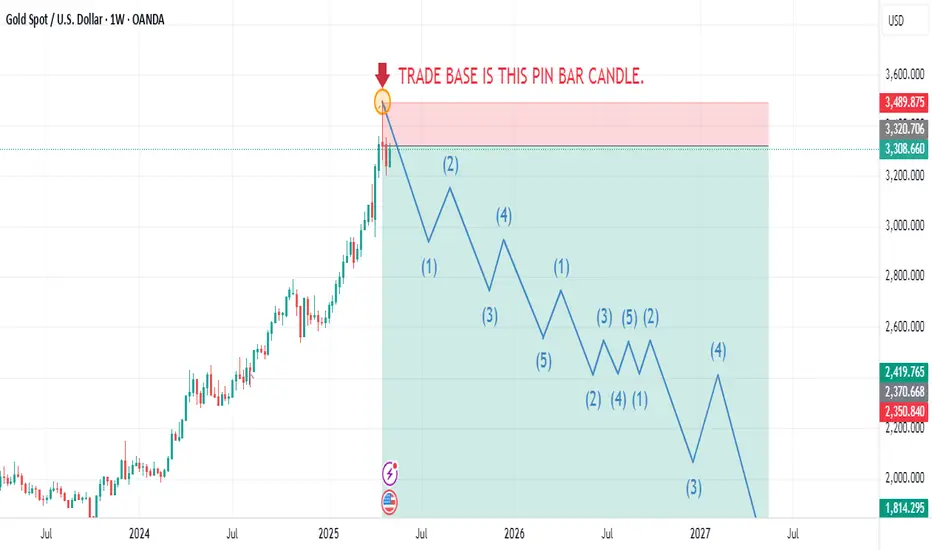
Gold (XAU/USD) has exhibited a bullish rally in recent times, but a recent pin bar formation on the weekly chart signals a potential reversal. With a 95% confidence level based on technical analysis, the market is poised for a significant downturn over the next two years. The current momentum remains slightly bullish, but failure to breach the $3,500.00 resistance level will likely trigger a substantial decline in gold prices, making it an opportune moment for swing traders to consider short positions.
Price Predictions
Based on the provided projections, the following key price levels are anticipated for gold over the next two years:
Mid-July 2025 : Gold prices are expected to peak near $3,000.00, marking a potential high for the year.
Mid-November 2025 : Prices are forecasted to decline to approximately $2,740.00.
End of March 2026 : A further drop is anticipated, with prices reaching around $2,560.00.
End of June 2026 : Gold is expected to form a low around $2,408.00.
June to September 2026 : The market is likely to trade in a range-bound pattern, with no significant directional movement.
End of September 2026 : A breakout from the range is expected, potentially setting the stage for further declines.
End of December 2026 : Gold prices are projected to fall to approximately $2,053.00.
April 2027 : The downtrend is expected to continue, with prices dropping to around $1,814.00.
Technical Analysis
The recent pin bar on the weekly chart is a strong bearish signal, indicating rejection at higher price levels. This suggests that the bullish rally may have exhausted its momentum. The critical resistance level to watch is $3,500.00. If gold fails to break above this level, it will likely confirm the bearish outlook, leading to a sustained decline. The projected price levels align with key support zones, reinforcing the potential for a prolonged downtrend.
Swing Trading Strategy
Swing traders can capitalize on this bearish outlook by initiating short positions at strategic price points. Below is a suggested approach:
Entry Point : Consider entering a short trade near $3,000.00 in mid-July 2025, as prices approach the projected peak. Alternatively, wait for a confirmation of rejection at $3,500.00 if prices rally higher.
Stop Loss : Place a stop loss above $3,500.00 to protect against an unexpected bullish breakout.
Take Profit Levels :
First target : $2,740.00 (mid-November 2025).
Second target : $2,560.00 (end of March 2026).
Long-term target : $2,053.00 (end of December 2026) or $1,814.00 (April 2027).
Position Sizing : Use proper risk management, risking no more than 1-2% of the trading account per trade.
Monitoring : Watch for range-bound movement between June and September 2026, as this may require adjusting positions or temporarily exiting the trade.
Risk Factors
While the bearish outlook is supported by technical signals, traders should remain cautious of the following risks:
Geopolitical Events: Sudden global events could drive safe-haven demand for gold, pushing prices higher.
Economic Data: Changes in interest rates or inflation could influence gold prices unexpectedly .
Market Sentiment: A shift in investor sentiment could delay or alter the projected downtrend.
Conclusion
The formation of a pin bar on the weekly chart, combined with the failure to break $3,500.00, suggests that gold’s bullish rally is likely over. Swing traders can take advantage of the anticipated downtrend by shorting gold at key resistance levels and targeting the projected price declines over the next two years. By employing disciplined risk management and closely monitoring market developments, traders can position themselves for significant returns as gold prices trend lower.
GOLD EYEING A BOUNCE - BULLS PUSH BACK AS DOLLAR DIPSSymbol - XAUUSD
CMP - 3260
Gold is currently forming a local bottom and is not poised to continue its downward trajectory. The price is breaking through downward resistance, driven by a weakening US dollar and a complex fundamental environment.
At the start of the week, gold stabilized above the 3250 mark as investors gravitated toward defensive assets in response to ongoing uncertainties surrounding US trade negotiations with China and Japan, coupled with escalating geopolitical tensions in the Middle East and Ukraine.
The dollar’s weakness, ahead of the Federal Reserve meeting, alongside diminishing expectations for an interest rate cut, is further supporting gold’s demand. The market’s focus remains on developments regarding US trade policies and the potential for a more hawkish stance from the Fed in the coming week.
From a technical standpoint, gold is testing the bottom of the trading range as resistance. Should there be no significant reaction to a false breakout and the price continues to challenge the 3268 level, a breakout and subsequent consolidation above this point could pave the way for further gains, with potential targets at 3292 and 3314
Resistance levels: 3269, 3294, 3314
Support levels: 3243, 3222, 3204
The price is currently undergoing a second test of the 3269 resistance level since the session commenced. Buyers are actively testing this resistance for a potential breakout. If the bulls manage to break through 3269 and establish a solid consolidation above the 3271 level, the outlook for further growth would be favorable. However, a retest of the liquidity zone at 3243 remains a possibility before any sustained upward movement.

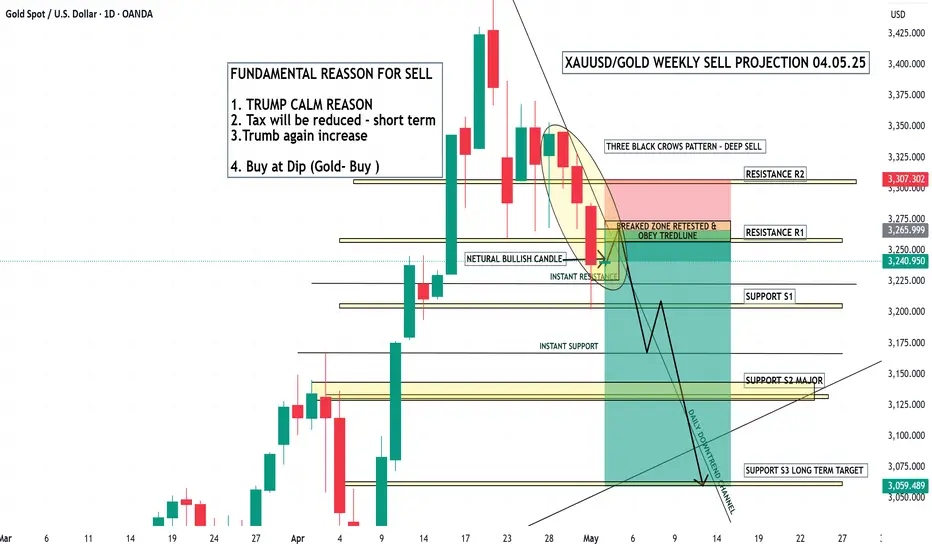
XAUUSD/GOLD WEEKLY SELL PROJECTION 04.05.25Leaving technical factors aside, in layman's view, gold is falling because investors have realized the high valuation of gold compared to other precious metals and are booking profits.1 day ago
WAITING GAME - GOLD STUCK IN A HOLDING PATTERNSymbol - XAUUSD
CMP - 3307
Gold continues to consolidate within a defined range, with immediate attention on the 3370–3269 zone. With key economic data scheduled for release, the metal is expected to remain within this consolidation band for the next several sessions.
Renewed optimism surrounding US trade negotiations has lifted risk sentiment and strengthened the US dollar. The US Treasury Secretary reported constructive progress in discussions with India, while President Trump’s more measured rhetoric regarding China further supported the dollar. Meanwhile, investors are adopting a cautious, wait-and-see approach ahead of the release of first-quarter US GDP data. Should the data underwhelm, gold may experience a sharp uptick as safe-haven demand intensifies.
Overall, the gold market remains highly reactive to trade headlines and macroeconomic indicators, particularly amid anticipated portfolio adjustments at month-end. In the context of current momentum and corrective movement, a short-term recovery is anticipated from the 0.5–0.7 Fib zone. A possible retest of the 3323–3325 resistance area could precede a continuation of the correction within the prevailing consolidation structure.
Key Resistance Levels: 3323, 3352, 3370
Key Support Levels: 3290, 3270
Traders remain attentive to both the resolution of ongoing tariff disputes and the forthcoming economic releases. While price action remains confined within a consolidation pattern, a rebound from support is the base case scenario. However, if price action continues to compress toward either boundary - particularly toward support, the probability of a breakout from the consolidation base may increase accordingly.

XAU/USD Outlook – Will This Tight Range Explode Soon?🔥 XAU/USD Outlook – Will This Tight Range Explode Soon?
📊 Technical Overview:
Gold (XAU/USD) has entered a consolidation phase after last week's sharp swings. The market is currently trapped within a tightening structure between 3,274 and 3,336, forming a potential wedge or triangle pattern. This type of structure often precedes a breakout.
Price is still hovering below the 200 EMA on the H1 timeframe, while key support zones are starting to show signs of buying interest. A hold above 3,301 could lead to a potential rally toward the upper resistance levels at 3,352 – 3,366.
🔺 Key Resistance Levels:
3,336.767
3,352.159
3,357.689
3,366.067
🔻 Key Support Levels:
3,301.370
3,291.885
3,274.779
🎯 Trade Setups:
🔵 BUY ZONE:
Entry: 3,274 – 3,276
SL: 3,270
TP: 3,284 – 3,291 – 3,301 – 3,336
🔴 SELL ZONE:
Entry: 3,357 – 3,366
SL: 3,370
TP: 3,336 – 3,301 – 3,291
📰 Today’s Market Focus:
No major economic data is expected today. However, markets may begin pricing in expectations ahead of this week’s key releases — ADP Employment Change and Nonfarm Payrolls (NFP).
Geopolitical tensions in South Asia and statements from FED officials may act as surprise catalysts for gold volatility.
🧭 Conclusion:
Gold remains stuck in a tight sideways channel. Traders should continue range trading while waiting for a confirmed breakout. A strong breakout above 3,366 or breakdown below 3,274 will set the tone for the next directional move.
👉 Trade smart and manage your risk. All eyes on U.S. data and geopolitical headlines!

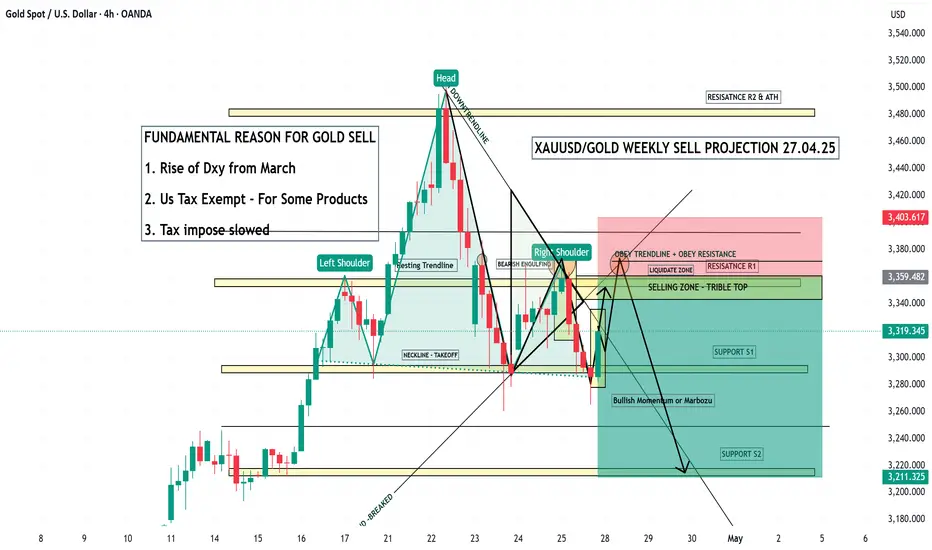
XAUUSD/GOLD WEEKLY PROJECTION 27.04.25Rise of the DXY (US Dollar Index) since March.
US Tax exemptions for some products.
Slower imposition of new taxes.
Technical Chart Summary:
Pattern: Head and Shoulders (classic bearish reversal setup).
Key Zones:
Selling Zone: Identified between Resistance R1 and Triple Top area.
Resistance Levels:
R1 near 3359–3400
Major resistance at around 3480–3500 (All-Time High zone).