XAU/USD – Buy Setup from Liquidity Sweep & Fibo 0.618📌 Structure Overview
• After a short-term bearish leg, price formed a sequence of ChoCH → BoS → ChoCH, signalling that selling pressure is losing momentum.
• The liquidity sweep at the 4,183 – 4,185 lows has reactivated buying interest.
• From this newly formed low, price retraced into the bearish OB above and is now correcting based on Fibonacci levels.
Overall structure leans toward accumulation – building a base before a potential recovery move.
🔍 Technical Analysis (SMC + Fibonacci)
• Key OB Zone:
The bearish OB at 4,228 – 4,241 remains a strong supply area — where price reacted on first touch.
• Fibonacci Retracement:
After the impulsive move 4,184 → 4,228, price is correcting toward standard retracement levels:
0.382
0.5
0.618
Notably: 0.618 overlaps with demand + liquidity zone → high reaction probability.
• Current Price Action:
Price is pulling back gently into the BUY zone, without forming new lower lows — confirming that selling pressure is fading.
🎯 Trade Plan – BUY Following Smart Money Flow
🟢 Primary BUY Zone: 4,184 – 4,186
✔ Confluence with Fibo 0.618
✔ Same area as liquidity sweep low
✔ Aligns with the recovery-trend demand zone
Stop Loss: Below 4,170 (clears all remaining liquidity underneath)
Short-Term Targets:
• TP1: 4,228 – first reaction zone
• TP2: 4,241 – bearish OB
• TP3 (extended): 4,256 – 4,258
Alternative Scenario:
If price breaks 4,241 convincingly and closes above it on M30 → bullish continuation is confirmed → extended targets at 4,270 – 4,280.
📌 Important Notes
• Avoid FOMO buying in the middle of the range; wait for demand + Fibo reaction.
• When price reaches 4,228 – 4,241, consider partial profits to protect gains.
• Structure becomes invalid only if price breaks below 4,170.
💬 Conclusion
Short-term bias favours a bullish pullback, with an optimal BUY setup around 4,184 – 4,186. If this zone holds, gold has room to extend its recovery towards 4,241 → 4,256+.
Xauusdupdates

XAUUSD: Rate Cut Storm Ahead! Is Gold Set to Soar?1. 📢 FUNDAMENTALS PUSHING PRICE
FED About to Cut Interest Rates (90%): Cooling U.S. economic data strengthens the expectation of a 25bps cut next week. This weakens the USD and supports Gold.
Geopolitical Risks: Russia-Europe tensions keep the safe-haven demand for Gold high.
Key Event: Watch PCE on Friday to better determine the Fed's monetary policy path.
2. 🎯 TECHNICAL ENTRY POINTS
The optimal strategy is to BUY ON DIPS at strong support:
Optimal Buying Zone (Discount Zone): $4,181 – $4,186. This is the ideal Long Entry Point.
Resistance/POC: $4,207. Important short-term level.
Upside Target: $4,240. Next profit-taking target.
👉 Conclusion: Be patient and wait for Gold to adjust to the $4,181 - $4,186 zone to enter a buy order with low-risk advantage, leveraging macro upward momentum.
#XAUUSD #GOLD #FED #InterestRateCut #GoldAnalysis

XAU/USD – Gold Accumulating Before Rising, Monitor BUY at📊 Market Structure
Gold is in an accumulation phase after a short-term drop creating ChoCH at lower price levels.
The current structure shows that the price has formed an Equal High (EqH) around 4,235 – a sign that the market may be holding liquidity above to support the next push.
The price returns to test the area 4,192 – 4,193 USD — this is the nearest support zone, and also the point where previous buying pressure created an upward BoS . If this area continues to hold, the short-term upward structure will be reactivated.
💎 Key Technical Zones
• Support Zone (Buy Zone): 4,192 – 4,193 USD
• Invalidation: below 4,170 USD
• Target 1: 4,237 USD
• Target 2: 4,249 USD
• Target 3: 4,264 USD
• Target 4: 4,284 USD
• Liquidity Zone: 4,323 USD
🎯 Trading Plan – BUY Priority
1️⃣ BUY Setup – Retest Support 4,192
If the price retests the area 4,192 – 4,193 and a bullish candlestick signal appears (rejection / engulfing):
• Entry: 4,192 – 4,193
• SL: 4,170
• TP1: 4,237
• TP2: 4,249
• TP3: 4,264
• TP4: 4,284
• TP5: 4,323 (sweep liquidity EqH)
→ This is a setup in line with the short-term trend, as liquidity above the EqH peak remains and is likely to be swept.
2️⃣ SELL Scalp – For Intraday Traders Only
If the price retests higher resistance zones and reacts with a strong decline:
• Waiting SELL Zone:
– 4,249
– 4,264
– 4,284
• Short TP: back to 4,225 – 4,216
→ This setup only trades against the trend when clear rejection is observed.
🧠 Vincent’s View
The current trend still supports the continuation of the upward expansion.
The 4,192 USD area is crucial: holding this area → prioritize BUY; losing this area → the market will need to sweep deeper before rising again.
⚡ “Follow the liquidity — the market always returns to collect what it left behind.”
⏰ Timeframe: 1H
📅 Update: 03/12/2025
✍️ Analysis by: Captain Vincent

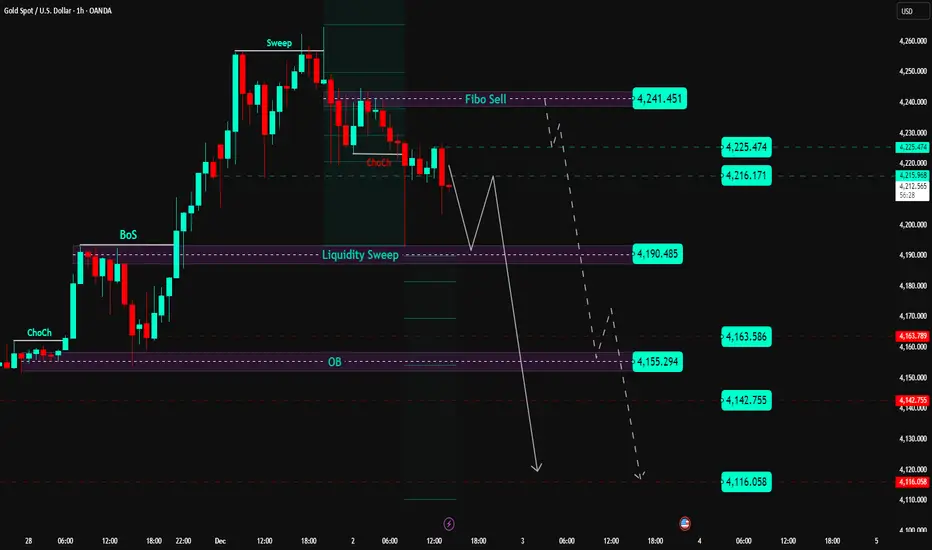
XAU/USD: Peak Sweep Done, Price Distributing in Premium📊 Market Structure
• After a strong bullish leg, Gold formed a clear Liquidity Sweep at the highs around 4,261 USD (Fibo Sell) , taking out all liquidity above that zone.
• From that high, price gradually weakened and printed a bearish ChoCH (loss of buying pressure; short-term structure no longer clean).
• Price is currently trading inside the premium zone between 4,190 – 4,241:
– 4,241 = Fibo Sell / liquidity extreme .
– 4,225 – 4,216 = lower premium zone , likely to react before retesting the highs.
– 4,190 = Liquidity Sweep + short-term support : only if price breaks below and retests from underneath will this zone flip into resistance for SELL continuation.
⇒ Current picture: short-term bearish bias , but sells should come from the premium zones (4,216–4,241) or only after a confirmed break of 4,190 — avoid chasing mid-range.
💎 Key Technical Zones
• Fibo Sell Zone: around 4,241.451 → optimal extreme for hunting SELL setups.
• Reaction Levels:
– 4,225.474
– 4,216.171
• Liquidity Sweep Support: 4,190.485 → main short-term support.
• Support / TP Zones:
– 4,163.586
– 4,155.294 (old OB)
– 4,142.755
– 4,116.058 (deeper low – extended target)
🎯 Trading Plan – SELL Priority From Premium
1️⃣ Primary SELL – Fibo Sell 4,241 & Premium 4,225–4,232
Ideal scenario: price retraces into the upper premium zone and prints a clear rejection signal (pin bar / engulfing / rejection volume).
• Entry 1: 4,225 – 4,232 (first scale-in)
• Entry 2: 4,235 – 4,241 (add if price sweeps higher)
• Stop Loss: above 4,250
• TP1: 4,190
• TP2: 4,163
• TP3: 4,155
• TP4: 4,142
• TP5: 4,116
→ Classic “sell the premium” setup: wait for price to return to the swept highs — avoid FOMO in the middle.
2️⃣ SELL Continuation – After Breaking 4,190
Only valid if we get a clear H1 close below 4,190 , confirming the Liquidity Sweep zone has been violated and flipped into resistance.
• Condition: H1 close below 4,190 → wait for a retest of 4,190–4,195 from underneath
• Entry: 4,190 – 4,195
• SL: above 4,205
• TP1: 4,163
• TP2: 4,155
• TP3: 4,142
• TP4: 4,116
→ This setup is only for traders who prefer clean continuation after a confirmed break of support.
3️⃣ Countertrend BUY – Only From Deep Zones
• Aggressive: watch for reactions at 4,163 – 4,155 . If strong rejection appears, consider a technical BUY retracement toward 4,190 – 4,216 (scalp).
• Conservative: wait for a deep test of 4,116 (stronger demand zone) before searching for BUY setups.
→ This is strictly countertrend; only take it if strong confirmation appears. Otherwise, skip and focus on SELL opportunities in premium zones.
🧠 Vincent’s View
Gold is currently “hanging” within premium after a very clean top sweep.
The safest strategy is to let price return to 4,225–4,241 before selling, or wait for a confirmed break of 4,190 to play continuation. Avoid selling directly at 4,190 while it still acts as support.
“Sell the premium, respect the levels – liquidity never lies.” ⚜️
⏰ Timeframe: 1H
📅 Updated: 02/12/2025
✍️ Analysis by: Captain Vincent
Gold Price at Critical Resistance Breakout or Rejection SetupChart Analysis (All Strategies Used)
1️⃣ Trend Analysis
Price is moving inside a descending structure, but recently broke above the short-term trendline, showing bullish momentum.
EMAs 70 & 200 are acting as dynamic support—bullish signal
2️⃣ Support & Resistance
Strong resistance zone: 4,228 – 4,236 (multiple rejections earlier).
Support zone: around the 4,195 – 4,200 region.
If price stays above support + EMAs, bullish continuation likely.
3️⃣ Breakout Strategy
Price is retesting resistance again.
A clean breakout above 4,236 can send the price toward the buying target: 4,263.60 🚀.
4️⃣ Rejection / Pullback Strategy
If price fails at 4,236 and rejects strongly, expect a drop back toward:
Support 4,195
Selling Target: 4,162 📉
5️⃣ EMA Strategy
Price is above both EMAs → trend favors buyers.
If price dips and closes below EMA 70 + EMA 200, selling pressure strengthens.
6️⃣ Risk–Reward Strategy
Buy setup: Break & retest above 4,236 → target 4,263.
Sell setup: Strong rejection at resistance → target 4,162.
Good RR on both sides depending on breakout vs. rejection.
📌 Final Summary
Price is at a critical resistance zone (4,236).
➡️ Breakout = BUY toward 4,263
➡️ Rejection = SELL toward 4,162 CME_MINI:MES1! CME_MINI:ES1! CBOT_MINI:YM1! CME_MINI:MES1! NSE:BANKNIFTY1! COMEX_MINI:MGC1! CME_MINI:MNQ1! COMEX:SI1! NYMEX:CL1! CME_MINI:NQ1!

Gold Pullback to Bullish OB, Watch for Buy at 4,170–4,155⏰ Timeframe: 30 minutes
📅 Update: 12/02/2025
🔍 Market Context
After gold surged from the 4,115 USD area, the price peaked at 4,256 USD, then a small Bearish OB appeared around 4,223 USD (Fibo area 0.618–0.786) – where the market reacted with a slight decline.
Currently, the price is in a technical pullback phase after a long rally, forming a bearish CHoCH and a small BoS, indicating the market is rebalancing liquidity before deciding the next direction.
However, the main structure (H1–H4) still maintains a bullish bias, so the current adjustment area is only technical – suitable for observing buy opportunities from lower levels.
📊 Technical Breakdown
Bearish OB – Fibo Sell (4,223): short-term supply area, first reaction down after the peak of 4,256.
Small BoS (4,205): confirms the adjustment structure has formed.
Bullish Order Block (4,170–4,155): main demand area confluence with Fibo 0.786–1.0 – where strong buying force may reappear.
Extended target: 4,256 → 4,271 (FE 1.272–1.618) if the uptrend continues.
💎 Key Levels
🟢 Support (Buy Zones):
• 4,205 USD → short-term balance area, may react quickly.
• 4,170–4,155 USD → main Bullish OB area, confluence with Fibo 0.786–1.0 – ideal reaction point.
🔴 Resistance (Sell Zones):
• 4,223 USD → small Bearish OB – short-term supply area.
• 4,256 USD → main peak, short-term profit-taking area.
• 4,271 USD → extended target, upper liquidity area.
🎯 Trading Plan
Main Scenario – BUY SETUP (priority):
Wait for price to adjust to 4,170–4,155 USD.
Observe for bullish reversal signals (CHoCH, engulfing, long rejection).
Target increase: 4,223 → 4,256 → 4,271 USD.
Alternative Scenario – Deeper Sweep:
If price breaks 4,155, expect further liquidity test at 4,138–4,130 USD, before bouncing back.
🧠 Analyst’s View
Gold is following the “pullback in an uptrend structure” model.
As long as the price stays above 4,155 USD, the larger trend remains bullish.
The reasonable scenario is to watch for reactions at Bullish OB 4,170–4,155 – this is the area with the highest probability for the next recovery.
⚙️ Reaction Plan
BUY zone: 4,170 → 4,155
TP1: 4,223 TP2: 4,256 TP3: 4,271
Invalidation: M30 candle closes below 4,155
🛡️ Risk Note
Limit orders between the area (4,205–4,215).
Only confirm the trend with clear structural signals at the OB area.
Analysis is purely technical – not investment advice.

GOLD IN HAND WITH FED'S PUSH: ADJUSTMENT IS AN OPPORTUNITY!Wonderful! I will create another headline focusing on market dynamics and fundamental factors, excluding specific price levels, but still maintaining appeal and information.
🐂 GOLD IN HAND WITH FED'S PUSH: ADJUSTMENT IS AN OPPORTUNITY! 🚀
1. Fundamental Push
Main Support Force: Expectations of a dovish Fed and weak US economic data (PMI ISM 48.2) are weakening the USD and increasing bets on a Fed rate cut in December, strongly supporting Gold.
Geopolitical risks remain a potential "lifeline."
2. Technical Analysis & Opportunity
The main structure (1H) remains an Uptrend. The current price drop is a Pullback.
Strategic BUY Zone (DPZ):
Range: $4,195.961 – $4,199.760 (Converging with the Uptrend Line).
Action: WAIT TO BUY (LONG) when a confirmed reversal signal appears in this zone.
Targets:
TP1 (Short-term): $4,219.953
TP2 (Long-term): $4,244.426
Stop Loss:
Set a safe SL below DPZ, for example: Below $4,190.00.
🔥 Conclusion: As long as XAU/USD holds above the Uptrend Line and DPZ, we prioritize seeking BUY opportunities to continue the main trend.
#XAUUSD #Gold #GoldAnalysis #ForexTrading #FED #USD #LongOpportunity #MarketStructure

What do you think about gold’s movement today?Hello traders!
What do you think about gold’s movement today?
Market Context
This morning, the Fed Chair delivered a speech without mentioning any economic updates. Despite that, gold still showed a corrective move, indicating that the SELL side remains dominant at the moment.
Main Strategy for Today
🔴 Prefer SELL setups
Stop selling only if price breaks above 4,246 — a key level defended by sellers.
Consider SELL entries at the previous high 4,265.
Additional SELL reaction zone to watch: 4,227 – 4,225.
BUY on deeper pullbacks
Ideal BUY zone: 4,194 – 4,190
BUY zone: 4,209 – 4,206
→ Only BUY if strong support reactions or reversal patterns appear.
🎯 Risk Management
Stop Loss (SL): 100 pips
Take Profit (TP): 100 pips
→ Maintain consistent risk throughout the session.
Do you think gold will continue to face bearish pressure and break lower,
or will it bounce from these deeper support zones and regain momentum?

WHAT ARE YOU DOING BUY OR SELL ?🧭 Market Context
Gold’s still running that bullish leg structure, respecting the rising trendline beautifully.
Right now, price is dancing around the mid-supply zone (4,225–4,245) — this zone is key because it’s where we’ll see whether smart money defends or dumps liquidity before the next push.
A reaction sell from this zone can drive price into the Buy-side GZ (4,195–4,180) marked below.
That’s the golden reload zone — and your low-risk, high-reward setup area.
LET ME KNOW WHAT YOU GUYS THING ABOUT IT I HAVEALREADY MARKED MY LEVEL AND HAVE SET LIMIT ORDER
TELL ME YOUR LEVELS

Resistance Rejection → Bearish Pullback Toward Support🟡 GOLD (XAU/USD) – Bearish Rejection from Major Resistance 🟥📉
🔍 Key Technical Insights
Price rejected the major resistance zone around 4,245 – 4,255
Rising Support Line has been broken → signals weakening bullish momentum ❌
Current structure favors a pullback toward demand area
Market seeking liquidity below recent swing lows 💰
🎯 Suggested Targets (with stickers)
Target Type Price Area Sticker
TP1 → Support Retest 4,210 – 4,215 🎯
TP2 → Demand Zone 4,195 – 4,205 📉💰
📌 TP1 is your high-probability target
📌 TP2 is for extended move if bearish momentum continues ⬇️
📌 Trade Setup Idea
📍 Sell Entry Zone:
➤ 4,238 – 4,245 (after failed breakout)
🎯 Take Profit:
➤ TP1: 4,215 🎯
➤ TP2: 4,200 📉💸
🧭 Overall Market Outlook
Factor Bias
Short-term Trend Bearish Pullback 🔻
Liquidity Downside targets in focus 💧
Resistance Reaction Strong rejection 🚫

TRADING PLAN XAUUSD 12/1/2025🔔 Hello everyone!
Let’s take a quick look at today’s market context and the trading plan for gold (XAUUSD).
📌 1. Market Context & Fundamentals
Gold has broken above the previous descending trendline and is maintaining a bullish structure on the H4 timeframe.
Bullish momentum is supported by several macro factors:
Expectations of a Fed rate cut in December.
Geopolitical tensions between the U.S. and Venezuela, as well as rising friction between Japan and China, which increases safe-haven demand.
Price may move sideways/pin during the session before continuing its broader uptrend.
2. Main Trading Idea: BUY BIAS
✅ Key BUY Zones
4190 – 4194
4150 – 4153
4105 – 4110 (deeper zone)
Nearest zone: 4210 – 4215
➡️ Each entry targets approximately 100 pips
3. Short-term SELL Reaction Zones (Scalping Only)
4250 – 4256 (recent high)
4294 – 4295
4300
4312 – 4315
➡️ Sell setups are only for quick scalps, not for holding long. Target ~100 pips
4. Expected Price Scenarios
If price pulls back to support → look for BUY setups aligned with the trend.
If price reaches strong resistance → only scalp SELL setups, avoid long holding.
Overall trend remains bullish, so BUY remains the primary strategy.
Summary
H4 Trend: Bullish
Trading Bias: Mainly BUY – SELL only at key resistance for scalps
Macro & geopolitical environment is supportive for gold upside.

XAU/USD: Buy Gold at 4,217 or FVG 4,182!📊 Market Structure
Gold continues to maintain a strong upward structure after creating a series of BoS continuously from the 4,156 USD region.
This morning's H1 breakout pushed the price above the short-term peak, confirming that the BUY side is in full control.
The price is currently returning to retest the Demand intraday 4,217 – 4,210 USD area — this is the first support area where buyers can continue to push the upward wave.
If the pullback is deeper, gold may reach the FVG 4,182 – 4,172 USD area, coinciding with fibo 0.5 – 0.618 → the most attractive discount area in this wave.
The main trend remains bullish as long as the price stays above:
• 4,217 – Demand 1
• 4,182 – FVG Discount
• 4,156 – Key Demand Zone
💎 Key Technical Zones
• Demand Zone 1: 4,217 – 4,210
• FVG Discount: 4,182 – 4,172
• Strong Demand (structure holding bottom): 4,156
• Target Zones:
– 4,285
– 4,309
– 4,321
– 4,342
– 4,369 (liquidity above peak)
🎯 Trading Plan – Prioritize BUY
1️⃣ BUY 1 – Retest Demand 4,217
When the price touches 4,217 – 4,210 with confirmation signals (long wick, H1 engulfing).
• Entry: 4,217 – 4,210
• SL: below 4,200
• TP1: 4,285
• TP2: 4,309
• TP3: 4,342
• TP4: 4,369
→ Quick setup – follow the momentum.
2️⃣ BUY 2 – Deep Pullback to FVG 4,182
In case the price shakes strongly before continuing to push the wave.
• Entry: 4,182 – 4,172
• SL: below 4,156
• TP: 4,217 → 4,285 → 4,342
→ This is the “best” price area to accumulate BUY in the session.
🧠 Vincent’s View
H1 shows a strong upward structure, clear momentum. The current adjustment is just a technical pullback before hitting the upper liquidity levels.
As long as gold stays above 4,182 – the trend remains bullish and the targets 4,285 – 4,342 are entirely feasible.
“Smart money buys the dip — not the hype.” ⚜️
⏰ Timeframe: 1H
📅 Updated: 01/12/2025
✍️ Analysis by: Captain Vincent

Gold Holds Strong Inside Trend Channel,Prepares for New ATH PushGold continues to maintain impressive bullish momentum, trading steadily within its rising trend channel. With structure firmly supported and macro sentiment leaning dovish, the market appears to be positioning for a new short-term ATH if liquidity aligns.
📊 Technical Outlook (M30 – MMF Flow)
Gold has respected the ascending channel perfectly, with each corrective leg finding buyers along channel midline and lower boundary.
The most recent impulse broke through the 4,23x region before pulling back into local liquidity.
Key Liquidity Zones
4,236 – 4,254 → Short-term supply reacting
4,218 – 4,220 → Minor demand zone
4,196 – 4,199 → Major BUY Zone (channel support + imbalance fill)
Market structure remains bullish as long as price holds above 4,196, the confluence level where:
✔️ Demand zone
✔️ Trend channel support
✔️ Fibonacci retracement
all align.
A clean bounce from this zone could trigger the next expansion leg.
🎯 MMF Trading Plan – BUY Priority
Scenario 1 – Continuation Bounce
Entry (Buy): 4,218 – 4,220
SL: 4,210
TP: 4,254 → 4,272 → 4,281
Scenario 2 – Strong Liquidity Sweep BUY (Preferred for RR)
Entry (Buy): 4,196 – 4,199
SL: 4,188
TP: 4,236 → 4,254 → 4,281
SELL Trades
Only scalp sells at supply zones
(4,254–4,257 / 4,281–4,283)
→ Not a main strategy while trend remains bullish.
⚜️ MMF View
Gold is showing healthy bullish structure, with clear liquidity engineering and controlled corrections.
As long as price stays within the trend channel and above 4,196, the path of least resistance remains up.
A breakout toward 4,281+ is highly likely before any deeper correction.
“In bullish markets, the best trades come from buying the dip—never chasing the pump.”XAU/USD – Gold Holds Strong Inside Trend Channel, Prepares for New ATH Push
Gold continues to maintain impressive bullish momentum, trading steadily within its rising trend channel. With structure firmly supported and macro sentiment leaning dovish, the market appears to be positioning for a new short-term ATH if liquidity aligns.
📊 Technical Outlook (M30 – MMF Flow)
Gold has respected the ascending channel perfectly, with each corrective leg finding buyers along channel midline and lower boundary.
The most recent impulse broke through the 4,23x region before pulling back into local liquidity.
Key Liquidity Zones
4,236 – 4,254 → Short-term supply reacting
4,218 – 4,220 → Minor demand zone
4,196 – 4,199 → Major BUY Zone (channel support + imbalance fill)
Market structure remains bullish as long as price holds above 4,196, the confluence level where:
✔️ Demand zone
✔️ Trend channel support
✔️ Fibonacci retracement
all align.
A clean bounce from this zone could trigger the next expansion leg.
🎯 MMF Trading Plan – BUY Priority
Scenario 1 – Continuation Bounce
Entry (Buy): 4,218 – 4,220
SL: 4,210
TP: 4,254 → 4,272 → 4,281
Scenario 2 – Strong Liquidity Sweep BUY (Preferred for RR)
Entry (Buy): 4,196 – 4,199
SL: 4,188
TP: 4,236 → 4,254 → 4,281
SELL Trades
Only scalp sells at supply zones
(4,254–4,257 / 4,281–4,283)
→ Not a main strategy while trend remains bullish.
⚜️ MMF View
Gold is showing healthy bullish structure, with clear liquidity engineering and controlled corrections.
As long as price stays within the trend channel and above 4,196, the path of least resistance remains up.
A breakout toward 4,281+ is highly likely before any deeper correction.
“In bullish markets, the best trades come from buying the dip—never chasing the pump.”

GOLD EXPLOSION: XAUUSD READY TO ACCELERATE!📰 BASIC SUMMARY (FA): PRESSURE ON USD AND SAFE HAVEN DEMAND
Gold is receiving strong support thanks to:
FED DOVISH: Recent comments from FED Governors (Waller, Williams) and information about Kevin Hassett potentially taking the position of FED Chairman (supporting strong rate cuts) are boosting expectations for rate cuts, weakening the US Dollar (USD).
GEOPOLITICS/ECONOMICS: News about conflicts in the Black Sea and weakening Chinese manufacturing data (PMI decline) reinforce Gold's safe haven role, pushing prices to a 6-week high.
📈 TECHNICAL ANALYSIS (TA): MAINTAINING UPWARD STRUCTURE
The 2H chart shows Gold in a clear UPWARD trend (with multiple BOS). The optimal strategy is to wait for price adjustments to the key demand zone:
Action: ENTRY (BUY)
Price Range: $4,185 – $4,192 (Breakout/Demand zone established. Wait for confirmation here.)
STOP LOSS (SL): Below $4,160.9 (Invalidates upward structure if price breaks.)
TARGET 1 (TP): $4,244.8 (Nearest resistance.)
TARGET 2 (TP): $4,270.1 – $4,276.1 (Main growth target.)
Strategy: Patiently wait for a Pullback to the $4,185 – $4,192 zone to enter a LONG position following the trend.
⚠️ IMPORTANT ECONOMIC CALENDAR:
Pay attention to the US ISM Manufacturing PMI data and other macro reports this week to assess USD momentum.
#XAUUSD #GOLD #GoldAnalysis #FED #Dovish #Uptrend #MarketStructure #TradingView #Forex

GOLD EXPLOSION: READY TO CONQUER NEW HEIGHTS?I. HOT NEWS 💥
Gold is experiencing its 4th consecutive monthly increase, reaching $4,192.78/oz (closing on 11/28) thanks to significant changes from the Fed.
Interest Rate Reversal: Recent statements from the Fed Governor have increased the probability of a rate cut in December 2025 to 89% (up from 50% last week).
Gold Connection: A low-interest-rate environment is a paradise for Gold, propelling it to become a safe-haven asset. The fundamental momentum is EXTREMELY STRONG.
II. TECHNICAL ANALYSIS 📊
The price is approaching a critical supply zone. The current strategy is Buy on Dip with higher targets.
Short-term Resistance Target (PDI):
Price Range: $4,210 – $4,235
Strategy: Short-term resistance, requires a decisive Breakout to continue the upward momentum.
Ultimate Target (FVG):
Price Range: $4,260 – $4,330
Strategy: The next potential profit-taking target for Smart Money. Main Long target.
Strong Demand Zone (OB - Order Block):
Price Range: $4,046 – $4,064
Strategy: Strategic support (Demand Zone). A safe buying area if the price corrects deeply.
III. CONCLUSION & RISKS 🎯
Market Sentiment: Strongly BULLISH thanks to momentum from the Fed.
Focus: Monitor price action around $4,235. If surpassed, $4,330 is not far off.
Warning: Always manage risk (SL) tightly. Do not trade without Price Action confirmation!
#XAUUSD #GOLD #FOREX #FedDovish #RateCuts #SMC #OrderBlock #FVG #BullishTrend #TradingView

“BOS Confirmed — Demand Retest for Next Bullish Leg🟡 GOLD (XAU/USD) – Bullish Continuation Setup from High Probability Demand Zone 🆙
🔍 Chart Breakdown & Key Insights
Price created a Break of Structure (BOS) to the upside → confirming bullish momentum ✔️
Retested the Demand Line + Support Zone → buyers defending strongly 💪
High Probability POI (previous accumulation zone) remains valid with liquidity swept below → smart money accumulation evidence 💰
Current pullback = healthy retracement into demand before potential continuation
🎯 Targets (With stickers)
🎯 Target Zone Price Region Sticker
TP1 → Retest recent high 4,165 – 4,175 🎯
TP2 → Liquidity above highs / extended target 4,180 – 4,195 🚀💸
TP1 hit possibility is HIGH due to bullish structure 📈
TP2 depends on strength of breakout ⬆️
📌 Trade Idea (High Probability Setup)
🟩 Buy Entry Zone:
➤ 4,120 – 4,130 (pullback entry at support)
🟢 Take-Profit:
➤ TP1: 4,170 – TP2: 4,190
📊 Risk-Reward Ratio: 1:2.5 – 1:3+ ✔️
🧭 Market Structure Sentiment
Factor Outlook
Trend Bullish 📈
Liquidity Upside still available 💧
Smart Money behavior Accumulation & continuation expected 💼
⚠️ Just watch if price breaks below the demand line → would weaken this bullish plan.

GOLD broke out of the H4 trendline — real breakout or trap? Hello Traders! 👋
Gold has broken out of the H4 descending trendline, boosted by geopolitical tension and a weaker USD.
But the real question is: Is this a true breakout or just FOMO before a drop?
Here are the key zones I’ll be watching today:
BUY Zones (SL 10 – TP 10)
• 4165 – 4155
• 4170 – 4175
• 4140 – 4145
• 4110-4108
• 4099-4096
SELL Reaction Zones (SL 10 – TP 10)
• 4200 – 4203
• 4212 – 4215
• 4230-4035
• 4245 – 4247
👉 If price breaks below 4133, the trendline fails → potential sell-continuation setup.
📌 Bias: BUY is the main play — SELL only for short reaction scalps.
💬 What do YOU think — real breakout or classic bull trap? Drop your thoughts below!
❤️ Let’s discuss & grow together!

USD Stunned: Buy Gold at the Adjustment Bottom!1. Fundamentals Quick Take
US Data: Positive (Jobless Claims 216K, lowest in 7 months, Durable Goods +0.5%).
Fed Policy: Extremely Dovish. Fed officials hint at a 25bps rate cut as early as December.
Impact: Low interest rate expectations push DXY down: Strong support for Gold.
2. Technical Outlook - H1
Trend: Strong Uptrend.
Position: Price is below Resistance/Supply (CP Zone - around 4,175 - 4,195). High likelihood of short-term adjustment.
Strategy: Focus on BUY (Long) at strong Demand/Support zones, do not Short based on short-term reactions.
Ideal Long Zone: Around 4,129 or 4,096.
Conclusion: Wait for price to adjust to the Demand zone to enter Long orders following the main trend, based on the USD's decline momentum from Fed signals.
#XAUUSD #Gold #Fed #DXY #TradingView

XAU/USD: Gold Stagnates, Poised for a Strong Surge📊 Market Structure
Gold is moving in a tight accumulation phase (compression) between two important zones:
• OB Support: 4,130 – 4,126
• Resistance – Small Supply: 4,148 – 4,166
The previous trend remains a strong uptrend (clear BoS sequence from 4,089), and currently, the price is retesting the newly formed peak-bottom structure.
The BUY side is still in control as long as the price stays above:
• 4,130 – Main OB Support
• 4,104 – Discount FVG
• 4,089 – Key Low Confirming Trend
If gold holds these zones, the next targets will be the upper liquidity levels:
• 4,166
• 4,181
• 4,207
• 4,243
💎 Key Technical Zones
• OB Support 1: 4,130 – 4,126
• FVG Zone: 4,104 – 4,089 (best discount)
• Deep Bearish OB: 4,060 – 4,045 (if price drops sharply)
• Upper Liquidity Targets: 4,166 → 4,181 → 4,207 → 4,243
🎯 Trading Plan (Priority BUY)
1️⃣ BUY 1 – Retest OB 4,130
When the price touches the OB support zone 4,130 – 4,126 and shows a bounce signal (rejection / engulfing).
• Entry: 4,130 – 4,126
• SL: below 4,115
• TP1: 4,166
• TP2: 4,181
• TP3: 4,207
• TP4: 4,243
→ Quick setup, good RR, trend aligned.
2️⃣ BUY 2 – Discount FVG 4,104 – 4,089
This is the best BUY zone if the market drops sharply before rising.
• Entry: 4,104 – 4,089
• SL: 4,070
• TP1: 4,166
• TP2: 4,181
• TP3: 4,207
• TP4: 4,243
→ Strong confluence: FVG + fibo discount + key liquidity.
3️⃣ BUY 3 – Deep Accumulation at Bearish OB Shift
• Entry: 4,060 – 4,045
• SL: 4,020
• TP: 4,104 → 4,166 → 4,207
→ Only activate if “flush liquidity” appears.
🎯 SELL Scalp (secondary – not priority)
Only SELL when there is a clear rejection reaction at:
• 4,166 – first liquidity sweep zone
• 4,181 – strong reaction zone
• 4,207 – main bearish OB
• 4,243 – large liquidity peak
• SL: 10–15 USD
• TP: 4,148 → 4,130
→ For scalpers only, not a main setup.
🧠 Vincent’s View
The market structure remains completely bullish. The market is accumulating energy in a narrow range before breaking strongly to the upper liquidity targets.
As long as gold stays above 4,089 – the uptrend remains dominant.
“Patience builds the entry – liquidity completes the move.” ⚜️
⏰ Timeframe: 1H
✍️ Analysis by: Captain Vincent

XAU/USD – Gold Holds Above Key Support as Pullback Stays LimitedGold remains capped below its two-week high during the Asian session, but the downside is clearly limited.
Market sentiment is shaped by:
A weaker USD as dovish Fed expectations gain traction
Rising probability of rate cuts in upcoming meetings
Improving global risk sentiment amid hopes of progress in Russia–Ukraine negotiations
Even though Gold is retracing, the bigger picture remains bullish as long as price holds above key support zones.
📊 Technical Outlook – MMF Trading Style (M30/H1)
Price is currently consolidating below the resistance cluster 4,156 – 4,170, retracing into multiple demand zones.
Key Levels to Watch
Support 1: 4,131 – 4,137
Support 2: 4,115 – 4,118
Support 3 (major liquidity): 4,083 – 4,090
Main Resistance: 4,170 – 4,193
Market structure shows a clean zigzag pullback, suggesting a potential bullish continuation once liquidity is collected below.
🎯 MMF Intraday Trading Plan
Scenario 1 – Buy the Dip (Primary Bias)
Best trade today: Buying retracements into demand.
BUY: 4,115 – 4,118
SL: 4,103
TP: 4,131 → 4,156 → 4,170
BUY (extended liquidity sweep): 4,083 – 4,090
SL: 4,070
TP: 4,118 → 4,145 → 4,170 – 4,193
Reason: Fibo confluence + strong demand + liquidity zone = high-probability reversal area.
Scenario 2 – Short-Term SELL (Scalp Only)
Only valid if price rejects strongly at resistance.
SELL: 4,156 – 4,170
SL: 4,177
TP: 4,145 → 4,131
This is not the main bias today.
⚜️ MMF Trading View
Gold is forming a healthy pullback—not, at this stage, a bearish reversal.
As long as price stays above 4,08x, the bullish structure remains intact.
“In Gold, the goal isn’t chasing the breakout — it’s waiting for price to return to value.”
Today’s focus: Prefer BUY setups on retracement – SELL only for quick scalps.

XAUUSD BUY OR SELL TODAY?1. Main Market Context for Today
Jobless claims came in better than expected → USD strengthens, but gold did not drop — it continued to move sideways → the market is in accumulation and waiting for a breakout.
Today’s priority strategy is range trading:
Lower range: 4130–4135
Upper range: 4170–4175
Once price breaks clearly out of either range → switch to trend-following (pursuit) trading.
2. Range-Trading Plan (Primary Strategy for Today)
(A) Buy at the Lower Range – 413X Zone
Buy area: 4130–4135
SL: 100 pips
TP: 100 pips
Reason: This is the main demand zone and aligns with the ascending trendline shown on your chart.
➡️ Strategy:
Wait for price to “sweep” the lows → show confirmation → then take a quick BUY trade.
(B) Sell at the Upper Range – 417X Zone
Sell area: 4170–4175
Reason: Strong supply zone with repeated reactions.
➡️ Strategy:
Wait for a rejection candle (pin bar / bearish engulfing) → then SELL.
3. Current Reaction Zone – 414X
This is the zone price is currently testing.
Do not enter immediately; just observe:
If price bounces strongly from 414X → target is to retest 417X
If 414X breaks → price will likely retest 413X → better BUY entries there.
4. Deeper BUY Zones (If Price Breaks Downward)
Here are the levels you mentioned, organized clearly:
BUY Zone
4110–4108
4102–4100
4096–4094
→ These are deeper liquidity zones below the main range, activated only if gold breaks below 413X.
5. SELL Zones if Price Breaks Upward (Above 417X)
SELL Zone
4202–4200
4194–4190
4183–4180
→ These are upper supply retest zones, activated only after price breaks above 417X.
🟨 6. Main Scenarios for Today
Scenario 1 – Expected Sideway (Highest Probability)
Price moves within 413X – 417X, bouncing between the range limits.
→ Trade the range (scalp/intraday).
Scenario 2 – Break Below Range
If 4130 breaks → price will head to 4110 → 4100 → 4094
→ BUY at deeper zones.
Scenario 3 – Break Above Range
If 4175 breaks → price will aim for 4183 → 4194 → 4200–4202
→ SELL at higher zones.
✅ One-Line Trading Summary
Trade primarily within the 413X–417X range (buy low – sell high). If the range breaks, switch to trend-following using the deeper BUY zones or higher SELL zones provided above.

Gold (XAU): Fed Cut Incoming? Breakout Time!I. 📰 FUNDAMENTAL ANALYSIS (FA)
The Vibe: The US Dollar (DXY) is facing serious heat! The US Fed's recent dovish signals are a major tailwind for non-yielding Gold.
Fed's New Tune: Big guns like Governors Williams and Waller are now talking about rate cuts soon. Why? Because US economic data (Retail Sales, Consumer Confidence) is getting weaker, boss.
Market Buzz: The market is pricing in a strong nearly 85% probability of a 25bps rate cut in December. Picture clear, right?
Takeaway: This shift is Massively Bullish for Gold because lower interest rates make the Dollar less attractive.
II. 📈 TECHNICAL ANALYSIS (TA)
The Scene: Gold is currently bumping heads with a major hurdle – the Discount Zone (our supply zone). The real action is here!
Crucial Resistance: Gold is testing the Discount Zone (the main resistance area). This is the make-or-break level.
The Short Game (Bearish): Wait for a clear rejection signal at this resistance zone. If it holds, a correction is coming.
The Long Game (Bullish): For Gold to go on a proper rally, it needs a Strong Breakout and Close above the entire resistance area.
💡 THE STRATEGY
Focus on the Resistance Level: Trade based on Confirmation, whether that's a reversal signal for a short correction, or a strong breakout for a fresh long position.
Don't miss the US data tonight (Durable Goods/Jobless Claims) – it will be the real fire starter!
#GoldTrading #XAUUSD #ForexIndia #FedRates #DovishFed #TechnicalAnalysis #MarketUpdate #FinanceIndia

XAU/USD – Gold Maintains Uptrend, Monitor Reaction at FvG⏰ Timeframe: 30m
📅 Update: 25/11/2025
🔍 Market Context
After breaking the downtrend structure and creating consecutive bullish CHoCH, gold is maintaining above the Break–FvG zone at 4,107 USD, indicating that buying pressure is still controlling the recovery phase.
The price is in a reaccumulation phase after the break, and it is likely to need a short pullback to "gain momentum" towards the extended resistance zone above.
📊 Technical Structure
FvG Zone (4,107 USD): newly formed balance zone – acts as the main BUY Zone, where price reactions can be observed for quick scalping opportunities.
Break Structure: confirms active buying flow after a series of CHoCH, shifting short-term bias to bullish.
Target Expansion: the 4,188 → 4,228 USD range is an extended resistance band, coinciding with Fibonacci 1.272–1.618.
💎 Key Levels
🟢 Main Support (Support Zones):
• 4,067 USD – technical balance bottom, the last defense zone.
• 4,084 USD – secondary support, confluence with Fibo 0.382.
• 4,107 USD – main FvG zone, monitor reaction for buy scalp.
• 4,131 USD – dynamic support in the recovery cycle.
🔴 Resistance (Resistance Zones):
• 4,155 – 4,165 USD → intermediate resistance zone, potential short-term profit-taking when price reacts.
• 4,188 USD → confluence with Fibo 1.272 – short-term SELL Zone.
• 4,203 – 4,211 USD → extended supply zone, monitor reaction before the US session.
• 4,228 USD → extended resistance, the final target of the current uptrend.
🎯 Market Outlook
1️⃣ Priority Scenario:
– Price may retest the FvG zone – 4,107 USD, then bounce to test resistances 4,155 → 4,188 → 4,228.
– Prioritize monitoring reactions – quick scalping at resistance zones, avoid holding long positions as price approaches 4,211–4,228.
2️⃣ Alternative Scenario:
– If price closes below 4,107 USD, it may reopen the lower balance zone around 4,067 USD.
🧠 Analyst’s View
The market structure leans towards bullish continuation, but the upper zone is approaching a dense resistance cluster – suitable for reactive trading strategies:
→ Observe reactions at each zone to "scalp with the flow," rather than trying to hold the trend.
As long as price maintains above 4,107 USD, the priority remains buy-the-dip – take-profit-on-resistance.
🛡️ Risk Note
Short-term volatility is expanding – clear candle reaction confirmation is needed before taking action.
Analysis is for technical and educational purposes, not investment advice.
