GOLD (XAU/USD): THE BATTLE OF NFP AND FED!1️⃣ TECHNICAL VIEW (TA): Awaiting Sell Confirmation
Structure: The short-term uptrend has ended, prices are adjusting/reversing.
Main Supply Zone (Order Block - OB): Prices are retracing to the ideal sell zone (around $4,064 - $4,081).
Strategy: Prioritise seeking SELL signals at the OB zone.
Target: $3,976 and $3,931 if the OB zone holds.
2️⃣ FUNDAMENTAL VIEW (FA): Interest Rate Pressure
Selling pressure is increasing from:**
Fed Rate Cut Expectations Dwindle: The probability of a 25bps rate cut in December has fallen below 50%. The "Higher for Longer" signal reduces Gold's appeal.
Upcoming Risks: The market awaits NFP and FOMC Minutes. Strong data will bolster USD and sink Gold.
⚠️ Opposing risk: Uncertainty from the US Government shutdown and geopolitical tensions (Russia/Ukraine) may restrain the decline.
#XAUUSD #Gold #TradingSetup #SELLZone #Fed #NFP #PriceAction #SmartMoneyConcepts #Forex
Xauusdupdates

XAU/USD – Rebalancing Structure, Support Zone Holding Steady⏰ Timeframe: 30m
📅 Update: 17/11/2025
🔍 Market Context
After the extended decline late last week, gold is gradually stabilizing around the 4,050–4,080 USD zone, showing a positive reaction at the structural support zone.
The recent Break of Structure (BOS) sequence indicates that the selling momentum is gradually weakening, while the newly formed Order Block is acting as a temporary balance for the market.
The current structure slightly leans towards a technical recovery, as buying flows are returning around the main support zone.
📊 Technical Structure
Support Zone (4,049–4,080 USD): a critical support zone, confluencing with the previous liquidity bottom.
Order Block (4,096–4,115 USD): a short-term supply-demand area, potentially a retest point before the price expands higher.
Resistance Zone (4,145 USD): the first intermediate level to overcome to confirm upward momentum.
Target Zone (4,210 USD): the upper liquidity zone, corresponding to the potential expansion mark of the recovery wave.
🎯 Market Outlook
Priority scenario for the day:
1️⃣ Gold may retest the Order Block zone 4,096–4,115 USD before forming the first push up to 4,145 USD.
2️⃣ If buying pressure is maintained and this resistance zone is broken, the expansion momentum may head towards 4,210 USD, corresponding to a higher liquidity zone.
3️⃣ Losing the 4,049 USD mark will invalidate the recovery structure and bring the market back to a lower balance zone.
🧠 Analyst’s View
The market is currently in a reaccumulation phase after a strong correction.
Buyers still maintain a technical advantage as long as the price remains above the 4,049 USD support zone.
Observing price behavior around the Order Block and the 4,145 USD zone will be key signals to confirm the strength of this recovery wave.
🛡️ Risk Note
The current phase is a “pullback phase” within the larger structure.
Traders should wait for clear price behavior confirmation at technical zones rather than predicting movements in advance.

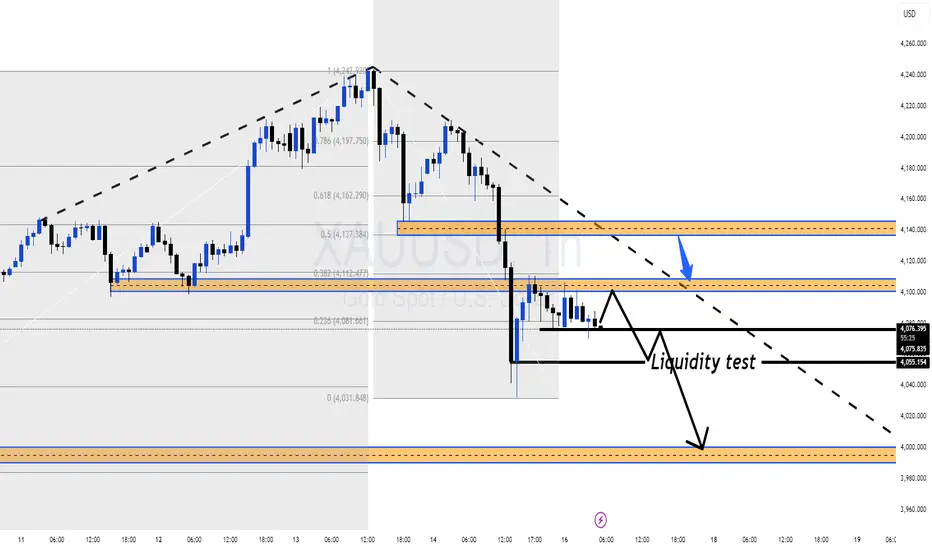
Gold Technical Rebound to FVG, Prioritise WATCHING FOR SELL at 4📊 Market Structure
Gold has completed a strong decline from the peak of 4.21x, leaving consecutive Break of Structure (BoS), confirming a short-term bearish structure.
The drop through the Breakout zone of 4.10x indicates a dominant selling force.
Currently, the price is bouncing from the Premium Zone 4.05x, aligning with the technical rebound behaviour after a strong sell-off.
The BUY side is merely pulling the price back to the abandoned liquidity zones (FVG 4.12x – 4.15x) before the SELL side can regain control.
The upper FVG zone is where the price often returns to fill after a steep fall. This is also the confluence zone between:
FVG (Fair Value Gap)
Old candle body Breaker
Fibonacci Premium
→ The risk of selling at these zones is very high.
💎 Key Technical Zones
Rebound zone for Sell
FVG 1: 4.101 – 4.126
FVG 2 (Strong Confluence): 4.126 – 4.150
Support zone – target to hit
Premium Zone $$$: 4.050 – 4.052
Lower FVG: 4.030 – 4.035
High probability price scenario: Rebound to FVG → reaction → continue to decline to 4.03x.
🎯 Trading Plan – Prioritise SELL
1️⃣ SELL Setup – High Probability
Wait for price to rebound to the above FVG zones:
Entry SELL:
4.118 – 4.126
Can add orders at higher: 4.140 – 4.150
Stop-loss: above 4.158
TP1: 4.101
TP2: 4.050
TP3: 4.030
✔️ This is a trend-following setup, selling at premium, adhering to SMC principles.
✔️ The current price is just beginning the rebound, not yet meeting BUY conditions.
2️⃣ BUY Setup – Only activate on deep Discount
Entry BUY: 4.030 – 4.035 (Lower FVG)
SL: below 4.020
TP: 4.070 – 4.100
→ BUY is only for counter-trend traders and must wait for a clear discount.
🧠 Vincent’s View
The market is in a distribution – decline phase, every rebound aims to pull liquidity.
As long as the price does not close above 4.150, SELL remains the optimal strategy for the day.
Observe closely when the price hits 4.12x – 4.15x, this is a “high-risk” zone for the BUY side and a “great opportunity” for the SELL side.
“Sell where the liquidity lives — that’s where institutions strike.” ⚜️
⏰ Timeframe: 1H
📅 Update: 17/11/2025
✍️ Analysis by: Captain Vincent

GOLD (XAU/USD): 2 Crucial Orders Before the NFP Storm!📉 Technical Analysis (SMC - 2H)
Trend: Decline after a clear MSS/BOS.
Focus: Price is retracing to the Selling Zone (Premium) to fill the FVG.
⚔️ Detailed Trading Plan (R:R > 1:2)
1. Priority Strategy: SELL Limit (Trend Following)
Entry: 4,157.782 (FVG Peak - Supply Zone)
Stop Loss (SL): 4,206.895 (Safe SL above the nearest structural peak)
Take Profit 2 (TP2): 4,051.733 (Main structural target - Nearest bottom)
Objective: Participate in the ongoing price decline.
2. Counter-trend Strategy: BUY Limit (Technical Rebound)
Entry: 4,051.733 (Nearest structural bottom - Support)
Stop Loss (SL): 4,018.699 (SL below lower FVG)
Take Profit 2 (TP2): 4,126.333 (Rebound to the upper FVG bottom)
Objective: Capitalise on the technical rebound from strong support.
🚨 Basic Risk: This Week's Focus
Hawkish Fed: Officials like Schmid assert high inflation, unwilling to ease policy, maintaining high interest rates (Negative for Gold).
Major News: FOMC Minutes (Wednesday) and especially NFP (Thursday) will determine the short-term momentum of USD/Gold.
Risk Management: Gold will be highly volatile from Wednesday. Adhere to SL and manage capital under 2% per order.
#Gold #XAUUSD #Forex #TechnicalAnalysis #FVG #SmartMoney #Fed #NFP #TradingView

Gold Still in Distribution, FOCUS ON SELL Setups at 4,10x–4,14x 🔍 Market Context
Risk sentiment remains fragile as investors reassess the global rate and stimulus story.
Goldman Sachs notes that rising worries about the size of Japan’s fiscal stimulus are bringing financial risk premia back, putting pressure on long-term JGBs and the JPY. Capital tends to rotate into USD and yield-bearing assets in this environment, which limits the upside for gold in the short term.
📊 XAU/USD Technical Structure (H1)
After topping around 4,242 USD, gold broke its short-term uptrend and is now moving in a descending structure.
Price is currently capped below the 0.5–0.382 Fibonacci area around 4,11x, which overlaps with a strong supply / Sell Liquidity zone on the chart.
Below price, we have a series of liquidity / support pockets:
4,098 – 4,077 – 4,048 USD: short-term downside liquidity levels.
OBS BUY ZONE around 4,00x: major demand zone where price previously launched a strong rally.
Current price action shows sellers still in control – every bounce into 4,10x–4,14x is being rejected quickly, which fits a “sell the rally” approach.
🎯 Trend-Following Trade Ideas (for reference)
Zones below are technical areas to watch, not signals or financial advice.
Scenario 1 – Shallow Pullback Sell
Sell Zone 1: 4,102 – 4,104
SL: 4,110
TP levels:
TP1: 4,098
TP2: 4,077
TP3: 4,048
Idea: Price makes a minor intraday pullback into local supply, then resumes selling pressure toward lower liquidity pockets.
Scenario 2 – Deeper Pullback into Fib/Trendline Confluence
Sell Zone 2: 4,142 – 4,144
(confluence of descending trendline + Fibonacci combo)
SL: 4,150
TP levels:
TP1: 4,133
TP2: 4,105
TP3: 4,088
TP4: 4,060
Idea: If the market grabs more upside liquidity first, the 4,14x zone offers a better R:R area to align with the H1 downtrend.
⚜️ MMFLOW TRADING View
As long as price stays below 4,14x and H1 structure keeps printing lower highs, gold remains in a distribution phase.
Pullbacks into the 4,10x–4,14x liquidity band are treated as opportunities to optimize SELL entries, while the 4,00x OBS BUY ZONE is the key area to reassess any potential larger bottoming process.
“In a downtrend, our job isn’t to call the bottom – it’s to use every weak bounce to sell from a better position.”
XAU/USD – Gold Slightly Adjusts, Monitoring Pullback to Support Hook: XAU/USD – Gold Slightly Adjusts, Monitoring Pullback to Support 4,151 USD
Body: 📊 Market Structure
After the Break of Structure (BoS) at the 4,208 USD region, gold confirms the continuation of the upward trend and is forming a technical adjustment.
The price has touched the Resistance Zone 4,208 – 4,237 USD and is currently adjusting as expected, heading towards the Support Zone 4,151 USD – which previously created an impulsive move.
Below Support 4,151, there is a strong OB at 4,104 USD.
As long as the price does not break deeply below 4,104 USD, the bullish structure remains intact.
💎 Key Technical Zones
• Resistance Zone: 4,208 – 4,237 USD → supply area + where a downward reaction occurs
• Support Zone: 4,151 USD → area awaiting upward reaction
• Strong OB + Support: 4,104 – 4,110 USD → base of the upward structure
• Liquidity Zone (Target): 4,260+ USD → next wave expansion area
🎯 Trading Plan
1️⃣ BUY Setup – Trend-following priority
If the price adjusts correctly to discount areas:
• Entry 1: 4,151 USD
• Entry 2: 4,104 USD (best area – confluence OB)
SL: below 4,090 USD
TP1: 4,208
TP2: 4,237
TP3: 4,260
→ Main strategy: wait for pullback → re-enter the upward wave → follow the strong trend.
2️⃣ SELL Scalp – Reaction at Resistance (counter-trend)
If the price retests the 4,208 – 4,237 area and creates a clear rejection:
Entry: 4,218 – 4,230
SL: 4,245
TP1: 4,180
TP2: 4,151
→ Setup only for flexible traders, short trades, no holding positions.
🧠 Vincent’s View
The current structure is very precise:
Impulsive Move → Short-term Distribution → Pullback to Support → Continue upward wave.
The 4,151 USD area is the focal point to observe.
The 4,104 USD area is the best BUY area if the market wants to hunt deeper liquidity.
As long as the price does not break 4,104 USD, buyers still hold the entire advantage.

Gold Near Breakout Point — The Next Move Will Be BigGold is holding firmly inside a tight compression zone, and the market is signalling that a major breakout is loading. Despite yesterday’s pullback, buyers defended key demand levels, showing that bullish momentum is still alive as we approach the weekend session.
📊 Technical Outlook (H1)
Price is currently moving inside a symmetrical triangle, with volatility compressing and liquidity building on both sides.
Key observations from MMFlow structure:
• Zone 1 – Support (Potential Reversal Area)
4,174 – 4,159
→ Strong confluence of trendline support + Fibonacci 38.2% + liquidity sweep potential.
→ If price taps this zone, it's a high-probability long setup.
• Zone 2 – Resistance / Breakout Line
4,207 – 4,212
→ This is the key breakout ceiling.
→ A clean break and retest opens the door toward the next expansion wave.
• Measured Move Target (MMF Expansion Target)
4,244 – 4,252
→ Aligns with Fib 1.618 extension and previous liquidity pocket.
🎯 Trading Scenarios (MMFlow Style)
🟢 BUY Scenario (Primary Bias)
Buy Zone 1: 4,174 – 4,159
SL: below 4,150
TP: 4,205 → 4,212 → 4,228 → 4,244+
Why?
This zone carries the strongest confluence for a bullish reaction before the breakout. Ideal spot for Market Makers to reload.
🔵 BUY Scenario 2 (Break & Retest)
Trigger: Break above 4,207 – 4,212
Entry: Retest of 4,207
SL: below retest wick
TP: 4,228 → 4,244 → 4,252
Why?
Breakout from triangle compression usually leads to fast displacement toward untested liquidity highs.
🔴 SELL Scenario (Short-Term Only — Not Preferred)
Only valid if price fails to break 4,207 and forms a clear rejection.
Entry: 4,207 – 4,212
SL: above 4,220
TP: 4,174 → 4,159
Note: This is a counter-trend micro-play. Primary bias remains bullish.
🧠 MMFlow Insight
The market has been accumulating for multiple sessions, and every dip into demand is being bought aggressively. As long as price stays above 4,159, the bullish structure is intact. A breakout above 4,212 could be the ignition point for the next impulsive expansion toward 4,244 – 4,252.

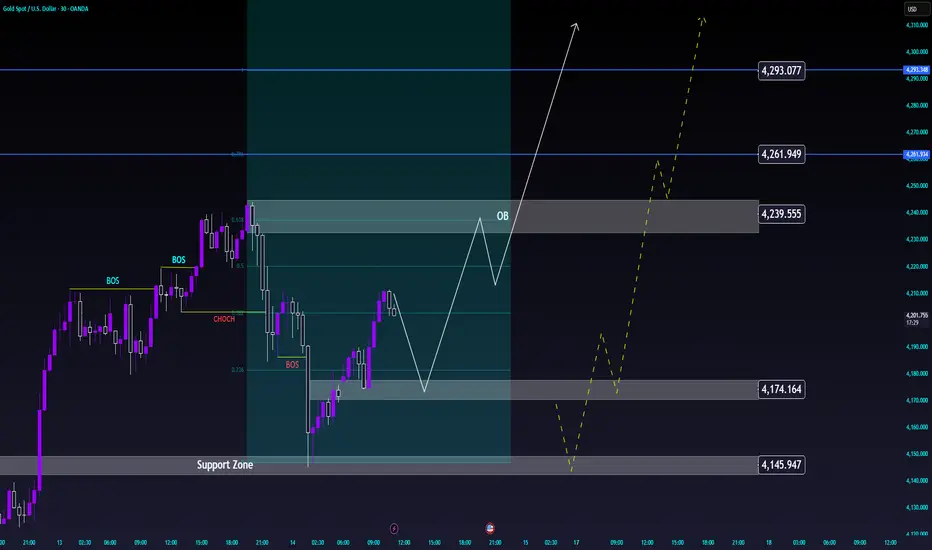
Gold Technical Retracement Before Continuing Main Uptrend⏰ Timeframe: 30m
📅 Update: 11/14/2025
🔍 Market Context
After establishing a short-term peak around 4,239 USD, gold is undergoing a technical retracement to rebalance its structure.
The most recent decline formed a Break of Structure (BOS), but the Support Zone around 4,145–4,174 USD continues to serve as a foundation for the medium-term uptrend.
The current price structure indicates the market is re-accumulating momentum before expanding again.
📊 Technical Structure
Order Block (4,239 USD): a short-term resistance zone where the price may react slightly before continuing upward.
Support Zone (4,145–4,174 USD): a confluence zone with Fibo 0.236–0.382, playing a balancing role in the current cycle.
Liquidity Targets:
• 4,261 USD – intermediate liquidity zone.
• 4,293 USD – main expansion target if the uptrend is maintained.
🎯 Market Outlook
High probability scenario:
1️⃣ The price may retrace to the Support Zone or form a higher low around 4,174 USD, then recover to the OB zone at 4,239 USD.
2️⃣ If the uptrend structure breaks, the market may test deeper towards 4,145 USD before bouncing back.
As long as the price holds above this support zone, the primary trend remains bullish continuation.
🧠 Analyst’s View
This is a phase of market re-accumulation after a rapid increase.
Maintaining a higher low structure will be a confirmation signal for the next expansion phase towards 4,261–4,293 USD.
Buyers are still controlling the cash flow, while sellers mainly participate in the short-term resistance zone.
🛡️ Risk Note
The market is in a slight correction phase – avoid impulsive actions when the price has not completed the accumulation zone.
Gold Maintains Bullish Structure, Prepares for New ExpansionWave⏰ Timeframe: 30m
📅 Update: 11/13/2025
🔍 Market Context
After a short correction at the start of the week, gold has clearly formed a Break of Structure (BOS) on the 30-minute chart, indicating that bullish momentum has returned.
This morning's Asian session witnessed a strong recovery from the Support Zone, confirming that buying pressure remains dominant in the current structure.
The market is approaching the “expansion phase” – where prices typically expand to seek liquidity above.
📊 Technical Structure
Order Block 1 (4,208 USD): a short-term support area, likely to serve as a retest point after the expansion move.
Order Block 2 (4,184 USD): confluence of Fibonacci 0.5–0.618, a deep equilibrium zone within the bullish structure.
Support Zone: the main foundation of the medium-term uptrend, still being preserved.
Extension Levels:
• 4,249 USD → first expansion target.
• 4,267 USD → intermediate liquidity zone.
• 4,292 USD → maximum expansion target within the current cycle.
🎯 Market Outlook
Today's scenario leans towards a continuation bullish direction:
1️⃣ Price may technically correct to the OB 4,208 or 4,184 USD area.
2️⃣ Upon a bullish reaction, the market is likely to expand to 4,267 – 4,292 USD, where short-term selling liquidity is concentrated.
3️⃣ Losing the 4,184 USD level will temporarily shift the structure to rebalancing (sideways).
🧠 Analyst’s View
Gold is in the “expansion reaccumulation” phase, meaning after attracting liquidity below, prices begin to expand following the main trend.
Continuous BOS signals indicate that buyers are reasserting control.
As long as prices remain above the 4,184 USD area, the intraday bias remains predominantly bullish.
🛡️ Risk Note
The market is expanding rapidly, so pullback reactions to the OB area may be highly volatile.
Let your trade ideas run and let's observe together.

Gold Maintains Uptrend, Watch for Pullback to Buy with Cash Flow🔍 Context & Market Structure
After a strong upward impulse from a low liquidity area, the price has broken the downtrend structure and formed a bullish BoS on H1.
Currently, gold is accumulating above the Support Zone at 4,183 USD after creating a new peak and leaving a FVG just below the current price .
Above is the Liquidity Zone $$$ around 4,232 USD – a concentration of sell-side stop losses and buy-side profit-taking orders, likely to create a “final push” that attracts liquidity.
=> Overall: the main trend remains bullish , prioritising waiting for a pullback to discount levels to buy with the trend rather than chasing orders at high levels.
💎 Key Technical Zones
Liquidity Zone $$$: around 4,232 USD – upper liquidity area, prone to profit-taking reactions.
Current FVG: price gap area just below the current price (around 4.20x) – expected to “fill the gap” before continuing.
Support Zone 1: 4,183 USD – nearest support, confluence with the area where the upward impulse began to slow.
Support Zone 2: 4,140 USD – stronger support, aligning with the old structure.
Liquidity Clear: 4,101 USD – lower liquidity area, if swept, it would be a very attractive discount for swing buyers.
📈 Proposed Trading Scenarios
1️⃣ Main Scenario – Buy with the trend at FVG / 4,183 USD
Priority to wait for the price to:
Either fill the FVG around 4.20x and show a rejection candle,
Or clearly retest Support 4,183 USD with a bullish reversal signal on M15–H1.
When a confirmation signal appears:
→ Consider buying (BUY) around 4.19x – 4.18x .
Stoploss: below 4,175 USD (below the nearest low and support).
TP reference:
TP1: 4,210 USD
TP2: 4,232 USD (Liquidity Zone $$$)
TP3: trailing if the price breaks through 4,232 and maintains the bullish structure.
2️⃣ Alternative Scenario – Deeper Pullback Before Continuing Upward
If the price clearly breaks 4,183 USD and closes an H1 candle below:
→ Avoid buying hastily, wait for the price to continue adjusting to Support 4,140 USD or even Liquidity Clear 4,101 USD .
At these zones, if there appears:
strong rejection candles,
or small reversal structures (bullish ChoCH on M15),
→ Then consider buying at a discount with better RR, targeting a return to 4,183 → 4,210 → 4,232 USD.
3️⃣ Short-term Sell Scenario (for experienced scalpers only)
If the price hits Liquidity Zone 4,232 USD but shows strong rejection (long wick, high sell volume):
→ Consider short-term sell scalp back to the 4.20x – 4,183 USD area.
This is a counter-trend trade, so:
keep the volume small,
short TP,
tight SL above the newly formed peak.
⚠️ Risk Management Notes
Do not FOMO buy when the price is testing near the 4.23x area – this is a prone-to-sell area.
Prioritise waiting for a pullback to FVG / Support for a better entry point and RR.
Always adjust volume according to actual SL, avoid over-leverage during strong market volatility.
“Buy the dip in liquidity zones, do not chase orders at the peak – that's how to go with the big money flow.”

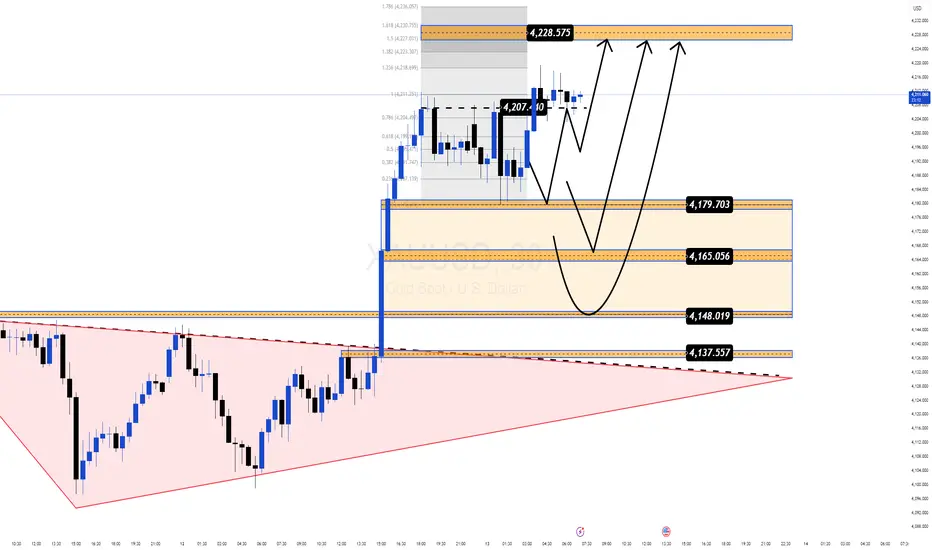
Gold Hits a 3 Week High but the Real Move Might Still Be LoadingGold just tapped $4,213 — the highest level in three weeks, powered by growing expectations of a dovish Fed and optimism around the potential reopening of the US government.
But the real story isn’t the headline spike — it’s the structure forming right beneath it.
📌 Why this zone matters right now
Price is pulling back into $4,179–$4,165, a clean Demand zone aligning with Fibo + breakout structure.
Buyers remain firmly in control despite a mild USD recovery.
The market swept liquidity around $4,207, hinting at accumulation before the next expansion.
The broader pattern resembles a falling-wedge breakout, often appearing before strong upside continuation phases.
🎯 Most Probable Scenario (Mind Insight)
Gold is in a “compression before expansion” phase.
Once this squeeze resolves, momentum is likely to continue in the direction that’s already dominant — and right now, that’s the bulls.
🔶 MMF BUY Zone
$4,179 → $4,165
Looking for a shallow pullback before the next leg.
🔼 Bullish Targets
• $4,207 (liquidity tap)
• $4,228 (Fibo 1.618)
• $4,236 (Fibo 1.786 — major reaction zone)
🧠 Key Takeaway
As long as Gold holds above $4,165, the bullish structure remains intact and the upside expansion toward the upper Fibo cluster stays in play.
XAU/USD – Price Accumulating in a Narrow Range, Ready to Expand⏰ Timeframe: 30m
📅 Update: 11/12/2025
🔍 Market Context
Gold maintains a neutral structure after forming a Change of Character (CHoCH) around the 4,144 USD area.
Yesterday's session witnessed a narrow fluctuation between the Demand Zone – Support Zone, indicating the market is absorbing liquidity before determining the next direction.
The medium-term upward momentum remains unbroken, but the price needs a clear balancing phase before continuation.
📊 Technical Structure
Demand Zone (4,144 USD): a short-term supply – demand area where the market previously reacted strongly, now becoming a potential testing zone.
Support Zone (4,099 USD): confluence structure – an area where buying flows may return when the price retests.
Order Block (4,081 USD): a deep defensive zone, corresponding to the main Discount area in the current cycle.
Equal Lows (EQL) & CHoCH: indicate a short-term transition between two sides, but the overall bias slightly leans towards an increase.
🎯 Market Outlook
High probability scenario for the day:
1️⃣ Price may fluctuate within the 4,099–4,144 USD balance zone to attract liquidity.
2️⃣ If a strong reaction occurs from the Support Zone or Order Block, gold may establish a new upward move towards 4,165–4,180 USD.
3️⃣ Conversely, if the price closes below 4,081 USD, the short-term structure will temporarily shift to neutral, prioritizing a re-accumulation phase.
🧠 Analyst’s View
Current price behavior reflects a “pause phase” in the larger upward structure.
When the market balances at lower levels, the key observation is not the bounce, but the reaction when liquidity is swept — where the true momentum of the trend is reignited.
As long as the price does not break the 4,081 USD mark, the medium-term upward trend remains intact.
🛡️ Risk Note
This is a technical analysis, not investment advice.
The market can change rapidly during US sessions – wait for clear confirmation from price action before participating.

XAU/USD – Gold Maintains Bullish Structure, Monitor FVG 4,060📊 Market Structure
After completing the structure break (ChoCH + BoS) at the 4,080 USD zone, gold has sustained a strong upward momentum and created Equal High 4,140 – 4,145 USD , corresponding with the short-term resistance Order Block .
Currently, the price is technically reacting in this area, indicating short-term profit-taking pressure from buyers after a prolonged rally.
The H1 structure remains bullish as the main support zones have not been broken.
A potential scenario is that the price will adjust to FVG zones or support to absorb liquidity before bouncing towards the Liquidity Zone 4,197 USD — the upper liquidity peak.
💎 Key Technical Zones
• OB & Resistance: 4,127 – 4,140 USD
• Support Zone: 4,104 – 4,107 USD
• FVG Zone #1: 4,060 – 4,067 USD
• FVG Zone #2: 4,031 – 4,037 USD
• Liquidity Target: 4,197 USD
🎯 Trading Plan
1️⃣ SELL Setup – Pullback Scalping
If the price reacts sharply downward at the OB zone 4,127 – 4,140 USD:
• Entry: 4,132 – 4,137
• SL: 4,150
• TP1: 4,104
• TP2: 4,067
→ Short-term trade, leveraging the pullback to the support zone to prepare for the next BUY setup.
2️⃣ BUY Setup – Continuation
When the price completes its adjustment to the FVG or Support Zone and a bullish signal appears (rejection / engulfing):
• Entry: 4,067 or 4,037
• SL: 4,020
• TP1: 4,140
• TP2: 4,197
• TP3: 4,210
→ Main setup in the current trend. Prioritize buying at the discount zone after sufficient liquidity is absorbed at the lower zone.
🧠 Vincent’s View
The H1 structure remains buyer-favored. Current adjustments are technical, not reversals.
The FVG zone around 4,060 USD is a key point to observe price behavior — if a clear reaction occurs, this could be the starting point for the next upward wave to 4,197 USD .
“Liquidity fuels the next move — let the market breathe before the impulse.” ⚜️
⏰ Timeframe: 1H
📅 Updated: 11/12/2025
✍️ Analysis by: Captain Vincent

Gold Reaches Supply Zone: Prepare for a Pullback to FVG📊 Market Structure
Gold continues to maintain its bullish structure after breaking the structure high (BoS) at the 4,000 USD zone and forming a steep bullish channel over the past 3 sessions.
Currently, the price is precisely hitting the Order Block 4,140 – 4,150 USD — a critical supply zone formed from the previous distribution.
The H1 candle is showing slight technical reaction signs , implying the potential for a short pullback to re-accumulate liquidity.
If a pullback occurs, the Premium Zone 4,080 – 4,085 USD and FVG 4,025 – 4,035 USD will be ideal areas to look for buy signals.
The bullish structure is only invalidated if the H1 candle closes below the Support 4,006 USD zone.
💎 Key Technical Zones
• Order Block: 4,140 – 4,150 USD → main supply zone, where profit-taking pressure appears
• Premium Zone: 4,080 – 4,085 USD → medium-term rebalancing zone
• FVG Zone: 4,025 – 4,035 USD → potential discounted price zone for BUY orders
• Support Zone: 4,000 – 4,006 USD → critical defense zone
🎯 Trading Plan
1️⃣ SELL Scalp – Reaction at OB 4,145 USD
If the price continues to react downwards at the 4,140 – 4,150 USD supply zone:
• Entry: 4,143 – 4,147
• SL: 4,155
• TP1: 4,085
• TP2: 4,035
→ Short-term setup, targeting the rebalancing zone before buying back in line with the trend.
2️⃣ BUY Setup – Continuation from FVG Zone
When the price pulls back to the FVG / Premium Zone and creates a confirmed bullish signal:
• Entry: 4,030 – 4,035
• SL: 4,006
• TP1: 4,090
• TP2: 4,145
• TP3: 4,170
→ Trend-following setup, preferred when the price re-accumulates and a clear rejection appears.
🧠 Vincent’s View
Buyers still control the market, but the current OB touch may trigger a short pullback before the bullish wave continues.
The ideal scenario is “tap OB → pullback FVG → continuation,” maintaining a stable bullish structure towards the 4,170 USD target.
“Buy the dip where fear replaces greed — that’s where the next impulse begins.” ⚜️
⏰ Timeframe: 1H
📅 Updated: 11/11/2025
✍️ Analysis by: Captain Vincent

SONA (XAU/USD): BREAKOUT DONE! FED CUT KA FAYDA. KAB KHARIDEIN?📰 Fundamental Analysis: Bada Game Changer (MUST READ)
Bhaiyon aur Behnon, fundamental factors are very strong for Gold (Sona)!
Rate Cut Ki Umeed (Expectation): Market is expecting more than 60% probability for another Fed Rate Cut in December.
Kam rates means Dollar (DXY) will be weak, aur Gold (non-yielding asset) becomes dhamakedaar (explosive/exciting)!
Economy Thodi Slow Hai: US Consumer Sentiment slid to 50.3 (lowest since June 2022). Yeh data supports a 'Dovish' Fed, jisse Sona ko aur support milta hai (which gives more support to Gold).
💡 Is Hafta Ka Main Focus: Watch out for FOMC member speeches on Wednesday. Poora market unki taraf dekh raha hai (The entire market is looking towards them) for the next direction!
📊 Technical Analysis: Setup Ekdum Solid Hai!
Gold ne ek powerful Breakout diya hai from the consolidation range (4,044 - 4,060). Matlab, trend ab pakka Bullish ho gaya hai! (Meaning, the trend is now definitely Bullish!)
Entry Ka Wait Karo (Patience is key): DON'T JUMP IN NOW! Wait patiently for a pullback to the Demand Zone/CP (4,081 - 4,114). This is the best place to initiate a Long position.
Targets (TP): If the CP zone holds, the targets are 4,155, 4,185, and the big level at 4,236.
Stop-Loss (SL): Keep it safe below 4,044.
🎯 Strategy Summary: Fatafat Dekho!
Strategy: Wait and Buy (Long) in the 4,081 - 4,114 area.
Risk: Dhyaan rakhna (Be careful) if price closes below 4,044.
#XAUUSD #Gold #Sona #FedRateCut #Breakout #TechnicalAnalysis #FOMC #IndianTraders

XAUUSD/GOLD 1H SELL PROJECTION 11.11.25XAUUSD/GOLD 1H Sell Projection (11.11.25) chart.
Here’s a quick technical breakdown of what this chart represents:
🟣 Setup Overview
Pair: XAUUSD (Gold)
Timeframe: 1 Hour (H1)
Bias: Bearish (Sell Setup)
🧩 Key Levels
Resistance / High: 4148.82
Stoploss: ~4141.63
Entry Zone: ~4129.45–4128.32
Target 1 (TP1): Around 4110 (S1 + FVG zone)
Target 2 (TP2): Around 4081 (S2 zone)
📉 Projection Logic
Price rejected from major resistance at 4148.
A short-term pullback / retracement is expected into the entry zone.
After possible retest, price is expected to drop towards TP1 and TP2.
The setup suggests a Risk-Reward Ratio (RRR) of roughly 1:2.5 to 1:3, favoring the sell side.
⚙️ Trading Idea Summary
Parameter Value
Bias Sell
Entry Range 4128–4130
Stop Loss 4141
Take Profit 1 (TP1) 4110
Take Profit 2 (TP2) 4081
R:R Ratio ≈ 1:3
Confirmation Bearish engulfing or rejection from resistance zone

Gold Retests FVG Preparing for a New Uptrend, Target 4,120 USD📊 Market Structure
Gold has officially broken the bearish structure (BoS + ChoCH) by surpassing the 4,025 USD zone, confirming a significant shift in market momentum.
Following a series of consecutive BoS and a break of the downtrend line, the price is entering a balanced retest phase (FVG 4,030 – 4,040 USD) .
As long as the price maintains above the 4,020 USD support zone, the bullish structure remains intact, and it is expected to target the Liquidity Zone 4,070 – 4,090 USD , further extending to the Order Block 4,118 – 4,125 USD .
💎 Key Technical Zones
• FVG Retest Zone: 4,030 – 4,040 USD
• Trendline Support: around 4,000 USD
• Liquidity Zone: 4,070 – 4,090 USD
• Final Target (OB): 4,118 – 4,125 USD
🎯 Trading Plan
1️⃣ BUY Setup #1 – Main FVG Retest
If the price retraces to the FVG zone of 4,030 – 4,040 USD and forms a bullish confirmation signal (bullish candle / rejection wick):
• Entry: 4,033 – 4,038
• SL: 4,020
• TP1: 4,070
• TP2: 4,090
• TP3: 4,120
→ Enter at the “discount” zone after the market absorbs liquidity.
2️⃣ BUY Setup #2 – Defensive (deep trendline retest)
If the price slightly sweeps the small OB zone around the trendline:
• Entry: 3,998 – 4,004
• SL: 3,985
• TP1: 4,070
• TP2: 4,120
→ The structure remains intact, this entry has a high RR, suitable for mid-term swing.
⚠️ Invalidation:
• If the price closes an H1 candle below 3,985 USD → the short-term uptrend is invalidated.
🧠 Vincent’s View
The buyers are fully controlling the H1 structure after breaking the downtrend line that lasted nearly 2 weeks.
The price is likely to complete the FVG – trendline – breakout retest before continuing to expand towards the liquidity peak of 4,120 USD.
This is the “buy-the-dip” strategic phase for this week.
“Smart money buys the discount while everyone waits for confirmation.” ⚜️🟡
⏰ Timeframe: 1H
📅 Updated: 11/10/2025
✍️ Analysis by: Captain Vincent

Gold Breaks Out from Accumulation, Eyes Wave 3 Expansion🔍 Market Context
Gold kicked off the new week with strong upside momentum, perfectly aligning with MMFLOW’s previous outlook — calling for a Wave 3 impulse from the accumulation base around 3,940$ – 3,970$.
The market’s reaction in early Asia confirmed a bullish structural shift, as gold continues to gain traction amid stable yields and cautious sentiment around the US Dollar.
Macro catalysts remain balanced, but liquidity behavior suggests smart money is loading into the breakout phase, positioning early for a potential run toward the 4,100$ handle this week.
If momentum sustains, this move could mark the official mid-term reversal that MMFLOW anticipated — setting up a broader recovery phase into year-end.
📊 Technical Outlook (H4 Structure)
Gold continues to follow its Elliott Wave recovery path, now developing Wave (3) within the medium-term bullish cycle.
Key Technical Zones:
• 💎 Support: 3,942$ – 3,982$ (accumulation base & breakout retest)
• 🎯 Target 1: 4,072$ – 4,133$ (Wave 3 completion zone)
• ⚙️ Target 2 / Extended: 4,189$ – 4,201$ (Fibo 1.618 extension)
• ⚠️ Invalidation: Below 3,940$ → loss of short-term momentum, return to neutral structure.
The breakout above 4,000$ reinforces bullish sentiment, while higher highs and sustained volume through 4,072$ would confirm a new impulsive phase with room to expand further.
🎯 MMFLOW TRADING View
This breakout isn’t random — it’s a smart-money-led accumulation exit after weeks of liquidity sweeps.
The narrative remains consistent: “Buy the dips inside strength.”
As long as gold stays above 3,970$, the probability of retesting 4,100$+ remains high, and a move toward 4,200$ before year-end cannot be ruled out.
⚜️ MMFLOW Insight:
“When the crowd hesitates, liquidity has already chosen direction.”

XAU/USD – Holds Its Range, Preparing for a Year-End Expansion🔍 Market Context
Friday’s New York session closed with a two-sided liquidity sweep, yet gold managed to hold its structural balance, maintaining the same rhythm seen over the past two weeks — sideways to mildly bearish, but firmly supported.
This behavior shows that buyers are still defending key zones, especially around 3,940$ – 3,980$, which MMFLOW highlighted multiple times last week as the decisive liquidity floor.
From a macro lens, the Fed’s cautious tone has slowed expectations for aggressive rate cuts — but the probability of another reduction before Q1 2026 remains alive.
As we move toward the final stretch of the year, thinner liquidity and seasonal safe-haven flows could help gold establish a mid-term bottom, setting the stage for the next impulsive leg.
📊 Technical Structure (H4)
The current chart presents a clear 5-wave recovery structure within a tightening range — a classic setup before expansion.
Key Technical Zones:
• 💎 Support Zone: 3,942$ – 3,982$ (liquidity base + strong absorption area)
• 🎯 Wave 3 Target: 4,072$ – 4,133$ (first reaction zone)
• ⚙️ Extended Target / Wave 5: 4,189$ – 4,201$ (Fibo 1.618 projection)
• ⚠️ Invalidation: Below 3,940$ → loss of short-term structure, possible re-accumulation lower.
The structure remains sideways but constructive, and a confirmed breakout of the descending trendline could act as the catalyst for a year-end bullish continuation.
🎯 MMFLOW TRADING View
Smart money continues to accumulate within equilibrium zones, with every liquidity sweep appearing more like preparation than rejection.
As long as gold stays above 3,970$, the bullish bias remains valid — with a 60%+ probability of a move toward 4,130$+ in the short to mid-term.
Historically, November–December often brings portfolio rebalancing and policy easing cycles, both of which may serve as fuel for a potential gold rally into Q1 2026.
⚜️ MMFLOW Insight:
“Accumulation isn’t waiting — it’s when big money quietly builds the next wave.”

XAU/USD – Retest Before Takeoff📊 Market Structure
After several days of fluctuating within a narrow range, gold has finally broken through the main descending trendline extending from the peak of 4,108 USD.
Buyers are currently controlling the short-term structure by continuously creating BoS (Break of Structure) in the price range of 3,965 – 3,980 USD.
The Order Block 3,970 – 3,975 USD area has become an important dynamic support zone , converging with the newly formed trendline.
If the price continues to hold above this area, there is a high possibility of a light retest to absorb liquidity before breaking out to higher resistance zones.
Above, the Resistance 4,028 USD zone is the first barrier to overcome to confirm the medium-term uptrend, while the Liquidity Zone around 4,070 – 4,080 USD is the extended target of the breakout.
💎 Key Technical Zones
• Order Block (Support): 3,970 – 3,975 USD → potential retest area.
• Resistance Zone: 4,028 USD → first profit-taking point for buyers.
• Liquidity Zone: 4,070 – 4,080 USD → extended target if resistance is successfully broken.
🎯 Trading Scenarios
1️⃣ BUY Scenario – Retest OB:
If the price adjusts to the 3,970 – 3,975 USD area and a confirming candle signal appears (bullish rejection / engulfing):
• Entry: 3,972 – 3,975
• SL: 3,960
• TP1: 4,015
• TP2: 4,028
• TP3: 4,070
→ Prioritize trading with the trend after the uptrend structure is confirmed.
2️⃣ SELL Scenario – Reaction at Resistance:
If the price hits the 4,028 – 4,070 USD area and there is a strong reversal signal:
• Entry: 4,045
• SL: 4,065
• TP1: 4,015
• TP2: 3,985
→ Short-term scalp, only activate if a clear rejection signal appears.
🧠 Vincent’s View
Gold is showing signs of transitioning from accumulation to range expansion .
Breaking the descending trendline is the first signal for a new upward move, as long as the OB 3,970 area remains intact.
Buyers can take advantage of pullbacks to increase their position, targeting 4,070 USD – where significant liquidity converges above.
“Break the line, respect the retest — that’s where smart money joins the move.” ⚜️
⏰ Timeframe: 1H
📅 Updated: 07/11/2025
✍️ Analysis by: Captain Vincent

XAUUSD Eyes 4000$ Breakout as Accumulation Phase Near Completion🔍 Market Context
After a week of sideways consolidation within a broad range, gold (XAU/USD) is showing the first signs of structural recovery.
The market is gradually carving a potential short-term bottom, hinting that the corrective phase may be ending — and a breakout from the range could be imminent.
Despite the lack of new macro catalysts, sentiment remains underpinned by renewed safe-haven flows and expectations that the Fed will maintain its easing stance through early 2026.
Traders are now watching closely whether the 4,000$ handle will finally give way — a key inflection zone that could trigger aggressive momentum buying if reclaimed.
📊 Technical Structure (H1–H4)
Gold is currently trading above the intraday demand zone 3,969$–3,982$, maintaining a short-term bullish structure while compressing under resistance.
The descending trendline and Fibo confluence near 4,019$–4,048$ act as the next critical reaction area for breakout confirmation.
Key Technical Zones:
• 💎 Demand Zone: 3,969$ – 3,982$ (liquidity base + ascending trendline confluence)
• 🎯 Primary Resistance: 4,019$ – 4,048$ (trendline + Fibo 1.272/1.618)
• ⚙️ Bullish Target: 4,046$ → 4,052$ → 4,090$ (extended range liquidity)
• ⚠️ Invalidation: Below 3,960$ → risk of a deeper correction toward 3,940$.
🎯 MMFLOW Outlook
Smart money appears to be absorbing liquidity within the 3,970$ zone, suggesting accumulation before expansion.
If gold can break and sustain above 4,000$, the bias flips decisively bullish — opening the door for a range expansion toward 4,050$+.
This could mark the beginning of a new impulse phase following weeks of compression.
⚜️ MMFLOW Insight:
“When volatility sleeps, liquidity quietly builds the next trend.”

Gold Holds 3,980$ as Bulls Eye Recovery Toward 4,020$🔍 Market Context
Gold steadies near the 3,980$ mark as traders weigh shifting expectations on US interest rates.
The latest ADP employment report showed a modest increase of 42,000 jobs — easing fears of an accelerated slowdown but reinforcing the broader cooling trend in the labor market.
While the Federal Reserve’s rate cuts have supported bullion throughout the year, the prolonged US government shutdown now clouds macro visibility, delaying key economic data.
Despite mixed sentiment, gold remains one of 2025’s strongest-performing assets, up over 50% year-to-date, driven by ETF inflows and central bank demand.
📊 Technical Outlook (H1–H4)
Gold has staged a notable rebound from the 3,947$–3,969$ demand zone, reclaiming short-term structure and approaching the 3,990$–4,000$ liquidity pocket.
This area aligns with the 0.618 Fib retracement and descending trendline resistance — making it the next decision point for intraday traders.
Key Technical Zones:
• 💎 Support: 3,947$ – 3,969$ (Liquidity Base / Re-accumulation)
• 🎯 Resistance: 3,992$ – 4,024$ (Fibo 0.618 + Trendline Confluence)
• ⚙️ Extended Bull Target: 4,028$ – 4,033$ (1.272–1.618 Fibo Expansion)
• ⚠️ Invalidation: Below 3,940$ → shifts bias toward 3,905$ liquidity pool.
🎯 MMFLOW View
Smart money continues to accumulate within the re-accumulation pocket near 3,950$, hinting at latent bullish intent.
If price holds above 3,970$ after today’s consolidation, an extension toward 4,020$–4,033$ remains highly probable.
However, failure to maintain intraday demand could invite another liquidity sweep before a larger push higher.
⚜️ MMFLOW Insight:
“Liquidity reveals intention — structure only confirms it.”

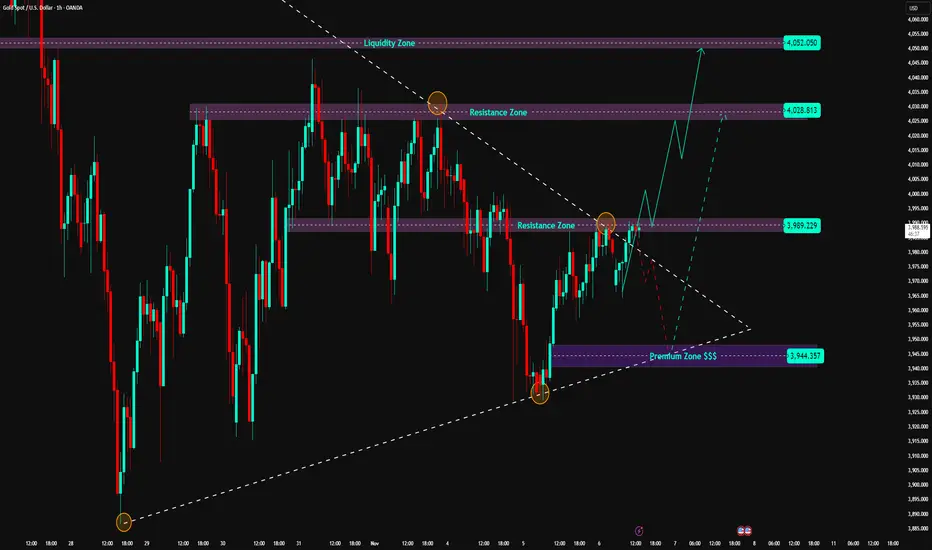
Gold Testing Resistance, Compression Structure Set to Break📊 Market Structure
On the H1 chart, gold is forming a compression structure between the Support 3,944 USD and Resistance 3,989 USD zones.
The recent lows create a series of Higher Lows along the rising trendline – indicating buyers are quietly absorbing supply around the lower region.
However, the 3,989 USD zone remains the central resistance axis , converging with the descending trendline formed from the previous peak (4,028 USD). Each time the price hits this zone, a short-term profit-taking reaction occurs, showing strong defense from sellers.
Below the support zone, the Premium Zone 3,944 USD continues to be the main pivot point – where the price has previously surged strongly in the last two sessions.
If this zone is breached, the short-term bullish structure will be invalidated, opening up the possibility of returning to the Liquidity Zone around 3,921 – 3,892 USD .
Conversely, if the price closes above 3,989 USD , the market will confirm a Bullish Break of Structure (BoS), triggering an extended target towards 4,028 – 4,052 USD .
💎 Key Technical Zones
• Resistance Zone 1: 3,989 USD → main resistance, strong reaction zone.
• Resistance Zone 2: 4,028 – 4,052 USD → upper liquidity target zone.
• Support Zone: 3,944 USD → dynamic support, converging with the rising trendline.
• Liquidity Zone: 3,921 – 3,892 USD → the last zone protecting the bullish structure.
🎯 Trading Scenarios
1️⃣ BUY Scenario – Await Confirmed Breakout:
If the price closes above 3,989 USD and successfully retests:
• Entry: 3,985 – 3,995
• SL: 3,965
• TP1: 4,015
• TP2: 4,028
• TP3: 4,052
2️⃣ SELL Scenario – React at Resistance:
If a reversal candlestick pattern appears at 3,989 USD:
• Entry: 3,985 – 3,990
• SL: 4,000
• TP1: 3,965
• TP2: 3,950
• TP3: 3,944
🧠 Vincent’s View
Gold is in a “compression before breakout” phase, with liquidity concentrated around the 3,989 USD zone.
If this zone is broken, the price could quickly surge to the supply area above 4,028 – 4,052 USD.
If it fails, a price rejection here could pull gold back to the rising trendline at 3,950 USD.
“Compression breeds expansion — let price show which side holds conviction.” ⚜️
⏰ Timeframe: 1H
📅 Updated: 06/11/2025
✍️ Analysis by: Captain Vincent