Gold Awaits FOMC Breakout While Holding Key Liquidity BaseMarket Overview:
Gold remains trapped in a tight range as traders weigh optimism from US–China trade progress against cautious expectations for the upcoming FOMC meeting.
The macro picture feels balanced: risk sentiment improves, yet the weaker USD and lingering Fed cut expectations quietly support the metal.
In essence, gold isn’t trending — it’s coiling.
Liquidity is being built, not lost.
Every test of 4,050–4,060 shows strong absorption, while short-term sellers are still defending the 4,186–4,260 region.
The market is waiting for a trigger,
and the FOMC might be the one that decides which side breaks first.
Technical Structure (H1)
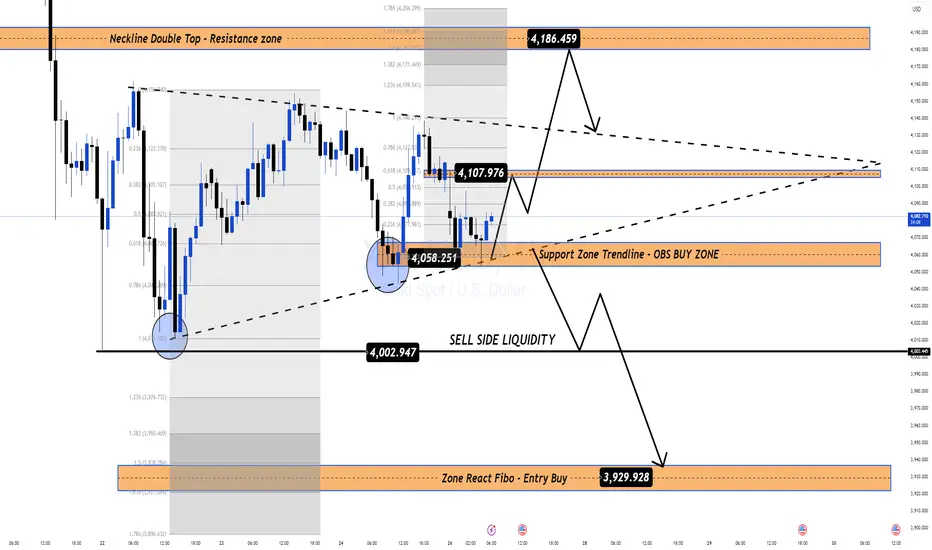
Price continues to respect the ascending support trendline from 4,003 and the neckline resistance near 4,107.
This structure has the DNA of a compression model — narrowing volatility, thinning liquidity, preparing for expansion.
If the support at 4,050 holds, a retest of 4,107 → 4,186 remains likely before the next decision point.
Conversely, a liquidity sweep under 4,002 could form the last dip before a bigger rally unfolds.
Key Structural Levels:
Support / Accumulation Zone: 4,058 – 4,050
Mid-Level Pivot / Neckline: 4,107
Upper Supply Zone: 4,186 – 4,260
Deep Liquidity Pool: 4,002 – 3,930
MMFLOW Perspective:
For now, gold is accumulating energy — this is not a breakout market, it’s a build-up market.
Price action above 4,050 still favours the bulls, but conviction will only return once we see a clean break beyond 4,186.
Ahead of FOMC, patience is strategy.
The next wave won’t come from guessing policy —
it’ll come from reading the flow once volatility hits.
Summary:
Gold’s structure remains stable — liquidity is concentrated below 4,050, and compression continues within the 4,060–4,186 band.
Bias stays neutral-to-bullish as long as the liquidity base holds.
📊 What’s your take?
Will the FOMC spark the breakout, or is gold just reloading for the next wave?
👉 Follow MMFLOW TRADING for institutional flow analysis and smart money structure updates.
Xauusdupdates
Plan |Gold Gradually Accumulating, Ready for a Rebound Wave?🔍 Market Context
After reaching the historical peak ATH GOLD 4,371 USD , gold underwent a deep correction, breaking the short-term bullish structure (BoS) and retesting the OB Bearish zone above .
However, since the price returned to the 4,040 – 4,060 USD area, the market has clearly shown signs of liquidity absorption ($$$) and maintained an internal uptrend line, indicating that buying momentum is returning.
The current structure suggests gold is in a re-accumulation phase before forming a medium-term rebound wave towards the 4,185 → 4,243 USD zone.
The buyers hold the advantage as long as the price does not break the main support trendline.
💎 Key Technical Structure
Support Zone: 4,040 – 4,060 USD → a strong support zone confluencing with the trendline, where institutional buying forces have appeared.
Support Trendline: connecting the series of higher lows from 15/10 → the short-term trend remains bullish.
Liquidity Zone $$$: 4,060 – 4,080 → supply absorption zone, confirming its role as a “price base”.
Resistance Zone: 4,149 – 4,185 → the first resistance zone to break to confirm the recovery momentum.
Target FVG / Supply Zone: 4,243 – 4,250 → potential profit-taking zone or point to consider reversal.
Current structure:
→ Short-term: bullish corrective move.
→ Medium-term: potential for forming an extended recovery wave if it holds above 4,040 USD.
📈 Trading Scenarios
1️⃣ BUY Setup – Retest Trendline / Liquidity Zone 4,060 USD
Entry: 4,060 – 4,070
SL: 4,035
TP1: 4,149
TP2: 4,185
TP3: 4,243
✅ Condition:
Price touches the trendline or liquidity zone 4,060 and shows a bullish reversal signal (rejection / bullish engulfing).
➡️ This is a high-probability setup, confluencing the trendline structure + liquidity support zone, often where large buyers re-enter the market.
2️⃣ BUY Setup – Break & Retest resistance zone 4,149 USD
Entry: 4,149 – 4,155
SL: 4,130
TP1: 4,185
TP2: 4,243
✅ Condition:
Wait for the price to break the resistance zone 4,149 with strong volume, then lightly retest without closing the candle below 4,130.
➡️ Trend-following setup – confirms the return of buying momentum and extends the target to the FVG zone 4,243 USD.
3️⃣ SELL Setup (Scalp Reaction) – FVG 4,243 USD
Entry: 4,240 – 4,245
SL: 4,255
TP: 4,185 → 4,150
✅ Condition:
Only execute if there is a strong reaction at FVG 4,243 without a continuation break signal.
➡️ Short-term technical sell – exploiting the supply zone reaction, do not hold the position long.
⚠️ Risk Management
Prioritise trading in the buy direction, avoid selling against the main trend.
If H2 closes the candle below 4,035 → bullish scenario invalid, wait for a new structure.
Do not FOMO buy in the middle range (4,090–4,130).
Keep moderate volume, move SL to breakeven when the price exceeds 4,149.
💬 Conclusion
Gold is in an ascending re-accumulation phase after a strong decline.
As long as the price holds the trendline and support zone 4,040 – 4,060 USD, there is a high chance gold will rebound following the liquidity + breakout retest model, with the main target being 4,185 → 4,243 USD .
If it breaks through 4,243 USD, the market may trigger a stronger recovery momentum towards 4,300 – 4,340 USD .
👉 Reasonable Strategy:
Buy 4,060–4,070 → TP 4,185 / 4,243 USD
Add Buy when breaking 4,149 USD with volume confirmation.
Technical Sell 4,243 USD if there is no signal to break higher.
🔥 “As long as 4,040 holds, gold remains in accumulation — patience will pay.”
⏰ Timeframe: 2H
📅 Update: 27/10/2025
✍️ Analysis by: Captain Vincent

XAUUSD: Structure Broken! Can the Fed Rate Cut Save Gold?Gold has just completed its first losing week in 10, after a historic rally. Following the record peak of $4,381.21, Gold experienced a sharp correction driven by profit-taking and easing US-China trade tensions. However, weaker-than-expected US CPI data has strongly reinforced expectations for an upcoming Fed rate cut, creating a significant market conflict.
I. MARKET CONTEXT ANALYSIS (H4)
Structure: The prior bullish structure has been broken, shifting the bias to bearish in the short term.
Liquidity: Market forces are now targeting key stop-loss zones to collect liquidity before the next major move.
Strategy: We look to Sell when price pulls back to the Supply Zone (Premium) and Buy when price sweeps liquidity into the strong Demand Zone.
II. DETAILED TRADING PLAN
1. SELL Scenario 📉 (At Supply Zones)
Trade 1:
Entry: $4,202 - $4,204
SL: $4,212
TP: $4,194 / $4,184 / $4,174 / $4,164
Trade 2:
Entry: $4,252 - $4,256
SL: $4,272
TP: $4,236 / $4,216 / $4,196 / $4,176
2. BUY Scenario 📈 (At Demand Zones)
Trade 1:
Entry: $4,158 - $4,161
SL: $4,151
TP: $4,168 / $4,178 / $4,188 / $4,198
Trade 2 (Critical):
Entry: $3,966 - $3,969 (Strong Demand Zone, post-liquidity sweep)
SL: $3,949
TP: $3,989 / $4,009 / $4,029 / $4,049
III. RISK MANAGEMENT NOTE
Capital: Always limit risk to ≤ 1% of capital per trade.
Confirmation: Prioritize waiting for reversal confirmation on lower timeframes (M15/M5) to optimize Risk/Reward ratio.
This is the decisive moment! Trade safe and good luck!
#XAUUSD #Gold #GoldAnalysis #Forex #Trading #Fed #Inflation

Gold Rebounds as CPI Cools and USD WeakensMarket Overview:
Gold has regained bullish traction after the latest US CPI report showed softer inflation data, leading to a weaker USD and renewed buying across metals.
CPI figures came in below market expectations (Core CPI 0.2% vs 0.3%, CPI m/m 0.3% vs 0.4%, CPI y/y 3.0% vs 3.1%), signalling lower inflation pressure and reinforcing bets that the Fed will stay dovish heading into November.
As a result, gold bounced strongly from the 4,050–4,058 support zone, reclaiming key structure levels and stabilising above 4,100 USD/oz.
Market sentiment remains risk-sensitive, but the short-term tone favours further upside correction, as long as gold holds above the trendline and liquidity support zones highlighted on the chart.
Technical Outlook (H2):
The market structure suggests gold has completed its correction phase and is attempting to form a new bullish leg.
Price action shows a clean rejection at the 4,050 liquidity base, and the next immediate objectives are the 4,211 neckline and 4,260–4,342 supply zones.
Key Technical Levels:
Support / Buy Zone: 4,058 – 4,002
Liquidity Sweep Zone: 3,930 – 3,940
Resistance / Neckline: 4,211
Sell Zone Reaction Fibo: 4,260 – 4,342
Trading Plan – MMFLOW View
🔹 BUY Zone #1 (Continuation Play)
Entry: 4,058 – 4,050
Stop Loss: 4,035
Take Profit: 4,155 → 4,211 → 4,260
🔹 BUY Zone #2 (Liquidity Sweep Scenario)
Entry: 4,002 – 3,930
Stop Loss: 3,915
Take Profit: 4,058 → 4,155 → 4,211
Ideal setup if price retests liquidity before CPI-induced recovery continues.
🔹 SELL Zone(Reaction Trade)
Entry: 4,260 – 4,342
Stop Loss: 4,355
Take Profit: 4,211 → 4,100 → 4,058
Weekly Bias & Summary:
With CPI cooling and the USD losing momentum, gold’s structure points to a recovery phase, possibly extending into Wave III of the medium-term cycle.
However, the 4,211 neckline remains the key pivot — a breakout above this zone could trigger momentum extension toward 4,260–4,340, while a rejection may result in another range-bound pullback.
🟡 MMFLOW Bias: Bullish while above 4,050 — dips remain opportunities to buy.
Macro tone favours risk-on rotation, supporting gold’s upside into next week.
📊 Do you think gold will break 4,211 for the next bullish leg, or is another correction incoming before the real move?
👉 Follow MMFLOW TRADING for daily institutional updates and Smart Money Flow structure.

XAUUSD, Whats the Trend? If Pattern Breaks out?#Gold (#XAU/USD) Technical Analysis - October 24, 2025
Current Market Bias: **BEARISH**
Gold is currently trading at 4,109.12, positioned within a critical decision zone. The price action shows a developing #Descendingtriangle pattern with a clear resistance trendline connecting the recent highs around 4,150-4,200.
Key Observations:
The market has failed to break above the dynamic resistance multiple times, indicating weakening bullish momentum. Price is currently hovering near the 0.618 Fibonacci retracement level (4,153.81) but struggling to maintain above it. The horizontal support around 4,015 has been tested multiple times, forming the base of this triangle pattern.
#Breakout Scenarios:
📉 Bearish Breakdown (Higher Probability)
If the horizontal support at 4,015 breaks decisively:
- First Target: 3,918 (1.272 Fibonacci extension)
- Second Target: 3,865 (1.414 Fibonacci extension)
- Extended Target: 3,791 (1.618 Fibonacci extension)
- Major Support: 3,652 (2.0 Fibonacci extension)
This breakdown would represent a continuation of the corrective move from the all-time highs, potentially triggering significant selling pressure as stop-losses are triggered below 4,000.
📈 #Bullish Breakout (Alternative Scenario)
If price breaks above the descending resistance trendline AND reclaims 4,150-4,200:
- First Target: 4,250
- Extended Target: 4,300 (previous highs)
This would invalidate the bearish triangle pattern and could trigger a rally back toward recent highs.
#Risk Management
The pattern suggests a #risk-reward favoring short positions on breakdown confirmation. Traders should wait for a decisive close below 4,015 with increased volume before entering bearish positions. Stop-loss above 4,150 would be prudent for short positions.
Current stance: Monitor the 4,015 support closely - a break here opens the door to significant downside.

XAUUSD BUY TRADE PLAN🔱 VALHALLA CORE — XAUUSD (1H) TRADE PLAN
Date: 24 Oct 2025
🧭 Market Outlook:
Gold dropped hard from the 4,150 area after rejecting the Golden Zone (50–61.8% retracement).
Now heading toward our main BUYING ZONE at 4,012–4,004 where we’ll look for a bullish setup.
📉 If Price Pulls Back Up:
Sell zone: 4,092–4,150 (Golden Area / Supply zone)
SL: Above 4,165
TP1: 4,035
TP2: 4,010 (Buying Zone)
📈 If Price Drops to Buying Zone:
Buy zone: 4,012–4,004
SL: Below 3,995
TP1: 4,092
TP2: 4,120–4,150
💡 Plan Summary:
Short from the Golden Area = continuation trade.
Buy from the Buying Zone = reversal setup.
Wait for 1H confirmation before entry (strong candle or rejection wick).
Always move SL to BE after TP1 hits.

Gold Stuck Near ₹4,100 Ahead of CPIMarket Pulse:
Gold is holding steady around ₹4,100, caught between uncertainty and opportunity as traders brace for the US CPI release and new developments in US–China trade talks.
The yellow metal has paused its recovery from ₹4,050 → ₹4,160, while the US Dollar and bond yields edge higher amid renewed geopolitical tension and surging oil prices.
This is the classic “calm before volatility” moment — the market is simply waiting for data to decide the next wave.
If CPI comes in softer or trade talks disappoint, liquidity could flood back into gold, breaking above ₹4,155–₹4,160 and opening the path toward ₹4,215 → ₹4,261.
But a strong CPI surprise could flip sentiment fast — dragging price back into the ₹4,056 and ₹4,018 buy zones, where the next reaction will decide direction.
📊 Technical Outlook (M30)
Price continues to coil within a tight structure between ₹4,100 – ₹4,155, forming a “spring compression” right below trendline resistance.
Market flow suggests accumulation beneath ₹4,100, hinting that liquidity is building before the next expansion.
Key Structure Zones:
Resistance Pivot: ₹4,154 – ₹4,155 → Key breakout level
Breakout Support (CP Zone): ₹4,056 – ₹4,060
Liquidity Buy Zone: ₹4,018 – ₹4,020
Sell Zone (Fibo Reaction): ₹4,215 – ₹4,261
🎯 Trading Plan – MMFLOW Style
🔹 BUY PLAN – Reaccumulation Base
Entry: ₹4,056 – ₹4,060
Stop Loss: ₹4,045
Targets: ₹4,100 → ₹4,140 → ₹4,155
Focus on reaction candles & liquidity grab confirmation.
🔹 BUY PLAN – Liquidity Sweep Setup
Entry: ₹4,018 – ₹4,020
Stop Loss: ₹4,005
Targets: ₹4,056 → ₹4,100 → ₹4,150
If liquidity sweeps this zone clean, watch for a sharp recovery flow.
🧭 Summary – MMFLOW View
Gold is in “decision mode”, waiting for CPI and macro catalysts to trigger the next trend.
The structure stays neutral-bullish as long as price holds above ₹4,056.
A confirmed breakout above ₹4,155 may unlock a fast rally toward ₹4,215–₹4,260, while a break below ₹4,018 could open the door for one more liquidity flush.
⚜️ MMFLOW Bias: No need to predict the move — just follow the flow when liquidity confirms.
📊 Do you expect gold to break higher after CPI, or trap traders before reversing?

$4,005 BROKEN! GOLD READY FOR CPI COLLAPSEFranCi$$_FiboMatrix Emergency Action Plan (H1 Focus)
Welcome Traders! Gold (XAU/USD) has attracted sellers and is now trading below $4,100. With the US CPI release looming, the DOWNSIDE BREAKDOWN is our highest conviction scenario!
1. Market Snapshot
Current State: Gold is consolidating in a Sideway Zone between $4,159 (Resistance) and $4,005 (Critical Support).
Pressure: The recent break below $4,100$ and the recovering USD are key bearish factors.
The Catalyst: US CPI today. A hot inflation print will fuel the USD and shatter the $4,005$ floor.
Dominant Risk: Break below $4,005.438$ confirms the major bearish trend targeting $3,889$.
2. MAIN TRADING PLAN: Breakdown Scenario (SHORT) 💰
We are setting the trap to execute the SELL trade immediately upon the decisive breach of the $4,005$ Support.
Activate SHORT: Breakdown below $4,005.438$. (Wait for H1 close confirmation).
STOP-LOSS (SL): $4,159.686$. Placed safely above the Sideway Resistance.
TAKE-PROFIT 1 (TP1): $3,938.128 (Fibo Target).
TAKE-PROFIT 2 (TP2): $3,889.330 (Ultimate Structural Target).
3. Contingency Scenario (LONG) ⬆️
Activate LONG: Only if Gold decisively breaks $4,159.686$ (Breakout Zone) and targets $4,237.334.
Note: High-risk counter-trend trade, likely requiring a major negative surprise from the CPI report.
Community Interaction 🚀
The CPI is coming! Will the data be hot enough to smash $4,005$? Or is the Sideway Zone here to stay?
Drop your priority scenario NOW! 👇

Gold Maintains Re-Accumulation Above OB, Wave Recovery Target🔍 Market Context
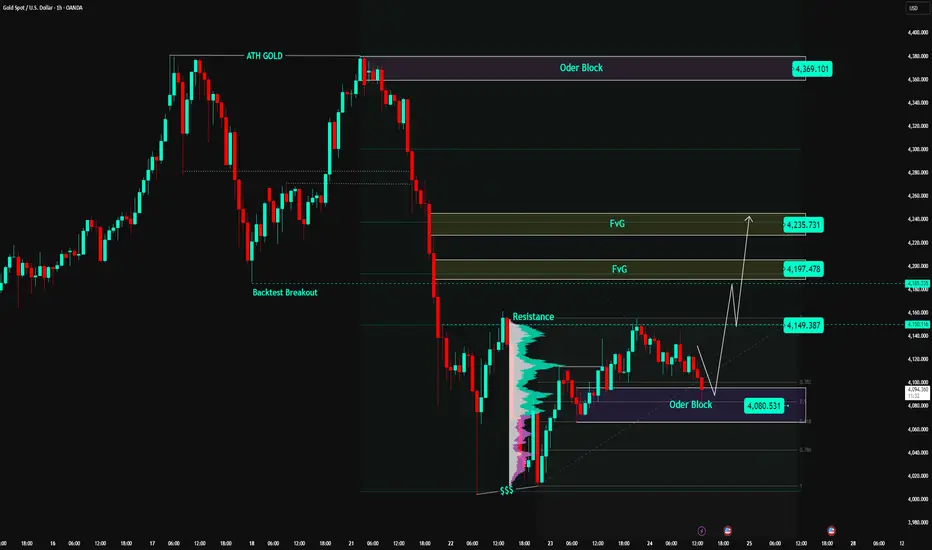
After a sharp decline from the ATH GOLD 4,371 USD peak, gold has completed a liquidity sweep around the 4,010 USD bottom and formed a stable accumulation zone above the Order Block 4,080 USD .
The buyers are gradually regaining control as the price holds firm at the OB and shows signs of short-term supply absorption.
The Resistance 4,149 USD zone is currently a temporary barrier; if successfully breached – gold could trigger a recovery wave towards the Fair Value Gap (FVG) zones at 4,197 and 4,235 USD.
The current price structure leans towards a bullish retracement structure – prioritising buy orders when the price reacts from the active demand zone.
💎 Key Technical Structure
Order Block (OB): 4,080 – 4,085 USD → crucial support zone, confluence with Fibo 0.786, serving as an accumulation base.
Resistance (Breakout Level): 4,149 USD → confirmation zone for upward direction, requires decisive breakout.
FVG1: 4,197 – 4,210 USD → first target, short-term supply test zone.
FVG2: 4,225 – 4,235 USD → confluence resistance zone, potential profit-taking for recovery wave.
ATH GOLD: 4,371 USD → long-term resistance, expanded target if the market maintains strong buying flow.
Overall Structure:
→ Short-term: bullish recovery.
→ Medium-term: re-accumulation after a deep correction phase.
📈 Trading Scenarios
1️⃣ BUY Setup #1 – Retest Order Block 4,080 USD
Entry: 4,080 – 4,085
SL: 4,060
TP1: 4,149
TP2: 4,197
TP3: 4,235
✅ Condition:
Wait for the price to retrace to the OB zone and show clear bullish reversal signals (rejection or bullish engulfing).
➡️ This is a classic “Buy the Dip” setup – aligning with the recovery structure, with high probability due to OB + strong Fibonacci confluence.
2️⃣ BUY Setup #2 – Break & Retest zone 4,149 USD
Entry: 4,149 – 4,155
SL: 4,130
TP1: 4,197
TP2: 4,235
✅ Condition:
Price breaks through the 4,149 resistance zone with good volume and lightly retests, without closing candles below 4,130.
➡️ Trend-following setup, aligning with the flow when the market confirms a short-term resistance break.
3️⃣ SELL Scalp – Reaction at FVG 4,235 USD (short-term)
Entry: 4,230 – 4,235
SL: 4,245
TP: 4,197 → 4,150
✅ Condition:
If gold reacts weakly and there is no follow-up buy at the FVG2 zone → a short-term technical sell can be considered on pullback.
➡️ Short-term sell – only execute if there is no confirmation of continued upward movement.
⚠️ Risk Management
Prioritise BUY according to the main structure (retracement bullish).
Do not FOMO buy within the zone (4,110 – 4,130).
If H1 closes candles below 4,060 → invalidates the bullish scenario, wait for structure reconstruction.
Maintain moderate order size when trading around the FVG zone to avoid noise.
💬 Conclusion
Gold is in the process of re-accumulation and preparing for a technical recovery phase.
As long as the price holds the Order Block 4,080 USD zone, the recovery structure remains valid, and the feasible target is 4,197 → 4,235 USD .
If it breaks through 4,235 USD, the market could extend the rally towards the 4,300 – 4,370 USD (ATH GOLD) zone.
👉 Reasonable Strategy:
Buy 4,080 → TP 4,197 / 4,235.
Buy more when 4,149 break confirms upward direction.
Sell short reaction at 4,235 if there is no signal of continued break.
🔥 “Patience at the base — profits come to those who wait for the OB reaction.”
⏰ Timeframe: 1H
📅 Update: 24/10/2025
✍️ Analysis by: Captain Vincent
XAU/USD: GEMING! US-RUSSIA TENSION DI MANA MAU ENTRY?Gold ($4,140/oz) has bounced back nicely after a big drop from the top. This strength is mostly because of the new US sanctions on Russia (more geopolitical heat!) and everyone is waiting for the key US Inflation Data (today, 24/10). Basically, the fundamentals are giving Gold a strong support!
📌 TECHNICALS & THE GAME PLAN (H1)
Crucial Resistance (Level Berat): $4,180 - $4,186
Action: Jual (Sell) if price reaches this level and gets rejected. Beli (Buy) only if it breaks decisively above $4,186 for a big continuation.
The 'Sweet Spot' Support (Area Cuan): $4,085 - $4,091
Action: Bias BUY. This is the 'Buy The Dip' opportunity. Watch for bullish confirmation here—this is a high-value area.
Safety Net (SL Aman): Below $4,057
If this level is lost, watch out! Pressure will mount to push Gold towards $4,000.
💡 VERDICT & STRATEGY
Gold is currently consolidating. With all this strong news backing it up, the best strategy is to look for BUY entries around the established support zone.
Ideal Entry: $4,085 - $4,091
Stop Loss (SL): Below $4,057
Target (TP): Aim for $4,180
Yuk, trading hati-hati! Don't forget to keep an eye on US Inflation later! 🚀
#XAUUSD #Emas #ForexIndonesia #TradingViewID #Geopolitik #AnalisaTeknikal #BuyTheDip #TradingStrategy #SinyalEmas

XAU/USD – Gold Completes Liquidity Sweep Phase🔍 Market Context
After a prolonged decline from the peak ATH GOLD 4,371 USD , gold has formed a Liquidity Sweep around the 4,010 USD zone, where the selling side was completely absorbed by strong buying pressure from the demand zone below.
The price structure shows signs of a Change of Character (ChoCH) for the first time since the peak, along with the appearance of an Order Block (OB) 4,081 USD – the starting point for a new upward momentum.
This indicates a high possibility that the market is entering a technical retracement phase , aiming to retest the FVG resistance zone above, or even expand back to the ATH zone if buying pressure continues.
💎 Key Technical Structure
Liquidity Sweep: 4,010 – 4,020 USD → liquidity sweep bottom zone, increased volume appears, confirming absorption of sell orders.
Order Block (OB): 4,081 – 4,090 USD → starting zone for recovery momentum; if the price retests this zone and holds → confirmation signal for an upward phase.
Fair Value Gaps (FVG):
• FVG1: 4,196 – 4,210 USD → first target for the recovery wave.
• FVG2: 4,234 – 4,250 USD → next target, confluence of medium-term resistance.
OB | ATH GOLD: 4,370 – 4,380 USD → major resistance zone, previous peak; if the price surpasses → confirmation of a new upward trend.
Current market structure:
→ Short-term: bullish recovery (recovering from the bottom zone).
→ Medium-term: waiting for confirmation to break 4,234 to transition to a complete bullish structure.
📈 Trading Scenarios
1️⃣ BUY Setup #1 – Retest the Order Block 4,081 USD
Entry: 4,081 – 4,085
SL: 4,060
TP1: 4,196
TP2: 4,234
TP3: 4,370
✅ Conditions:
Wait for the price to retest the OB 4,081 zone, a confirmation signal for an increase appears (rejection / engulfing bullish) or a small BoS on M15.
➡️ This is a classic buy-the-dip setup after a Liquidity Sweep – high probability due to the confluence of OB + ChoCH + strong demand zone.
2️⃣ BUY Setup #2 – Break & Retest FVG 4,196 USD
Entry: 4,196 – 4,200
SL: 4,180
TP: 4,234 → 4,370
✅ Conditions:
The price breaks up the first FVG with good volume, then lightly retests without closing candles below 4,180.
➡️ Trend-following setup, following the money flow when the price confirms breaking the short-term resistance zone.
📉 Alternative Scenario – SELL reaction at 4,234 USD (Short-term Scalp)
Entry: 4,234 – 4,240
SL: 4,255
TP: 4,196 → 4,100
✅ Conditions:
If the price reacts strongly and fails at the second FVG without follow-up volume increase → a short adjustment phase may appear.
➡️ Short-term sell, only execute if there is no continuation confirmation at FVG2.
⚠️ Risk Management
Prioritise BUY according to the main recovery trend, only SELL when there is a clear reaction.
Do not FOMO buy in the middle range (4,130–4,180).
If the price closes H1 candles below 4,060 → invalidate the recovery trend, pause all buy orders.
💬 Conclusion
Gold has completed the Liquidity Sweep phase and is signaling a sustainable technical reversal .
Two important zones to monitor:
4,081 USD (OB Zone): first rebound support zone.
4,234 USD (FVG Zone): zone confirming a new upward structure.
If the price holds OB and breaks through FVG, there is a high chance gold will resume its upward momentum towards the 4,370 USD (ATH GOLD) zone.
👉 Reasonable Strategy:
Buy 4,081 USD → TP 4,234 / 4,370 USD.
Sell reaction 4,234 USD only when a clear reversal signal appears.
🔥 “Liquidity has been swept — now it’s time to ride the recovery wave.”
⏰ Timeframe: 1H
📅 Updated: 23/10/2025
✍️ Analysis by: Captain Vincent

Gold's Historic Crash! MSS $4195: Kindly Wait for SELL at $4185📰 FUNDAMENTALS (Context is Key)
Gold has seen a massive drop—sharpest since 2013, mind you—after hitting that record high of $4,398. This steep fall is primarily technical profit-booking, not any major panga (trouble) on the macro side. The core drivers (inflation, uncertainties) for Gold are still intact, pakka (surely), for the long term. However, short-term, a good correction is compulsory.
📊 TECHNICALS (1H Chart Basis)
Market Structure Shift (MSS) Done: The price has given a proper Breakout of the strong support at $4,195 - $4,200. This zone is now our New Resistance—the best place for selling, no doubt.
The market is currently undergoing a Technical Pullback.
🎯 DETAILED TRADING PLAN (Actionables)
Our main focus is to SELL at the Resistance re-test, which aligns nicely with the changed market structure.
1. SELL Strategy (Pro-structure Trade)
SELL ZONE: $4183 - 4185
SL (Stop Loss): $4193
TP (Take Profit): $4175 - 4165 - 4155 - 4145
2. BUY Strategy (Counter-trend Scalp)
BUY ZONE: $4060 - 4055
SL (Stop Loss): $4030
TP (Take Profit): $4091 - 4114 - 4185
🔥 Expert Mandate: Kindly wait for the price to revert to the $4183 - 4185 zone. That is where you Do the needful and look for a SELL (Short) setup. The Risk-Reward is quite handsome.
Please ensure strict risk management (1-2% capital) is followed.
What is your good name for this market? BUY or SELL? Leave your comments and Kindly Follow for the timely updates!
#XAUUSD #GOLD #Forex #TradingView #TechnicalAnalysis

XAUUSD – Awaiting a Breakout to Confirm the Next Bullish WaveGold remains under pressure, trading slightly below 4,100 USD/oz despite ongoing geopolitical tensions and weak global sentiment.
On the higher timeframe, the structure still respects its ascending channel, showing no signs of a deep breakdown yet.
During the early Asian session, renewed buying interest has started to emerge, supported by a stable inflow of safe-haven demand.
Technically, price is attempting to form a bullish continuation structure (Dow wave) around the 4,110 zone.
If a breakout above this key level occurs, gold could accelerate toward 4,155, and potentially extend into a corrective bullish wave targeting 4,220–4,260, aligning with the Fibonacci retracement confluence and the CP/OBS sell zone on the chart.
Technical Outlook (M30):
Price action suggests a potential wave recovery structure forming after last week’s steep decline.
The 4,155 level acts as a key inflection point — it will decide whether bulls regain control or bears push for another correction.
Key Levels:
CP Zone Up / Breakout Base: 4,053 – 4,055
Short-Term Key Level: 4,110 – 4,115
Mid-Level Resistance: 4,155 (structure pivot)
Fibo Sell Zone / Wave End Target: 4,220 – 4,263
Trading Plan:
🔹BUY Setup #1
💥Entry: 4,020 – 4,018
❌Stop Loss: 4,010
✔️Take Profit: 4,030 → 4,035 → 4,040 → 4,050 → 4,060 → 4,100
⏸Bias: Reaccumulation Phase (structure support)
🔹BUY Setup #2 (Scalp Play)
🔔Entry: 4,053 – 4,051
❌Stop Loss: 4,043
✔️Take Profit: 4,060 → 4,070 → 4,080 → 4,090 → 4,100 → 4,150
⏸Note: Ideal for intraday traders watching the breakout base.
🔹SELL ZONE (Liquidity Reaction Zone)
📊Entry: 4,263 – 4,265
❌Stop Loss: 4,273
✔️Take Profit: 4,255 → 4,250 → 4,240 → 4,230 → 4,220 → 4,210 → 4,200
⭐️Summary:
Gold continues to consolidate above 4,050, showing signs of early recovery after the recent 3,000-pip correction.
The 4,155 level remains the key pivot for short-term direction — a breakout here could confirm a Wave 3–5 recovery structure, while rejection could bring one more pullback.
Macro and geopolitical uncertainty still favour safe-haven flows, keeping the bullish scenario valid as long as 4,000–4,020 holds.
📊What’s your take — will gold break above 4,155 to start a new bullish wave, or reject and extend the correction further?

SELLOFF IMMINENT GOLD TRAPP Final Warning Before $4000 COLLAPSEWelcome Traders! The Gold market (XAU/USD) is tightly constrained, and the pressure from the USD, combined with the technical breakdown risk, makes the SHORT scenario our highest conviction trade!
1. Sharp Technical Analysis
The H1 chart confirms a Bearish Consolidation structure after the steep drop from $4,370$. The price is locked in a high-stakes "No-Trade Zone".
Dominant Trend: BEARISH (following the breakdown of the Double Top pattern at $4,100$).
Consolidation Range (No-Trade Zone): Price is squeezed between $4,005 (Support) and $4,159 (Resistance).
Bear Flag Warning: A highly probable Bear Flag pattern is forming, suggesting an explosive downside move upon breakout.
Action Mandate: WAIT FOR THE BREAKDOWN CONFIRMATION!
2. Fundamental Analysis: USD Fueling the Drop
USD Strength: The USD sustained its upward momentum, increasing the burden on Gold. While a slight pullback occurred at the US open, the overall positive USD momentum remains a significant bearish factor.
Impact: Consistent USD demand makes a decisive break above $4,159$ highly unlikely. This heavily favors the scenario where Gold breaches the critical $4,000$ support.
3. MAIN TRADING PLAN: Breakdown Scenario (SHORT)
We are setting the trap to execute the SELL trade immediately upon the decisive breach of the $4,005$ Support.
Activate SHORT: Breakdown below $4,005$. Confirm with an H1 candle closing decisively beneath this level.
STOP-LOSS (SL): $4,159$. Placed safely above the No-Trade Zone Resistance.
TAKE-PROFIT 1 (TP1): $3,955.772. The next structural support target.
TAKE-PROFIT 2 (TP2): $3,889.251. The final objective, aligning with the larger pattern target.
Contingency Scenario (LONG)
Activate LONG: ONLY if Gold decisively breaks $4,159$ (Breakout Zone) and targets $4,332.127.
Note: This is a counter-trend, high-risk trade requiring massive news to justify.
Community Interaction 🚀
Are you ready for the break? Will Gold collapse to $3,889$ or surprise us with a break of $4,159$?
Drop your priority scenario NOW! 👇

GOLD SHOWING A GOOD UP MOVE WITH 1:10 RISK REWARD GOLD SHOWING A GOOD UP MOVE WITH 1:10 RISK REWARD
DUE TO THESE REASON
A. its following a rectangle pattern that stocked the market
which preventing the market to move any one direction now it trying to break the strong resistant lable
B. after the break of this rectangle it will boost the market potential for break
C. also its resisting from a strong neckline the neckline also got weeker ald the price is ready to break in the outer region
all of these reason are indicating the same thing its ready for breakout BREAKOUT trading are follws good risk reward
please dont use more than one percentage of your capitalfollow risk reward and tradeing rules
that will help you to to become a bettertrader
thank you

$4,381 WAS THE FAKE TOP? Gold -5.5%: MSS Confirms SELL!XAU/USD Solid Analysis: Historic Dump and Structure-Based Trade Setup!
1. Fundamental Shock Analysis (Market ka Bhaav)
Gold's massive 5.5% fall from its All-Time High (ATH) of $4,381 is a big profit-booking spree after that superb 60% rally this year. This correction was full-on and was pushed by:
USD is Strong: Dollar index ne zor pakda (gained strength), making Gold less attractive.
Sentiment Change: Market ka bhaav (market sentiment) shifted to Risk-On.
The Gist: This is basically a Liquidity Sweep, yaar. They are washing out the weak players before the next big move.
2. Technical Analysis (MSS & Execution)
The price action has given a pakka (confirmed) signal: Trend to change ho gaya hai (The trend has changed)!
MSS Confirmed: The Market Structure Shift (MSS) is locked at $4,254.549. This is our Supply Zone now—the key resistance for the bears.
Demand Testing: Gold is trying to hold the current Order Block (OB) at $4,077.
Preferred Strategy: SELL as per the MSS structure. This is the main funda (fundamental principle) now.
Optimal SELL Zone: Wait for the retracement to the Supply Zone $4,254.549 (A great limit order setup).
Target (TP):
TP 1: $4,008 (The crucial psychological $4k level).
TP 2: $3,944 - $3,904 (Strong support ka area).
Stop Loss (SL): Tight SL above $4,260 (Protecting the MSS point, no compromise).
Conclusion: Bhaiyon, don't get trapped by the small bounce. $4,254.549 is the high-conviction point for a short trade on Gold!
#GOLD #XAUUSD #MSS #LiquiditySweep #SELLSignal #PakkaTrade

Gold Whats Next??gold rally lasted 4 years everytime in the past , and are trapped for years
Disclaimer- Just my view and opinion trade at your own risk not an investment advice these are only for educational purposes

Bullish Scenario (Primary Setup): Entry (Buy Zone): 4,180 – 4,2Technical Overview:
Gold is currently in a retracement phase, testing a strong BUY ZONE between 4,180 – 4,200.
This zone has previously acted as a major support area, where buyers stepped in.
The chart shows a possible bullish reversal pattern forming near this zone, suggesting a potential rebound.
🟩 Bullish Scenario (Primary Setup):
Entry (Buy Zone): 4,180 – 4,200 LME:ZS1! LME:CA1! LME:AH1! LME:NI1! LME:HC1! LME:MC1! LME:PB1! LME:SN1! LME:MZ1! LME:MA1! LME:SR1! LME:AN1!
Target: 4,384
Stop-Loss: Below 4,160
Rationale:
The buy zone aligns with previous price reactions, confirming strong demand.
Wick rejections around 4,190 indicate buyer interest.
Price action suggests a possible V-shaped recovery or higher-low formation before continuation upward.
🟥 Bearish Scenario (Alternative):
If price closes below 4,160, the support zone will be invalidated.
In that case, expect further downside toward 4,120 – 4,100.
⚙️ Summary Table:
Parameter Value
Trend Bias (Short-Term) Neutral to Bullish
Key Support (Buy Zone) 4,180 – 4,200
Target 4,384
Stop-Loss Below 4,160
Risk–Reward Ratio ≈ 1:3
📊 Conclusion:
Gold (XAU/USD) is approaching a critical support zone. As long as the price holds above 4,160, a bullish rebound toward 4,384 remains likely. However, a confirmed break below this level could trigger a deeper correction.

GOLD: BUY $4235, TARGET $4450! (FED RATE CUT PLAY📰 MACRO PUSH: Low-Interest Rate Tailwinds
Gold is getting a huge boost from the fundamentals:
Fed Rate Cuts: Market is pricing 99% probability of a Fed rate cut next week. This is spot on for Gold. Low rates = Gold will fly!
Safe-Haven: Political instability (US Govt shutdown extending) and trade tensions are pushing safe-haven demand higher.
Key Data: Watch for the delayed CPI data on October 24th. It will be a major trigger!
Summary: The fundamental conviction for upside is max to max. We are ready for the breakout.
📈 TECHNICAL ANALYSIS: The Perfect LONG Setup!
The chart shows Gold is correcting back to the main Demand Zone—a confluence of the Uptrend Line and a crucial structural low. This zone is our go-to for a perfect entry.
🎯 Detailed Trading Strategy
We are activating a long position as price revisits our key zone:
Position: LONG (BUY) - With full conviction on the primary trend.
BUY ZONE (Entry):
$4,237
$4,235 (The most critical Demand Zone)
SL (Stop Loss):
$4,227 (Must protect this level!)
TP (Take Profit Targets):
TP1: $4,245
TP2: $4,255
TP3: $4,265
TP4: $4,275
Final TP: Open (Expecting a New ATH around $4,450+)
DISCLAIMER: This opportunity at the Demand Zone is strongly backed by the macro picture (Fed & Instability). Please use proper risk management!
#GOLD #XAUUSD #Fed #ATH #TechnicalAnalysis #IntradaySetup

Entry: Near $4,320 – $4,325 (Buy Zone) Stop-Loss: Below $4,310 Market Structure Overview
The price is currently moving inside a descending channel (marked as TRADE LINE).
A Buy Zone is identified between $4,315 – $4,325, which acts as a strong support area.
Price has touched the lower channel line and rebounded upward, indicating buyer interest around that zone.
📉 Short-Term Trend
The short-term trend is bearish due to lower highs and lower lows inside the channel.
However, momentum shows weakening selling pressure near the buy zone.
🟢 Bullish Scenario
If price holds above the Buy Zone and forms bullish candles, expect a potential reversal toward the upper channel line.
A breakout above the upper channel would signal a trend shift, targeting:
Target: $4,381 – $4,385 (as marked on your chart).
🔴 Bearish Scenario
If price breaks below $4,315, it would invalidate the buy zone setup.
Next potential support could be around $4,300 or lower.
📊 Trade Plan Example
Entry: Near $4,320 – $4,325 (Buy Zone)
Stop-Loss: Below $4,310
Take-Profit: $4,380 – $4,385
Risk-to-Reward: Approximately 1:4
⚙️ Summary
Gold is currently consolidating within a descending channel.
A bullish breakout from this structure could open the path toward the $4,381 target zone, confirming short-term bullish reversal momentum. LME:SC1! TMX:SXF1! TMX:CGB1! TMX:CGZ1! TMX:CGF1! TMX:LGB1! TMX:BSF1! TMX:FBA1! TMX:FCN1! TMX:FDO1! TMX:FEB1! TMX:FER1! TMX:FEB1! TMX:FHO1!

Gold Holding Gains Ahead of Key US CPI DataGold extends its bullish momentum in early Asian trading, hovering near ₹4,370, supported by rate-cut expectations from the Fed and ongoing US government shutdown concerns, which continue to pressure the USD.
According to CME FedWatch, markets are now pricing in a 99% probability of another rate cut next week — a strong catalyst for gold bulls.
Lower interest rates reduce the opportunity cost of holding non-yielding assets like gold, reinforcing the medium-term uptrend.
However, all eyes are on the US September CPI report due later this week.
A hotter-than-expected reading could temporarily lift the USD and trigger short-term volatility in gold prices.
🔍 MMFlow Technical Outlook
Gold is currently consolidating around the ₹4,320–₹4,370 range after reaching the ATH zone.
Price action shows a clear liquidity sweep at the highs, followed by a minor retracement — still within the bullish structure.
The main trendline remains intact, suggesting that any dip toward ₹4,305–₹4,260 may attract new buyers.
⚙️ Trading Plan (MMFlow View)
🔼BUY SCALP
📌Entry: ₹4,302 – ₹4,300 (½ volume)
❌Stop Loss: ₹4,292
✔️Take Profit: ₹4,310 → ₹4,315 → ₹4,320 → ₹4,330 → ₹4,340 → ₹4,350+
🔼BUY ZONE (Swing)
✨Entry: ₹4,260 – ₹4,258
❌Stop Loss: ₹4,252
✔️Take Profit: ₹4,265 → ₹4,270 → ₹4,280 → ₹4,290 → ₹4,300+
📈Buy setups remain favored as long as price holds above ₹4,260.
Intraday sell reactions near ₹4,360–₹4,378 are short-term only — watch for liquidity grabs and bullish re-entry opportunities.
⚡️Key MMFlow Zones
CP Down Zone / OBS Sell Zone: ₹4,360
ATH Liquidity Sell Zone: ₹4,448
Retest Trendline / OBS Buy Zone: ₹4,305
End FVG Uptrend / OBS Buy Zone: ₹4,260
Sentiment: 🟢 Bullish Bias
Bias Confirmation: CPI Data & Fed Rate Expectations
Strategy: Buy-the-Dip → Target Liquidity Above ₹4,370–₹4,380
🔥 Stay patient — let liquidity drive the next leg. MMFlow tracks smart money zones, not emotions.

XAU/USD – Gold Technical Rebound Prepares for Next Waveb]🔍 Market Context
After reaching a peak at the ATH GOLD 4,391 USD region, gold has undergone a technical correction — reflecting temporary profit-taking following a strong upward trend.
The market structure still maintains a bullish bias as the support zones below (FVG + OB) remain intact and untested.
Currently, the price is hovering around 4,325 USD, indicating that selling pressure has weakened.
Buyers are likely to return at two strategic zones below — where institutional money (Smart Money) typically accumulates positions before the next upward wave.
💎 Technical Analysis
ATH GOLD: 4,391 USD
Liquidity Zone $$$: 4,465 – 4,424 USD → the upper liquidity zone, the main target for the next upward wave.
FVG Zone: 4,284 – 4,267 USD → an unfilled gap, likely to be retested.
Order Block Zone: 4,244 – 4,230 USD → deep discount zone confluence with Fibo 0.786, high probability of strong reaction.
Liquidity Clear $$$: 4,186 – 4,190 USD → the last defense zone of the main upward trend.
Overall structure remains bullish ; the current decline is merely a phase of adjustment to “accumulate liquidity” before continuing the upward momentum.
📈 Trading Scenarios
1️⃣ BUY Setup #1 – FVG Zone 4,267 USD
Entry: 4,267 – 4,270
SL: 4,255
TP: 4,330 → 4,366 → 4,391
✅ Condition: Confirming bullish candle (rejection / engulfing bullish) at the FVG zone or a small BoS appears on M15.
➡️ Short-term “buy-the-dip” setup, leveraging the unfilled FVG zone — where technical buyers often initiate positions first.
2️⃣ BUY Setup #2 – Order Block Zone 4,244 USD
Entry: 4,244 – 4,230
SL: 4,210
TP: 4,284 → 4,366 → 4,391 → 4,424
✅ Condition: Strong confirming candle (engulfing bullish) or a retracement pattern breaking a small BoS back up.
➡️ Swing-buy setup at deep discount zone — confluence of OB + Fibo 0.786, high probability and optimal R:R.
⚠️ Risk Management
Avoid FOMO buying in the middle of the range (4,320–4,340).
Prioritize waiting for clear reactions at 4,267 and 4,244 before entering trades.
If the price closes an H1 candle below 4,210 → pause all buy orders, re-evaluate price action at 4,186.
Maintain moderate trading volume during the current rebound phase.
💬 Conclusion
Gold is in a phase of healthy technical correction within a major upward trend.
The two zones 4,267 USD (FVG Zone) and 4,244 USD (Order Block Zone) are key “accumulation” areas for large capital.
When bullish confirmation signals appear, these will be safe buy positions before gold heads back to the peak 4,391 – 4,465 USD .
👉 Reasonable Strategy:
Buy at 4,267 – 4,270 USD if reversal confirmation occurs.
Buy at 4,244 – 4,230 USD if a strong OB reaction signal appears.
🔥 “Smart money waits at precise levels — not at the top. The next gold wave will emerge between 4.267 and 4.244.”

XAUUSD PLAN | When balanced breaks, strength leaves its mark.🔍 Market Context
After setting a short-term peak at the 4,385 – 4,372 USD zone, gold has entered a strong technical correction phase, with a series of consecutive red candles breaking the short-term upward structure.
The sellers temporarily dominate, pushing the price through the H1 upward trendline. However, the support zone below (Liquidity Zone + Order Block Bullish) is beginning to show absorption, indicating that buyers might return at discounted price zones.
💎 Technical Analysis
Previous Bullish BoS: confirms the main trend is still long-term bullish .
FVG Down Zone: 4,285 – 4,260 USD → a price imbalance zone left in the downtrend, possibly where the price may retrace to “fill the gap” before choosing a direction.
Liquidity Zone $$$: 4,222 – 4,218 USD → a short-term support zone where new buying liquidity appears.
Order Block Bullish: 4,203 – 4,185 USD → a confluence area between OB and Fibo 0.786, where large capital might return.
Deep Bullish OB: 4,142 – 4,128 USD → the last defensive zone for the main upward trend.
Order Block Bearish: 4,372 – 4,385 USD → a critical resistance zone, likely to react if the price retraces.
The current structure shows gold is in a retracement – liquidity rebalancing phase, with insufficient signals to reverse the trend.
📈 Trading Scenarios
1️⃣ Main Scenario – Buy reaction at Liquidity zone 4,222 – 4,203 USD
Entry: 4,222 – 4,203
SL: 4,185
TP: 4,260 → 4,318 → 4,372
✅ Condition: Strong rejection candle (rejection / engulfing bullish) appears at the support zone or small reversal BoS.
➡️ This is a “buy the dip” setup following the main trend, leveraging the liquidity zone and confluence OB.
2️⃣ Secondary Scenario – Sell reaction at FVG Down 4,285 – 4,260 USD
Entry: 4,260 – 4,285
SL: 4,300
TP: 4,222 → 4,203
✅ Condition: Strong bearish candle or rejection signal appears at the FVG zone.
➡️ This setup is for scalping traders or short-term shorts in the unfilled price balance zone.
⚠️ Risk Management
Do not FOMO buy when the price has not confirmed the 4,222 zone.
If the price breaks below 4,185 → wait for a re-test to continue selling towards the 4,128 zone.
Keep moderate volume, as the market is in a rebalancing phase – liquidity remains noisy.
💬 Conclusion
Gold is in a transitional phase after a strong decline .
The 4,222 – 4,203 USD zone will be key to determining whether the medium-term upward trend continues.
If this zone holds, gold is likely to retest the 4,318 – 4,372 USD zone.
👉 Reasonable Strategy:
Buy reaction at 4,222 – 4,203 USD when confirmed.
Technical Sell at FVG 4,260 – 4,285 USD if a clear rejection appears.
🔥 “When the market is unbalanced, the strongest side will leave a mark – and this time, the mark is around the 4,220 USD zone.”
