GOLD Awaiting Sell Reaction at Peak & Buy Pullback Support🔍 Market Context
After a series of strong Break of Structure (BoS) , gold has reached a new ATH at 4,385 USD – marking a sustainable uptrend over the past 3 sessions.
However, this peak area is currently acting as a significant psychological and technical barrier . Buying momentum is temporarily slowing as the price reacts to the Liquidity Zone around 4,351 – 4,385 USD .
The market is in a phase of liquidity rebalancing .
The major trend remains upward, but the current price area may see a short-term correction before further wave expansion.
💎 Technical Analysis
ATH GOLD: 4,385 USD
Sell Liquidity Zone: 4,430 – 4,435 USD → high liquidity resistance zone, potential for short-term sell reactions.
Liquidity Zone $$$: 4,284 – 4,282 USD → nearby support zone, confluence with trendline.
Order Block | Fibonacci Zone: 4,226 – 4,230 USD → deep discount zone confluencing with Fibo 0.618, high reversal potential.
Overall Structure: remains bullish , but showing short-term signs of weakness as the price fails to hold above 4,360.
📈 Trading Scenarios
1️⃣ SELL Setup – Rejection at peak area 4,385 – 4,433 USD
Entry: 4,430 - 4,435
SL: 4,440
TP: 4,425 → 4,420 →4,415→4,410→4405
✅ Condition: Appearance of rejection or strong bearish engulfing candles at high Liquidity zone.
➡️ This is a liquidity reaction setup – sell when the price sweeps the peak and clear sell signals from major players appear.
2️⃣ BUY Setup #1 – Pullback at 4,284 – 4,282 USD
Entry: 4,284 – 4,282
SL: 4,272
TP: 4,290 → 4,300 → 4,310/Open
✅ Condition: Strong H1 candle reaction at support or minor reversal structure.
➡️ Buy with the main trend, taking advantage of a slight pullback around the support Liquidity zone.
3️⃣ BUY Setup #2 – OB Deep Zone 4,226 – 4,230 USD
Entry: 4,226 – 4,230
SL: 4,190
TP: 4,235 → 4,240 → 4,250/Open
✅ Condition: Appearance of bullish BoS or confirming bullish engulfing candle.
➡️ This is a deep discount zone, suitable for swing orders following the main trend.
⚠️ Risk Management
Avoid FOMO buying at high zones (4,360+).
Prioritize observing price behavior at 4,284 and 4,226 before entering orders.
Sell orders at 4,385–4,430 are only triggered if there is a clear confirmation signal.
Maintain moderate volume, avoid averaging down without confirmation.
💬 Conclusion
Gold is accumulating after reaching the peak of 4,385 USD , this is a crucial phase to determine the correction before the new upward wave.
The most effective strategy now is sell reaction at the high peak area 4,385 – 4,430 and buy with the trend at 4,284 – 4,226 USD when confirmation appears.
👉 Reasonable Strategy:
Sell Reaction: 4,385 – 4,430 → TP 4,284 – 4,226
Buy Pullback: 4,284 – 4,282
Buy OB Deep: 4,226 – 4,230
Xauusdupdates

Fibo BUY Zone Mandatory for Trend Continuation.🎯 Macro Summary & Bias: The Bulls Are Unstoppable!
Gold is the most sought-after asset as XAU/USD aims directly for the $4,300 mark and further.
Primary Catalyst: Financial markets remain cautious amidst the ongoing US government shutdown.
Driving Force: Widespread USD weakness—fueled by the funding battle in the US government—strengthens the bullish case for Gold.
Record Strength: XAU/USD is maintaining positive upward momentum despite extreme overbought conditions.
Technical Focus: In this continuous Bull market, FIBO is the paramount tool for identifying the critical pullback points to initiate BUY entries.
📊 In-Depth Technical Analysis (H1): Pinpointing the FIBO Reaction Levels
Our core strategy remains BUY ON DIPS at the most precise Fibo levels, leveraging the strong Parabolic structure.
1. Strategic BUY Zone (FIBO BUY REACT ZONE):
This is the most crucial Fibo support zone where we anticipate a high-probability pullback:
4,321.332 The REACTION FIBO BUY ZONE 0.5.
This is the most vital retracement point to catch the next growth wave.
2. Sell/Take-Profit Targets (FIBO SELL TARGETS):
These are the Fibo extension targets where the Longs are aiming:
TP Target 1 (Extension) 4,436.179 The REACTION FIBO SELL ZONE 1.5 - 1.618. The next immediate target for the rally.
TP Target 2 (Deep Extension) 4,538.394 The REACTION FIBO SELL ZONE 2.5 - 2.618. The long-term target if momentum remains unchecked.
📈 TODAY'S ACTION PLAN
Primary Action (Prioritize BUY): Patiently wait for the price to correct to the REACTION FIBO BUY ZONE 0.5 at 4,321.332.
Upon confirmation (H1/M30/M15 reversal candles), confidently activate the Long (BUY) entry.
Targets (TP): Aim for TP Target 1 (4,436.179) and further to TP Target 2 (4,538.394).
⚠️ Risk Warning
Risk Warning: Given the extreme overbought conditions, always place a safe Stop Loss (SL) below the Fibo BUY ZONE and maintain stringent risk management!
Wishing all FranCi$$_FiboMatrix traders a disciplined and victorious day!

Gold (XAU/USD) Breakout Rally Toward New HighsAnalysis:
Gold (XAU/USD) continues its strong bullish momentum on the 4-hour chart, forming a series of higher highs and higher lows, confirming a sustained uptrend. The recent breakout above the resistance zone near $4,150–$4,170 indicates renewed buying interest and momentum buildup.
After a brief retest of the breakout area, price has started climbing again — a sign of trend continuation supported by bullish candle formations and strong market sentiment.
Technical Outlook:
Support Zone: $4,140 – $4,170 (previous resistance turned support)
Bullish Confirmation: Continuation pattern with clean structure and volume support
Momentum Bias: Strongly bullish while above $4,150
🎯 Target: $4,300 – $4,320 zone
🛑 Stop Loss: Below $4,140 to limit downside risk
📈 Summary:
As long as gold stays above the breakout level of $4,170, the market remains bullish, with upside potential toward $4,300–$4,320, aligning with the next major resistance area.

XAUUSD/GOLD 1H BUY STOP PROJECTION FOR 17.10.25Chart Info
Instrument: XAU/USD
Timeframe: 1 Hour (H1)
Price: $4,279.99
Strategy: Buy Stop — Trend Continuation
🟦 Market Structure & Trend:
Price is respecting a strong uptrend channel — clearly defined higher highs & higher lows.
Golden Ratio (Fibonacci) at 0.5 (4242.62) and 0.618 (4251.84) acts as premium entry zone for a retracement buy.
Bullish structure remains intact above 4230 zone.
📊 Entry & Target Zones:
✅ Entry Zone: Around 4250 (Golden Fibo + FVG)
🛑 Stop Loss: Below 4230 (structure break = invalidation)
🥇 Target 1 (R1): 4280 (in-channel move)
🥈 Target 2 (R2): 4310 (new ATH projection)
🧭 Technical Confluences:
📈 Uptrend Channel Support — Price expected to bounce after retest.
🟪 15 min Fair Value Gap (FVG) — potential wick entry below 4250.
📐 Golden Ratio Zone — ideal institutional entry point.
🔄 Break & Retest structure — previous resistance now support.
⚠️ Risk & Confirmation:
If candle closes below 4230, trend structure weakens — setup invalid.
Watch for NY Session volatility or major news for breakout momentum.
Partial profit booking near R1 and trailing SL above entry for R2 recommended.
✅ Summary of Plan:
Buy stop setup at retracement zone (4250 area).
SL tight below structure (4230).
TP 4280–4310 with trend continuation.

GOLD: 419x FIBO! READY FOR 426x TARGET.Gold is surging near $4,210, backed by Fed rate cut expectations and ongoing trade tensions. The long-term structure is rock-solid Bullish. Our plan is simple: WAIT and BUY the intelligent pullback!
🎯 THE BUY REACT ZONES (H1)
We are prioritizing Longs and patiently waiting for the price to hit the exact FIBO RETRACE levels.
1. PRIME BUY ENTRY (The Sweet Spot):
Zone: 4194 - 4190 (Our key Fibo Retrace Buy Zone).
Action: Look for the price to correct here. Execute a BUY (Long) upon confirmed H1/M30 candle reversal signals.
2. DEEPER STRATEGIC BUY:
Zone: 4,145.676 (Our major Order BUY zone).
Zone 2: 4124 - 4120 (Fibo Extension Buy Zone).
Action: If the first zone fails, be ready to load up at these deeper accumulation points.
3. TAKE PROFIT TARGET:
Target: 4264 - 4268 (The Fibo Extension Sell Zone).
AD Note: Sells are only for quick scalps; we wait for the major Fibo reaction at 426x.
⚠️ Immediate Focus: WAIT for the 419x retest. Discipline is key to catching this trend continuation!

Gold Pulls Back From All-Time High – Correction Looks Limited📊 Market Overview
Gold slightly corrected from its all-time high near $4,239, showing early signs of a short-term pullback, but the overall trend remains bullish.
Despite the correction, fundamental sentiment still supports Gold:
💬 US–China trade tensions and geopolitical risks continue to fuel demand for safe-haven assets.
💵 The US Dollar remains under pressure amid expectations of a Federal Reserve rate cut later this year.
⚖️ Ongoing concerns about a possible US government shutdown further enhance Gold’s attractiveness.
These factors suggest that the current dip is likely a healthy correction within a strong uptrend, not a reversal.
🧠 Technical Structure (MMFLOW Wave View)
Gold has likely completed a minor Wave (V) on the M30 chart, forming a new ATH Zone near 4,239.
Currently, price is unfolding a corrective A–B–C pattern, expected to find support at key liquidity zones before resuming the uptrend.
Our model highlights two potential BUY setups and a short-term SELL scalp opportunity for today’s trading session.
🔑 Key Levels to Watch
🔵 BUY Setup 1
Zone: 4,184 – 4,182
SL: 4,178
TP: 4,188 – 4,192 – 4,196 – 4,200 – 4,210 – 4,220 – ???
🟢 BUY Setup 2 (Deeper Retrace)
Zone: 4,148 – 4,146
SL: 4,140
TP: 4,152 – 4,156 – 4,160 – 4,170 – 4,180 – 4,190 – 4,200
🔴 SELL SCALP Opportunity
Zone: 4,230 – 4,234
SL: 4,238
TP: 4,220 – 4,215 – 4,210 – 4,200 – 4,190 – ???
⚙️ MMFLOW Trading View
📈 Price is currently respecting Wave (A) of the correction.
We expect a possible (B) retracement toward 4,220 – 4,230, followed by (C) decline completing near 4,147 – 4,150 (Fibo 0.618 / CP Buy Zone).
From there, Smart Money may re-enter long positions targeting a fresh liquidity sweep toward the 4,285 SELL ZONE.
In short:
The uptrend remains intact, only a short-term correction is unfolding.
Patience is key — best opportunities will likely appear around 4,150 – 4,180 range.
The structure aligns perfectly with both technical confluence (Elliott + Liquidity Zones) and macro sentiment.
If the market holds above 4,140, Gold could aim for new highs toward 4,285 – 4,300 in the next few sessions.
However, traders should:
✅ Always use Stop Loss — volatility is high near record highs.
✅ Avoid overtrading in narrow pullback zones.
✅ Focus on reaction at key liquidity levels before entering.
⚡️ Summary
Gold remains technically bullish with limited downside correction.
Watch for price reaction around 4,184 and 4,147 — both zones represent strong liquidity areas where Smart Money may look to buy again.
After completing this correction, a new impulsive leg up toward 4,285+ could unfold, potentially marking the next all-time high.

XAUUSD – Safe-Haven Flows Continue to Support GoldMarket Context:
Gold has attracted strong buying for the fourth consecutive session, supported by a mix of global risk factors: renewed US–China trade tensions, rising geopolitical uncertainty, and growing fears of a prolonged US government shutdown.
Meanwhile, dovish expectations from the Federal Reserve are keeping the USD under pressure — further enhancing the appeal of gold as a non-yielding safe-haven asset.
During the Asian session, XAU/USD printed a fresh all-time high, with bulls now eyeing a potential extension toward the 4,200 USD/oz region amid escalating global concerns.
Technical Outlook (M30):
Gold continues to respect its ascending channel structure, maintaining dynamic support between 4,167 – 4,154.
As long as price holds above 4,139, the broader trend remains bullish, with the next liquidity target sitting at 4,240 – 4,241.
Key Zones to Watch:
Liquidity Sell Zone: 4,240 – 4,242
ATH Zone / Short-Term Resistance: 4,190 – 4,200
OBS Buy Zone – CP Trendline Support: 4,141 – 4,139
Secondary Buy Zone: 4,114 – 4,112
Trading Plan:
🔹 BUY Zone
Entry: 4.141 – 4.139
SL: 4.134
TP: 4.145 → 4.150 → 4.155 → 4.160 → 4.170 → 4.180
🔹 BUY Zone
Entry: 4.114 – 4.112
SL: 4.106
TP: 4.120 → 4.125 → 4.130 → 4.140 → 4.150
🔹 SELL Zone (Scalp Reaction)
Entry: 4.240 – 4.242
SL: 4.248
TP: 4.235 → 4.230 → 4.225 → 4.220 → 4.210 → 4.200
Summary:
The bullish market structure remains intact as long as price holds above the 4,139 zone.
Watch for potential long opportunities from 4,141 – 4,139, where the confluence of trendline and order block support could trigger fresh demand.
Bulls remain in control, targeting the 4,240 – 4,241 liquidity area in the coming sessions.
📊 What’s your take — will gold break above 4,200 or pause for a correction first?
👉 Follow MMFLOW TRADING for daily market structure insights and institutional-style setups.
🟣 Chart: XAUUSD M30 – Smart Money Flow structure highlighting liquidity pools, CP confluence and key buy/sell zones.

XAU/USD – Buyers Reclaim Structure, Targeting Liquidity Zone🔍 Market Context
After a strong Liquidity Sweep yesterday, gold has rebounded and formed consecutive Break of Structure (BoS) , confirming buyers have regained control.
The price has now filled the Fair Value Gap (FVG 4,191 – 4,202) and is heading towards the Sell Liquidity Zone 4,237 – 4,240 USD — a concentration of pending sell orders and stop-losses from previous short positions.
The current structure shows strong bullish momentum , however, the possibility of a correction from this high liquidity area is noteworthy.
💎 Technical Analysis
Liquidity Sweep: Completed, clearing liquidity below 4,070.
FVG (Fair Value Gap): 4,191 – 4,202 → filled, confirming price balance.
Sell Liquidity Zone: 4,237 – 4,240 → potential resistance zone, likely strong reaction.
OB Zone | Buy: 4,143 – 4,145 → nearby support, expected first reaction when price corrects.
OB Deep | Buy: 4,110 – 4,115 → deep demand zone, confluence with Premium Zone 4,156 – 4,118.
Overall Structure: The main trend remains bullish , with strong upward momentum but requires a technical correction for re-accumulation.
📈 Trading Scenarios
1️⃣ Main Scenario – Sell reaction at liquidity zone
When the price approaches the Sell Liquidity Zone 4,237 – 4,240 USD , observe candlestick reaction (rejection, bearish engulfing).
If confirmation signals appear, open a short-term sell order .
Target: OB Buy Zone 4,145 → 4,110 USD.
Stop Loss: above 4,245 USD.
➡️ This is a liquidity reaction setup, high probability when the market encounters resistance confluence with Fibonacci zone 0.786–1.0.
2️⃣ Alternative Scenario – Buy with trend from OB
If the price corrects to the OB Zone 4,143 – 4,145 USD and shows a clear reaction (strong rejection or minor structure break),
→ a buy with the main trend can be opened.
Target: return to 4,200 → 4,235 USD.
Stop Loss: below 4,130 USD.
If the price drops further, the OB Deep Buy 4,110 – 4,115 USD will be the final “liquidity attraction” zone for a new upward bounce.
⚠️ Risk Management
Avoid FOMO buying at 4,200+ as it is near the liquidity resistance zone.
Prioritise short-term sell at 4,237 if clear signals are present.
When price corrects to OB, wait for reaction before buying, do not bottom fish early.
💬 Conclusion
After completing the liquidity sweep, gold has confirmed a return to bullish structure with multiple consecutive BoS.
Currently, the price is approaching the liquidity zone 4,237 USD – a short-term correction is highly likely.
The 4,145 – 4,110 USD zone will be where buyers await reaction to accumulate orders and continue the medium-term uptrend.
👉 Reasonable Strategy:
Short sell at 4,237 USD if reversal signals are present.
Wait to buy at OB zone 4,145 – 4,110 USD when clear reaction occurs.

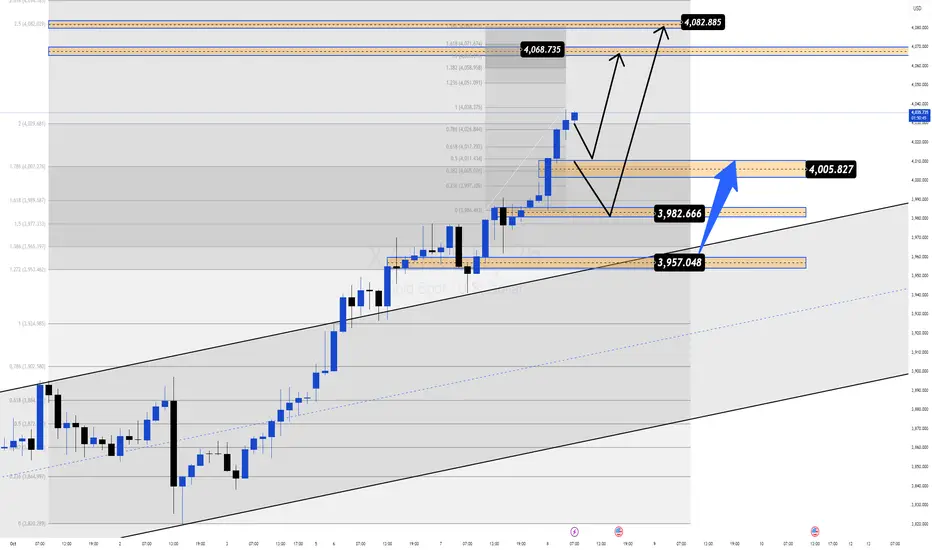
XAUUSD 1H Buy Limit Projection — 15.10.25🟡 Overall Setup
This is a 1-hour timeframe projection chart for XAUUSD (Gold vs USD). The market is currently in a strong uptrend, moving inside an ascending channel (blue trendline).
The price at the time of projection: $4,198.76
🧭 Key Zones & Plan
Entry Zone (Buy Limit):
Marked at $2203–$2206 (FVG zone — Fair Value Gap).
The chart suggests to wait for breakout and retest of the yellow zone before buying.
Support Zone:
Highlighted in yellow box, indicating strong demand area where the breakout is expected to happen.
“CANDLE MOVEMENT AREA” below shows the probable pullback path.
Trade Timing:
Suggested after 11:30 AM (October 15).
Waiting for structure confirmation before entry.
🏁 Target Levels
TP 1: Around $4,228 – $4,243 (0.5–0.618 Fibonacci zone).
TP 2: Around $4,320, which is the top of the ascending structure.
⚠️ Stop Loss Zone
SL is placed below $4,165, under the yellow demand zone.
Protects against false breakout.
📈 Price Movement Projection
The black line arrows project the expected retracement down to entry zone, then bullish breakout and rally upward toward target zones.
Trend continuation is expected until tomorrow with breakout & retest.
✅ Summary of Strategy:
Trend: Bullish
Action: Buy at retest zone (2203–2206)
TP: 4243 (TP1) / 4320 (TP2)
SL: Below 4165
Timing: After 11:30 AM IST

GOLD AT ATH! $4,200 BATTLE – Which Fibo Zone Fires First?Gold is fiercely battling the $4,200 mark after hitting a new All-Time High near $4,220. Bulls are pausing, but macro risks (geopolitics, trade war warnings) keep the trend Long. Our focus: Sniping the Reaction Zones.
🎯 THE FIBO ACTION ZONES (H1/M30)
1. STRATEGIC BUY ZONE (Optimal Long Entry):
Zone 1: 4162 - 4158 (The crucial Fibo Retest/0.618 support).
Zone 2: 4144 - 4140 (Deeper strong support).
Action: Wait for the pullback into 4162 - 4158 and execute a BUY upon bullish confirmation.
2. SELL/TP ZONES (Profit Taking & Resistance):
TP Target 1: 4208 - 4212 (Immediate Fibo Resistance).
TP Target 2: 4225 - 4250 (Fibo Extension 1.5 - 1.618).
Action: Look for SCALP SELL opportunities or take profits (TP) here if price rejects these levels.
📈 TODAY'S MOVE: Patience for the 416x retest. Join the Long trend aggressively only after a solid bounce confirmation!
⚠️ Risk Management: Keep SL tight below your chosen BUY Zone. Discipline over FOMO!

GOLD CRASH ALERT: +60 PRICES DUMP! Waiting for the Ultimate Fibo React BUY Zone.
FranCi$$_FiboMatrix Emergency Action Plan
Gold just suffered a brutal 60-point plunge from 416x to 411x, triggered by mounting geopolitical tensions. The market is volatile, and deep correction is highly likely. We must trade smart, not emotionally.
🎯 EMERGENCY ACTION ZONES (H1/M30)
Avoid chasing! We only trade when price hits our calculated FIBO REACTION ZONES.
1. SCALP SELL RETRACEMENT:
Zone 1 (High): Watch the 407x area (4,077.605).
Zone 2 (Key Fibo Resistance): The 405x area (4,048.493).
Action: If price bounces back into either zone, look for strong bearish rejection to execute a SCALP SELL.
2. CRITICAL BUY REACT ZONE (The Lifeline):
Zone: We are waiting for the AD's updated FIBO REACTION zones that conform to the new deep trend.
Action: DO NOT BUY BLINDLY. Only enter a Long when the price reaches these deeper support levels and gives a strong, confirmed BUY REACT signal.
⚠️ Immediate Focus: OBSERVE & WAIT. The AD will provide continuous updates. Manage risk strictly—this volatility demands discipline!

XAUUSD – Sharp Pullback After Hitting New ATHMarket Context:
Gold has seen a steep intraday drop after hitting a fresh all-time high at 4,179 USD/oz, extending beyond the morning target of 4,170–4,172.
The move likely reflects profit-taking amid broader market caution, as the US Dollar strengthened and GBP fell sharply, indirectly weighing on XAUUSD.
Silver also followed the correction, down over 2%, trading near 51 USD/oz after peaking at 53.60 earlier.
Despite this drop, the overall market sentiment remains defensive — both metals are still up about 2% for the week, suggesting this is a technical retracement, not a full trend reversal.
Technical Outlook (M30):
Price has broken below the short-term rising channel and is now retesting key liquidity areas.
Watch the 4,134 – 4,135 zone for a potential retest (50% pullback) before continuation toward lower buy zones.
End Liquidity Sell Zone: 4,165 – 4,170
Retest Zone (50% Down): 4,134 – 4,135
CP Buy Zone / Fibo 0.618: 4,052 – 4,054
OBS Buy Zone: 4,000 – 4,005
Trading Plan:
🔹 Sell Setup (Correction Play):
Entry: 4,134 – 4,136
Stop Loss: 4,142
Take Profit: 4130 - 4125 - 4120 - 4110 - 4100 - ???
🔹 Buy Setup (Reaction Zone):
Entry 1: 4,052 – 4,054 (Fibo 0.618 Confluence)
Stop Loss: 4,044
Take Profit: 4056 - 4060 - 4065 - 4070 - 4080 - 4090 - ???
Summary:
Gold’s sharp drop after a new ATH signals a short-term correction phase while the broader bullish trend stays intact.
A pullback toward 4,052 or even 4,000 could attract buy-side liquidity before any recovery.
Keep an eye on 4,135 for a potential retest before continuation.
📊 What’s your view — is this just a healthy retracement or the start of a deeper correction?
👉 Follow MMFLOW TRADING for precise intraday setups and structure-based analysis.

XAU/USD – Liquidity Cleared, Gold Reloads for the Next Breakout🔍 Market Context
This morning, gold price (XAU/USD) experienced a classic liquidity sweep :
The price surpassed the previous high of 4058 , touched 4060 , wicked strongly , and short-term corrected – a textbook “liquidity hunt” by major funds.
After this drop, the price recovered back to the old ATH zone (4055 – 4060) .
This indicates that short-term sellers have weakened , and buyers are reclaiming the crucial structure zone .
Therefore, selling strategy is no longer optimal , instead, the market is preparing for a re-accumulation – next breakout.
💎 Technical Analysis
Current ATH: 4060 USD
Previous High: 4058 USD
This morning's liquidity sweep “cleared out” liquidity above, paving the way for a re-accumulation phase before the next rise.
The zone 4048 – 4052 is acting as a retest zone – if it holds, this could be the “launchpad” for a breakout to higher price zones.
Overall Structure: still bullish , no signs of medium-term reversal.
⚙️ Key Price Zones
Retest Zone: 4048 – 4052 → support zone after the sweep, where the price might bounce back.
Breakout Zone: 4065 – 4070 → zone confirming buyers regain dominance.
Extended Target: 4090 – 4100 USD.
Invalidation Zone: below 4040 USD → if breached, the short-term bullish structure will weaken.
📈 Trading Scenarios
1️⃣ Buy Continuation Scenario – Buy with the main trend
Wait for the price to retest the 4048 – 4052 zone , observe bullish candle reactions or confirmation signals (Engulfing, Rejection).
Open a buy order upon confirmation of holding the support zone.
Target: 4065 → 4090 USD.
Stop Loss: below 4040 USD.
➡️ This is a trend-following scenario, with the highest probability when the market has completed the liquidity sweep and is re-accumulating.
2️⃣ Buy Breakout Scenario – Buy on confirmed breakout
If the price breaks and closes above 4065 , it signals that major funds have returned.
Open buy stop or limit retest breakout around 4065 – 4070.
Extended Target: 4090 → 4100 USD.
Stop Loss: below 4050 USD.
➡️ This scenario suits momentum traders, avoiding the risk of “fake breakout” by waiting for clear confirmation.
⚠️ Risk Management
Do not sell against the trend at the ATH zone, as liquidity above has been taken.
Maintain reasonable volume when trading around the peak zone.
Prioritize buying when there is confirmation of the bullish structure holding the 4050 zone .
💬 Conclusion
This morning's liquidity sweep has shaken out weak hands , while helping gold pave the way for the next rise .
Currently, the price is re-accumulating around the old peak zone 4055 – 4060 , and if the zone 4048 – 4052 continues to hold, there is a high possibility that gold will break out to the 4090 – 4100 USD zone in the upcoming sessions.
👉 Reasonable Strategy:
Wait to buy at the support zone or buy when the price breaks above 4065.
Avoid selling against the trend now – the risk is very high as major funds have shifted to the accumulation phase.

XAU/USD: GOLD HITS NEW ATH! Buy or Sell Now?Gold (XAU/USD) is absolutely on fire, hitting a Fresh All-Time High (ATH) this morning! This massive breakout isn't random; it's a direct outcome of global risk factors lining up, making gold the ultimate safe haven:
🇺🇸🇨🇳 Trade War Reloaded: Trump's shocking 100% tariff threat on China exports has brought back major global uncertainty. Though he's softened his tone, the damage to sentiment is done, pushing money into gold.
⚠️ Geopolitical Heat: Warnings about sending Tomahawk missiles to Ukraine keep geopolitical tensions brewing, acting as a continuous tailwind for the metal.
🏛️ US Shutdown Drama: The ongoing US government funding deadlock is a big worry, further driving flight-to-safety flows.
✂️ Fed Rate Cut Confidence: High probability of Fed rate cuts in Oct/Dec (96%/87%) provides strong support, reducing the opportunity cost of holding non-yielding gold.
🔍 TECHNICAL ANALYSIS: Structure is Full-On BULLISH!
The price action today is textbook, showing exactly how Smart Money operates:
Liquidity Sweep & FVG: Price first wicked sharply below 4000 for a classic Liquidity Sweep—hunting weak hands' Stop-Losses—and created a temporary Fair Value Gap (FVG), before reversing with massive momentum.
Structural Break (BOS & MSS): This aggressive move resulted in a clean Break of Structure (BOS) above the old ATH at 405x, confirming a major Market Structure Shift (MSS). The trend is now unequivocally BULLISH.
Trading Plan - The Right Way:
Priority: Stick with BUY positions! The bias remains bullish as long as price holds above the Order Block (OB) support at 405x. This is the key level.
Big Warning: Don't try to short the top (sell dò đỉnh)! The risk of getting caught in a liquidity grab or price trap at these highs is extremely high. Stay away from counter-trend moves.
Sell Scenario (Only if): We only consider a short-term SELL if there's a strong, confirmed candle close below 405x. In that case, we might target a minor pullback to 4000 for profit booking, but the main goal remains to BUY on dips.
👉 Bottom Line: Fundamentals and technicals are singing the same tune. 405x is the line in the sand. Trade carefully, manage your stop-loss, and always do your own research (DYOR).
#GOLD #XAUUSD #ATH #MarketUpdate #TradeWar #FED #SmartMoney #ICT #TechnicalAnalysis #SafeHaven #DYOR

Sniping the Next BUY Zone for Maximum Gains.The sentiment is clear: Bulls are running the show, preparing for potentially an eighth consecutive weekly gain. Our strategy is simple—wait for the intelligent retest to join the momentum.
🎯 THE TARGET ZONES (M30/H1)
We're focusing on the two most crucial zones derived from Fibo React Logic:
1. PRIME BUY ENTRY (The Sweet Spot):
Zone: 4018 - 4014 (Our key Fibo Retest Zone).
Action: Wait for Gold to pull back to this area. Execute a BUY (Long) only upon confirmed M30/H1 candle rejection (e.g., Bullish Engulfing/Pin Bar).
2. TAKE PROFIT TARGET (The Next Peak):
Zone: 4094 - 4098 (Fibo Extension/SELL React Zone).
Action: This is the primary TP for our Long entries, representing the next major target for the buyers.
📈 TRADING SCENARIO
Strategy: Patience is key. Let the market retrace to 4018 - 4014. Once confirmation hits, ride the wave up to 4094 - 4098.
🚨 Risk Alert:
Be disciplined with your Stop Loss. Maintain strict risk management, especially if the price fails to hold the 4018 - 4014 zone.
Let's trade with precision today!

XAUUSD – Safe-Haven Demand Keeps Gold StrongMarket Overview:
Gold stays firm as fresh US–China trade tensions and ongoing geopolitical concerns push investors toward safe assets.
Expectations of another Fed rate cut are putting pressure on the USD, giving extra strength to gold.
Even though short-term indicators show some overbought signs, overall sentiment still favours the bulls.
Near-Term Outlook:
As long as price remains inside the rising channel, we expect a possible move toward the 4,090–4,100 liquidity zone.
A rejection from 4,092–4,095 could lead to a short-term pullback before continuation.
Important Levels:
Liquidity Buy Zone 1: 4,039 – 4,037
Liquidity Buy Zone 2: 4,017 – 4,015
Liquidity Sell Zone: 4,092 – 4,095
Support: 4,010 – 4,000
Resistance: 4,110 – 4,126
Trading Plan:
🔹 Buy Setup #1
Entry: 4,039 – 4,037
Stop Loss: 4,032
Targets: 4,044 → 4,048 → 4,052 → 4,056 → 4,060 → 4,070
🔹 Buy Setup #2
Entry: 4,017 – 4,015
Stop Loss: 4,010
Targets: 4,022 → 4,026 → 4,030 → 4,040 → 4,050 → 4,060
🔹 Sell Setup (Scalp Opportunity)
Entry: 4,092 – 4,095
Stop Loss: 4,100
Targets: 4,090 → 4,085 → 4,080 → 4,070 → 4,060
Summary:
Bias stays bullish while gold holds above 4,015 – 4,020.
Safe-haven demand and softer USD outlook continue to support the upside move.
Look out for a liquidity sweep around 4,092 before further continuation upward.
📊 What do you think — will gold break higher or reject from 4,090?
👉 Follow MMFLOW TRADING for daily market structure updates and precise trade plans.
🟣 Chart: XAUUSD H1 – Smart Money Flow structure highlighting liquidity areas and OB zones.

XAUUSD / GOLD 1H BUY PROJECTION – 12.10.25The 1H structure is showing a clean breakout and retest, indicating strong bullish continuation.
✅ Technical Breakdown:
Price broke above the resistance zone and retested the breakout level, confirming support at $4,007–$4,012.
Fibonacci 0.618 Golden Ratio aligned with the support adds confluence for a long setup.
An upward trendline is being respected, signaling controlled bullish structure.
A fair value gap remains unfilled below, but since it’s in the order block zone, it’s less likely to break for a sell.
Strong bullish momentum candles indicate buyers in control.
🎯 Targets:
TP1: $4,030 (Resistance R1)
TP2: $4,050 (Resistance R2 / ATH Zone)
🛡️ Invalidation:
A clean break below $3,996 (order block zone) would weaken this bullish projection.
📈 Summary:
Entry: $4,007–$4,012 zone after retest
TP1: $4,030
TP2: $4,050
SL: Below $3,996
Bias: Bullish
Timeframe: 1H
⚠️ Always use proper risk management and follow the trend structure.

$4024 Gold: 8-Week Jhakaas Record! BUY Pivot $398x!Hello, traders!
Gold just wrapped up an impressive 8-week winning streak, closing the session at $4,024.40/oz (Futures). This bada (big) rally was immediately triggered by President Trump's unexpected tariff threat on China, which, boss, fueled a massive rush toward safe-haven assets.
Fundamentals & Technical Bias: Buying the Pivot
Core Drivers: Escalating trade panga (conflict) thanks to Trump, steady Fed rate cut expectations, and ongoing global gadbadi (instability) are all making Gold the top safe haven.
Technical Recovery: After a deep correction to $394x, Gold recovered super fast and closed firmly above $399x. This confirms that buying power is dominant and the bullish momentum is pakka (confirmed).
Priority Bias: BUY (Long). $398x is the critical short-term pivot point. Risk management is key, remember that.
Risk Warning: Only switch to SELL (Short) if the price rapidly breaks below $398x due to major negative news.
Key Price Levels:
Resistance: $4064, $4084, $4104, $4124
Support: $3984, $3951, $3934
Trading Strategy (Prioritize BUY at the Pivot)
BUY ZONE (Pivot $398x): $3984 - $3982
SL: $3974
TPs: $3992, $4002, $4012, $4022, $4032
SELL ZONE (Counter-Trend): $4024 - $4026
SL: $4034
TPs: $4016, $4006, $3996, $3986, $3976
Will this trade war tension take Gold past $4100 next week? Kya lagta hai? 👇
#Gold #XAUUSD #4KGold #TrumpTariffs #8WeeksUp #Pivot #TradingView #PaisaBanega

GOLD: The Dollar Blinks! Time to 'Pay' at the 0.618 Fibo (4018) The Macro Play: USD Retreat Sets the Stage for Gold's Counter-Attack
The precious metal is catching a bid as the US Dollar softens after hitting its recent highs. The fundamental backdrop is keeping Gold buoyant:
Fed Pivot Narrative: Despite the hawkish undertones in the last FOMC meeting minutes, the market's conviction in two potential Fed rate cuts by year-end remains a powerful tailwind, making non-yielding Gold more attractive.
Geopolitical Fog: While the short-term truce news caused a minor retreat, the overarching safe-haven demand driven by global tensions and the looming US government funding crisis provides critical floor support.
Bottom Line: Gold is navigating a choppy consolidation phase. Short-term pressure exists, but the Long-Term Macro Thesis favors a cautious recovery.
📊 The MatrixFibo PTKT: SCALP Zones Are Active!
Price action shows clear reaction points within the recent sharp move lower. Our plan is to Trade the Reactions at these high-probability confluence zones.
1️⃣ The Aggressive SELL Zone (SELL SCALP Setup)
We are looking for the market to exhaust its short-term recovery rally at major resistance levels.
Primary SELL ZONE: 3997 - 4000 (0.5 Fibo Level):
This area is critical psychological resistance and the 50% retracement of the latest impulse down.
PLAN: Await a failed breakout or clear bearish rejection signal (Pinbar, Bearish Engulfing) at 3997 - 4000.
TARGET: The move should aim to clear the lows, heading straight for 3915 - 3910.
The Ultimate SELL Reversal: 4014 - 4018 (0.618 Fibo Downtrend Zone):
This is the REACTION FIBO 0.618 DOWNTREND H1 ZONE. This level is our strongest strategic SELL point if the bounce extends deeper.
2️⃣ The Key BUY Zone (BUY SCALP Setup)
We treat this area as the final line of defense for the current uptrend structure.
Key Support & BUY SCALP REACT ZONE: 3915 - 3910:
This zone is a Major Confluence point: Key Support, the 0.786 Fibo, and the Uptrend Channel Bottom.
PLAN: Look for strong buying pressure to emerge as price tests 3915 - 3910. Requires a solid Bullish Price Action Confirmation.
TARGET: A successful bounce targets the liquidity back at 3997 - 4000.
🛑 FranCis MatrixFibo Risk Policy
Volatility Alert: Expect large swings around US data and Fed commentary. NEVER TRADE WITHOUT A HARD STOP LOSS (SL) on SCALPS.
Strategy Focus: The market is range-bound. Stick to a Two-Sided Scalping Plan defined by the identified price levels.
Discipline: Only enter trades at or with clear confirmation from the React Zones.

XAUUSD – Breakdown After Ceasefire & Fed Comments📉 Market Overview
Gold (XAUUSD) dropped over 2%, sliding from $4,012/oz to $3,945/oz, marking a sharp $67 decline overnight.
The selloff came as two key catalysts hit the market:
🕊 Israel–Hamas ceasefire agreement cooled down geopolitical tensions.
💬 Fed’s Barr pushed back against October rate cuts, sending USD higher and pressuring gold.
Despite the drop, price action suggests a temporary corrective phase, with gold now stabilising near a short-term support zone.
📊 Technical Structure (MMFLOW View)
Gold has confirmed a Head & Shoulders (H&S) breakdown pattern, with a neckline retest around $4,014 – $4,033 acting as resistance.
After the breakdown, price rebounded slightly but continues to trade below the structure, showing that bears remain in control short-term.
The short-term support zone sits around $3,945, and if broken, could accelerate the decline towards $3,912 – $3,885, aligning with deeper liquidity areas.
🔑 Key Zones to Watch
Resistance (Breakdown Zone): 4,014 – 4,033
Support (Short-term): 3,945 – 3,912
Liquidity/Buy Zone: 3,885 – 3,878
💡 MMFLOW Trading Scenarios
🔵 BUY SCALP Zone: 3,912 – 3,910
🔴 Stop Loss: 3,905
✅ Take Profit: 3,916 – 3,920 – 3,925 – 3,930 – 3,940 – 3,950 – ???
Trading View:
The market is still digesting recent fundamentals; volatility remains high.
A short-term rebound from 3,910 is possible as liquidity builds up near this demand zone.
However, unless price reclaims 4,014, any bounce may only be corrective before further downside continuation.
🧭 MMFLOW Insight
Even though gold faces bearish momentum, macro risks still support a long-term bullish narrative:
U.S. government shutdown risks remain unresolved.
Fed may turn dovish later in Q4 if labour data weakens.
Liquidity gaps below $3,900 could attract smart money accumulation zones.
⚠️ Trading Notes
✅ Always set Stop Loss – NFP-style volatility can occur post-Fed comments.
✅ Avoid chasing after breakdown candles. Wait for pullback entries at key levels.
✅ Be patient — the best setups form when liquidity is fully absorbed.
📍 Summary
Gold continues to trade under pressure after geopolitical easing and hawkish Fed tones.
Watch for price action around $3,910 – $3,945; this range will likely define the next major impulse.
Stay alert — once liquidity clears, MMFlow will be watching for smart-money reentry signals from key OB/CP zones.

Gold (XAU/USD) Rebound Setup – Support Holding Strong!Analysis:
Gold (XAU/USD) is showing signs of bullish strength after testing the $4,000–$3,970 support zone, where buyers are stepping back in. The recent consolidation above support suggests a potential reversal and continuation of the uptrend.
The setup highlights:
Support Zone: Around $3,970 – $4,000, acting as a key accumulation area.
Bullish Trigger: A breakout above minor resistance could drive momentum higher.
Targets:
🎯 Target 1: $4,101
🎯 Target 2: $4,150
🎯 Target 3: $4,200
Stop Loss: Below $3,970 to protect against a downside breakout.
📈 Outlook: As long as price sustains above support, Gold remains bullish, aiming for a breakout towards $4,150 and $4,200 levels.

XAUUSD| Unstoppable Uptrend, Gold Benefits from Fed & ETF Inflow📊 Market Context
Gold continues to maintain its upward trend amidst the political and economic instability in the US. The US government has entered its second week of shutdown with no signs of reaching an agreement, raising further concerns about the impact on economic performance.
Simultaneously, the Fed's entry into a monetary easing cycle since September, with expectations of further 25-point rate cuts in October and December, is driving strong buying momentum in gold.
Not just investors, but global central banks are also continuing to accumulate gold, adding 15 tonnes to reserves, indicating a gradual shift away from US public debt.
All these factors combined continue to reinforce a sustainable upward trend, opening up opportunities for strategic BUY moves.
🔎 Technical Analysis (H1/H4)
Prices remain within the upward channel, continuously retesting and bouncing off support zones.
Buy Scalp Zone 4004–4002: a quick reaction zone in the short term.
Main Buy Zone 3986–3984: key support, combined with FVG.
Target Resistance: 4068–4082 (Liquidity Zone).
📈 Trading Plan
✅ BUY SCALP: 4004–4002
SL: 3996
TP: 4008 - 4012 - 4016 - 4020 - 4030 - 4040 - ????
✅ BUY ZONE: 3986–3984
SL: 3980
TP: 3990 - 3995 - 4000 - 4010 - 4020 - 4030 - 4040 - ????
⚠️ Risk Management Note
The 4000 level is a psychological resistance – prone to liquidity sweeps.
Prioritise waiting for clear price action signals at BUY zones.
Adjust volume sensibly as volatility may increase with political news & Fed impacts on market sentiment.
✅ Summary
Gold's uptrend remains solid thanks to political instability, Fed easing, record ETF inflows, and central banks continuing to hoard gold. Strategy prioritises BUY at 4004–4002 and 3986–3984 with targets aiming at 4068–4082.
GOLD UPDATE – Bulls Defend $4,000 Ahead of Powell’s SpeechGold continues to hold firm above the key $4,000 psychological level, even after a sharp correction from the all-time high near $4,059. The market’s focus now shifts to Fed Chair Jerome Powell’s speech, which could set the tone for the next directional move.
Despite the recent dip, the overall structure remains bullish, and the FiboMatrix setup still signals that buyers are not out of the game yet.
Technical Structure (H1 – FiboMatrix View)
Support Zone (BUY Setup):
4010 – 4012 → Retest of breakout trendline + Fibo 0.618 reaction zone.
Strong intraday base where liquidity may reload for another bullish leg.
Reaction Buy Zone:
402x → Potential confirmation area if price reacts positively.
Resistance Zone (ATH):
4060 → Previous intraday top, acting as the first major barrier before retesting 408x.
SELL Reaction Zone:
4084 – 4086 → Fibo 1.5 – 1.618 expansion zone, potential scalp short zone with tight stop above 4090.
🎯 Trading Plan (Francis Strategy)
✅ BUY Setup:
Entry: 4010 – 402x (wait for confirmation).
TP1: 4060
TP2: 4084
SL: Below 3996
⚠️ SELL Setup (Short-term scalp):
Entry: 4084 – 4086 (if rejection forms).
Target: 4040 → 4020
SL: Above 4096
🔑 Francis Outlook
Gold’s short-term correction looks more like a controlled retracement than a trend reversal.
As long as the price holds above the $4,000 handle, the bullish bias stays intact.
👉 Expect potential consolidation before Powell’s remarks, followed by a sharp reaction depending on the tone of his speech.
A clean breakout above 4060 – 4086 will open the path toward $4,100+ and new ATH targets.
🚀 Trend Bias: Bullish above 4010 – Buy the Dip, Sell only at Fibo extremes with confirmation.
