GOLD UPDATE – Bulls Defend $4,000 Ahead of Powell’s SpeechGold continues to hold firm above the key $4,000 psychological level, even after a sharp correction from the all-time high near $4,059. The market’s focus now shifts to Fed Chair Jerome Powell’s speech, which could set the tone for the next directional move.
Despite the recent dip, the overall structure remains bullish, and the FiboMatrix setup still signals that buyers are not out of the game yet.
Technical Structure (H1 – FiboMatrix View)
Support Zone (BUY Setup):
4010 – 4012 → Retest of breakout trendline + Fibo 0.618 reaction zone.
Strong intraday base where liquidity may reload for another bullish leg.
Reaction Buy Zone:
402x → Potential confirmation area if price reacts positively.
Resistance Zone (ATH):
4060 → Previous intraday top, acting as the first major barrier before retesting 408x.
SELL Reaction Zone:
4084 – 4086 → Fibo 1.5 – 1.618 expansion zone, potential scalp short zone with tight stop above 4090.
🎯 Trading Plan (Francis Strategy)
✅ BUY Setup:
Entry: 4010 – 402x (wait for confirmation).
TP1: 4060
TP2: 4084
SL: Below 3996
⚠️ SELL Setup (Short-term scalp):
Entry: 4084 – 4086 (if rejection forms).
Target: 4040 → 4020
SL: Above 4096
🔑 Francis Outlook
Gold’s short-term correction looks more like a controlled retracement than a trend reversal.
As long as the price holds above the $4,000 handle, the bullish bias stays intact.
👉 Expect potential consolidation before Powell’s remarks, followed by a sharp reaction depending on the tone of his speech.
A clean breakout above 4060 – 4086 will open the path toward $4,100+ and new ATH targets.
🚀 Trend Bias: Bullish above 4010 – Buy the Dip, Sell only at Fibo extremes with confirmation.
Xauusdupdates

$4070 Gold: New Record! Recent Dip Was a Bada Sell Trap?Hello, traders!
Gold just set a New Record at $4,070.5/oz (Futures). Kya momentum hai! This rally, up 54% YTD, is fueled by two main engines, boss: 1) Confirmed Fed rate cuts (FOMC Minutes pakka it) and 2) Super-strong safe-haven demand due to global gadbadi (US Shutdown, conflict, etc.).
Technical Analysis & BUY Dips Strategy Confirmed
That sharp pullback from $405x to $4000 (the Fib 0.5 zone) made many people panic-sell. But look closely: buyers overpowered them and broke $402x resistance.
Technical Conclusion: That dip was clearly a Sell Trap and just a Consolidation phase. The primary bias is confirmed: BUY on Dips is the absolute priority. Risk ko control karo.
Risk Warning: If $4000 is cleanly broken with heavy volume, then long positions will be in trouble.
Key Price Levels:
Resistance: $4049, $4057, $4064, $4074, $4084, $4094
Support: $4021, $4009, $3992, $3978
Trading Strategy (Prioritize BUY at Support)
BUY SCALP: $4019 - $4017
SL: $4013
TPs: $4023, $4028, $4033, $4038
BUY ZONE (Strong Demand): $3992 - $3990
SL: $3982
TPs: $4000, $4010, $4020, $4030, $4040
SELL SCALP: $4056 - $4058
SL: $4062
TPs: $4053, $4048, $4043, $4038
SELL ZONE (High Risk): $4084 - $4086
SL: $4094
TPs: $4076, $4066, $4056, $4046, $4036
Will this momentum take us past $4100 this week? Chalo, dekhte hain! 👇
#Gold #XAUUSD #4070USD #ATH #Fed #BUYDIPS #SellTrap #TradingView #PaisaBanega

Bulls Reloading After a Healthy Pullback | Next Target: 4090+📊 Market Context
After a powerful bullish rally that pushed gold to record highs, XAUUSD retraced about 1% on Thursday as traders took profit from the recent surge. However, this move appears to be a technical correction, not a trend reversal — as indicators have shown overbought conditions for several sessions.
Despite this short-term pullback, the long-term uptrend remains intact.
Gold is up more than 50% year-to-date, driven by:
🌍 Ongoing geopolitical and trade tensions,
💰 The Federal Reserve’s monetary easing cycle,
🏦 Record central bank gold accumulation,
⚔️ Rising global uncertainty, fueling strong safe-haven demand.
Overall, this retracement could be an ideal setup for BUY re-entries, as bulls look to reload positions toward the 4090–4100 liquidity zone.
🔎 Technical Analysis (H1/H4)
Price remains inside the medium-term bullish channel, showing strong reactions around 4000–3980 support.
4010–4008 acts as a quick scalp zone for short-term entries.
3984–3982 serves as a key structural support and liquidity reaction area.
4090–4092 (Liquidity Sell Zone) stands as the major resistance — potential liquidity trap area.
📈 Trading Plan
✅ BUY SCALP: 4010–4008
SL: 4002
TP: 4015 - 4020 - 4030 - 4040 - 4050 - ????
✅ BUY ZONE: 3984–3982
SL: 3978
TP: 3990 - 3995 - 4000 - 4005 - 4010 - 4020 - ????
✅ SELL ZONE: 4090–4092
SL: 4098
TP: 4085 - 4080 - 4070 - 4060 - 4050 - ????
⚠️ Risk Management Notes
The 4000 level remains a strong psychological and structural support — only enter long positions with confirmed price action signals.
Be cautious around 4090–4100, where liquidity sweeps and false breakouts are likely.
Adjust position size properly to manage volatility during high-impact news or geopolitical updates.
✅ Summary
Gold is undergoing a healthy correction phase within its broader uptrend.
The strategy remains BUY-focused at 4010–4008 and 3984–3982,
with upside targets toward 4060–4090,
and a potential short-term SELL opportunity near 4090–4092 if rejection signals appear.
💡 MMFLOW TRADING – Trade with market structure, follow liquidity, and ride the BIGWIN setups!
XAU/USD: Targeting $4,100! Where to Buy Before the FOMC Minutes?Hello TradingView community! 🚀
Gold (XAU/USD) continues to demonstrate incredible strength, consistently breaking past old highs and forming a solid upward price channel. This robust uptrend is not only technically reinforced but also awaits a potential catalyst from today's significant fundamental news.
In this analysis, we will combine two crucial perspectives: an in-depth look at the technical charts to identify optimal entry points, and an examination of the key fundamental event that could significantly impact Gold prices during the US session.
1. Fundamental Perspective: All Eyes on the FOMC Minutes
Today's market highlight, Wednesday, October 8, is the release of the FOMC Meeting Minutes at 2:00 PM ET
Why is this important? This document provides a detailed record of the latest policy meeting of the US Federal Reserve (FED) in September. Traders will scrutinise the text for any hints about the future interest rate path.
Potential scenarios:
"Dovish" Tone: If the minutes reveal FED officials' concerns about economic growth and the possibility of further rate cuts, the US Dollar might weaken. This would create a strong push for Gold (XAU/USD), potentially driving the next price surge.
"Hawkish" Tone: If the minutes emphasise that inflation remains a concern and the FED is not in a hurry to cut rates, the USD might see a short-term recovery, causing Gold to have a corrective dip.
This event is a top catalyst for volatility. Our strategy is to prepare technical zones to capitalise on the market's reaction.
2. Technical Analysis: Detailed Trading Plan
The bullish structure on the 2H timeframe is undeniable. Prices are creating a series of higher highs, confirmed by each "BoS" (Break of Structure), signalling that the Buyers are in full control. Here are the key zones to watch:
Potential Buy Zones (Key Points):
FVG Zone ($4,004): The nearest support is this Fair Value Gap, an area of price imbalance that the market often seeks to fill. Prices may retest this area before or during the news release.
"Buy Break BoS" Zone ($3,981): This is the nearest swing high that has been broken. Now it has turned from resistance into a crucial support level. This zone offers a solid entry point if prices correct slightly deeper.
"Bullish Order Block" Zone ($3,951): This is the last major "stronghold" of the Buyers—a powerful buy order block that initiated the latest push wave. This is an ideal area to look for buy orders if the market experiences a strong liquidity sweep downwards.
Upside Targets:
Short-term Target (Scalping): $4,070 - This level coincides with the 0.786 Fibonacci level.
Main Target: "Liquidity Sell" Zone at $4,103. This is a large "liquidity pool" where the Sellers' stop-loss orders are likely concentrated. Smart money often drives prices to such areas.
Strategy Summary
Main Trend: Bullish.
Core Strategy: Look for "Buy the dip" opportunities at the key support zones mentioned.
Critical Timing: Be cautious around the FOMC Minutes release (18:00 UTC). Volatility can be high, and the market may whip in both directions to sweep stop-losses before following the main trend.
Pro Tip: Patience is key. Waiting for prices to pull back to a confirmed support zone will provide a much better Risk/Reward ratio than chasing the market at the top.
WHAT'S YOUR VIEW?
How do you think Gold will react to today's FOMC minutes? And where are you looking to place your buy orders—at the FVG zone $4,004, the BoS level $3,981, or are you patiently waiting for the Order Block $3,951?
Share your views in the comments below!
👇 Don't forget to leave a Like 👍 and Follow the channel for the latest XAU/USD analysis updates!

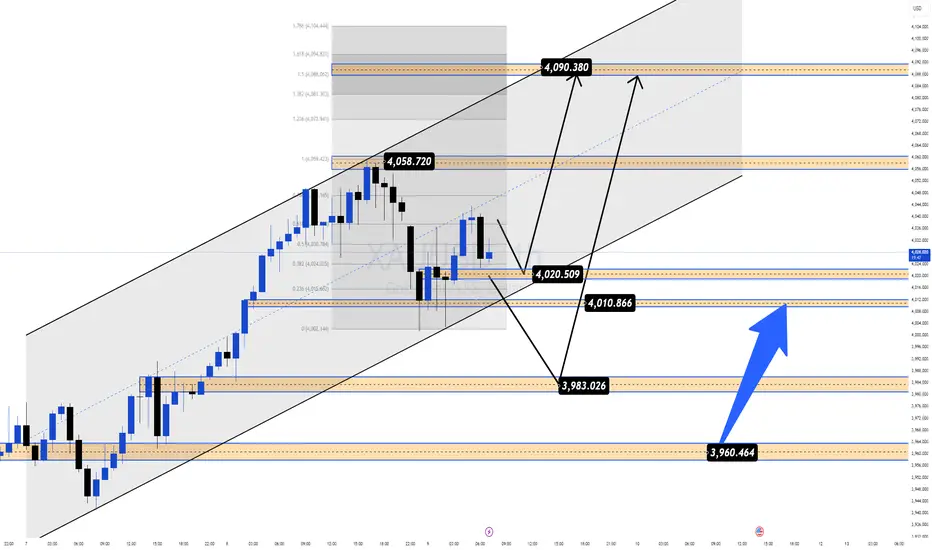
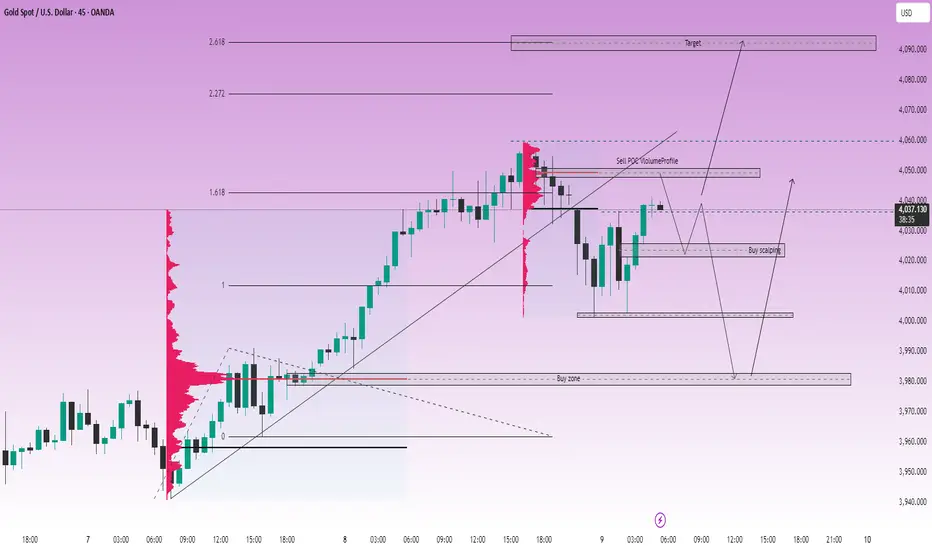
GOLD: Continuing Uptrend Structure, Target 4090 Approaching LiamTrading – GOLD: Continuing Uptrend Structure, Target 4090 Approaching
Hello everyone,
Gold and US stocks are setting new records together, but don't forget — strong sell-offs often appear when everyone believes prices can only rise.
Currently, gold maintains a sustainable uptrend structure, with each subsequent low higher than the previous one, confirming a clear trend on the H1–H4 timeframe.
📊 Technical Analysis (Chart 45m – XAUUSD)
The price structure remains a clear Higher High – Higher Low, indicating that buyers are still in control of the market.
Key liquidity zones are around:
🔹 4050–4060 (resistance – POC Volume Profile)
🔹 4020–4025 (temporary support zone – confluence of Fibo 0.618)
🔹 3980 (technical bottom, strong previous liquidity zone)
The upward target according to Fibonacci Extension is currently in the 4090 zone, corresponding to the 2.618 extension level — likely to become a major profit-taking area for buyers.
🎯 Today's Trading Scenarios
Short-term Sell (based on resistance reaction):
📍 4048–4050
🛑 SL: 4055
🎯 TP: 4030 – 4018 – 4005 – 3980
Buy scalping:
📍 4022–4024
🛑 SL: 4017
🎯 TP: 4030 – 4045 – 4060 – 4080
Buy swing (trend-following):
📍 3980–3982
🛑 SL: 3975
🎯 TP: 3995 – 4010 – 4025 – 4040 – 4060
🧭 Fundamental & Market Sentiment View
According to the FOMC minutes from 16–17/9, most Fed officials believe that continuing to cut interest rates this year is appropriate.
This is the first time since 2020 that the Fed has officially reduced the interest rate by 0.25%, bringing the range down to 4.75% – 5.00%.
→ Cheap money + safe-haven sentiment continue to be the main drivers pushing gold higher.
However, with gold and stocks both reaching peaks, the risk of technical corrections may occur when prices hit major liquidity zones.
📌 Conclusion
Gold is still in a stable uptrend, with a short-term target towards 4090 USD/oz.
However, watch the liquidity zones around 4050–4060 and 4000–4025 to optimize entry points, avoiding FOMO when prices are already in high zones.
👉 I will continue to update details for each trading session.
Follow me to not miss the earliest gold scenarios!
XAUUSD GOLD IS HEADING TOWARDS 7000$ Cycle started when gold is around 1450$ some years ago.
1st cycle - 1000$ to 2000$
2nd cycle - 2000$ to 3000$
3rd cycle - 3000$ to 4000$
4th cycle - 4000$ to 7000$
5th cycle - 7000$ to 12000$
Every impulse has corrective phase according to price theory. you will see minor & major correction , profit bookings between level's to level's. oppurtunity will arise always so don't be greedy. This analysis based on fundamental factor's. Technically it will correct after every impulses. This analysis based on daily timeframe and it is not suitable for day trader , intraday or scalper.
OANDA:XAUUSD

$4000: New Record! Correction Warning & FVG Strategy. Hello, traders!
Gold has officially set a New Record by breaching the $4,000/oz mark, hitting a peak of $4,014.60/oz. Kya baat hai! Although there was an immediate pullback after hitting this big psychological level, the rally is still getting solid support from:
Fundamentals & Market Conflict
Main Drivers: The market is pakka (sure) about two more Fed rate cuts this year (FOMC Minutes tonight are a big deal), coupled with central bank diversification and record ETF inflows ($64B) due to global gadbadi (instability) and inflation.
Reversal Warning: Bank of America (BoA), a big institution boss, is warning that Gold is facing "trend exhaustion," which could lead to a correction in Q4. Dhyan rakhna!
Technical Analysis & Clear Strategy Direction
The price got rejected straight at $4000, causing a small pullback. However, the overall trend is super strong. The safest strategy is to wait patiently for a BUY at specific support zones.
Priority Bias: BUY (Long) on Dips towards FVG (Fair Value Gap) zones to ride the main trend's momentum. Avoid unnecessary SELL attempts; if you must, use tight SL.
Key Price Levels:
Resistance: $4044, $4054, $4064
Support: $4018, $3999, $3986
Trading Strategy (Prioritize BUY on Dips)
BUY ZONE (FVG): $3994 - $3992
SL: $3984
TPs: $4002, $4012, $4022, $4032, $4042
SELL ZONE (High Risk): $4065 - $4067
SL: $4075
TPs: $4057, $4047, $4037, $4027, $4017
Do you trust BoA's warning, or do you think the FOMC Minutes will push us past $4050? Tell me your plan! 👇
#Gold #XAUUSD #4000USD #ATH #Fed #FOMC #TradingView #BUYDIPS #GoldFever

"Gold 'Buy the Dip' Opportunity Targeting the $4,000 Level"Technical Analysis
This is a classic bullish continuation setup. Here's a breakdown of the key elements:
Prevailing Trend: The chart shows a strong bullish impulse wave, indicated by the series of large green candles. This establishes the short-term trend as upward.
Corrective Pullback: After reaching a local high (around $3,980), the price is currently in a corrective phase, pulling back towards a potential support level. This is normal and healthy price action in an uptrend.
Support Zone: The red rectangle you've highlighted from approximately $3,950.00 to $3,956.00 is a well-defined area of potential support. This zone represents a previous level of consolidation and the base of the last major push upwards, making it a likely area for buyers to step back in.
Trade Idea: The projected path you have drawn suggests an expectation that the price will dip into this support zone, find buying pressure, and then continue its upward trajectory. This is often referred to as a "buy the dip" strategy.

GOLD M30 – Bulls Defend $4,000, Eyes on 4,100+Gold’s historic surge above the $4,000 psychological barrier is now consolidating, with buyers defending the 3996$ support (Fibo 0.618 reaction). The structure remains bullish, while intraday traders are eyeing the next reaction zones for both continuation and scalp opportunities.
📊 Technical Levels to Watch (Fibo Matrix – M30)
3996$ Support Zone: Breakout retest + Fibo 0.618 → must-hold for bulls.
4018 – 4020: First intraday resistance, potential short-term reaction.
4043$: Expansion-based psychological barrier.
406x – 407x: Key SELL Reaction Zone (Fibo 1.5 – 1.618) → scalp rejection likely.
4095$+: Upper liquidity expansion, next major target if momentum extends.
🎯 Francis Trade Plan
✅ BUY Setup:
Entry: 3996 – 4000 zone.
Targets: 4018 → 4043 → 406x.
SL: Below 3984.
⚠️ SELL Setup (Short-term scalp only):
Entry: 406x – 407x reaction.
Targets: 4020 → 4000.
SL: Above 4096.
🔑 Francis View
The breakout at $4,000 signals strength, and bulls still dominate.
👉 Dips into 3996 support remain attractive BUY opportunities.
👉 Short-term scalpers can prepare for reaction SELLs around 406x – 407x.
📌 Bias: Bullish above $3996 – 4,100 zone remains the next liquidity magnet.

XAUUSD – PRICE ABOVE $4000: ABSOLUTELY CRAZY FOR TRADERSXAUUSD – PRICE ABOVE $4000: ABSOLUTELY CRAZY FOR TRADERS
Gold has officially surpassed the $4000 mark, marking one of the most robust increases in recent history.
Let's take a look at the key price zones and short-term opportunities 👇
🔻 SELL Scenario
SELL 4025–4027 → SL 4033 → TP 4015 – 4000 – 3980
SELL 4042–4044 → SL 4049 → TP 4030 – 4015 – 4000 – 3980
🟩 BUY Scenario
BUY 3993–3995 → SL 3988 → TP 4005 – 4013 – 4023 – 4040
BUY 3980–3983 → SL 3975 → TP 3998 – 4005 – 4013 – 4023 – 4040
📈 Technical Analysis
The medium-term upward price channel continues to be stable.
Rising lows indicate that buying pressure remains very strong.
The nearest psychological resistance is around the 4043 zone, coinciding with the Fibonacci extension.
The expected buying zone is at the POC Volume Profile area — a high liquidity zone, once anticipated by many traders to reject gold prices, but now could become a strong demand zone.
🧭 Macroeconomic Perspective
If the Federal Reserve (Fed) continues to cut interest rates, the market may aim for the next milestone – 5000 USD/ounce.
Although short-term fluctuations may occur (such as temporary ceasefires in the Middle East or Ukraine), the core drivers of this trend remain unchanged:
US public debt is increasing
Central banks are diversifying foreign reserves
The USD is weakening
All of which support gold's medium-term upward trend.
⚡️Summary
Gold remains in a solid upward structure, even as it approaches overbought territory.
There might be strong corrections, but as long as the upward structure is maintained, buyers remain in control.

GOLD XAU/USD – Intraday Plan | Bulls Targeting 4,000$Gold has once again proven its safe-haven dominance, pushing close to 3,980$ during the Asian session. Despite USD fluctuations and global market risk-on vibes, buyers remain firmly in control. The psychological milestone of 4,000$ is now directly in focus.
🔎 Technical Snapshot (M30)
Trend remains bullish, supported by the Fibo channel.
Dip-buying pressure continues to dominate intraday price action.
Sellers will only gain short-term control near the 3988 – 4000$ resistance zone.
🔑 Key Trading Levels
BUY Zone (Fibo 0.618): 395x → Ideal intraday demand.
Support Zone: 393x → Must hold for bullish structure.
Immediate Resistance: 397x → Current ATH zone.
SELL Reaction Zone: 3988 – 4000$ → Potential short scalp.
Major Resistance: 4000 – 4006$ → Strong psychological wall.
📌 Trading Plan (FranCi$$ Style)
✅ BUY on Dips
Entry: 395x – 393x
Targets: 3975 → 3988 → 4000$
Stop Loss: Below 392x
⚡ SELL Scalp
Entry: 3988 – 4000$
Targets: 3970 → 3950$
Stop Loss: Above 4015$
🎯 Final Take
Gold’s path remains upward, but the 4000$ barrier is where bulls meet the biggest challenge. Smart traders will look to buy dips for continuation and use scalp sells only at strong rejection zones.
🔥 Stay tuned with FranCi$$ for realtime intraday updates – precision signals, scalping setups, and golden opportunities!

Gold Near ₹4000, BofA Warns of Mid-Cycle Adjustment 📊 Market Context
Gold prices are inching closer to the ₹4,000/oz mark, but a fresh warning from Bank of America has made the market cautious. Strategist Paul Ciana notes that gold is over 20% above the MA200 – a level seen before sharp corrections in historical peak cycles (2008, 2011, 2020, 2022).
However, medium-term forecasts from Goldman Sachs, UBS, and even BofA still suggest that gold could reach ₹4200–₹4900/oz next year. This means the long-term upward trend is still intact – but the current phase is prone to unexpected corrections to shake off FOMO buying pressure.
🔎 Technical Analysis (H1/H4)
Prices are fluctuating near the ATH Zone and the crucial liquidity area around ₹3990–₹4000.
Buy Zones: ₹3935–₹3933 (CP zone & FVG reaction) offer an opportunity to accumulate orders.
Sell Zone: ₹3993–₹3995 (Liquidity Zone) – a liquidity trap is likely when prices approach the ₹4000 mark.
🔑 Key Levels
BUY Zones: ₹3935–₹3933, main support at ₹3910.
SELL Zone: ₹3993–₹3995, closely watch liquidity.
Psychological resistance: ₹4000.
📈 Scenario & Trading Plan
✅ BUY ZONE 1: ₹3935–₹3933
SL: ₹3927
TP: ₹3940 - ₹3945 - ₹3950 - ₹3960 - ₹3970 - ₹3980 - ???
✅ SELL ZONE: ₹3993–₹3995
SL: ₹4000
TP: ₹3988 - ₹3984 - ₹3980 - ₹3970 - ₹3960 - ???
⚠️ Risk Management Notes
The ₹3990–₹4000 area is extremely liquid – a peak sweep is likely before reversal.
Only enter trades with clear price action confirmation, avoid FOMO as prices near the psychological mark.
Adjust volume sensibly as volatility may be higher than usual with the market debating the risk of a “mid-cycle correction”.

Gold at $397x: Record High Reveals Double Top Pattern!Hello, traders!
Gold just hit a New Record High at $3,976.3/oz. However, immediately after, the market witnessed a clear structure break and the formation of a Double Top pattern in the European session. This strongly signals a shift in strategic priority.
Fundamentals & Bias Reversal
Core Drivers: Gold is up 50% YTD due to persistent Fed rate cut expectations (two more cuts projected) and severe global political instability (US Shutdown, France crisis, rising Japanese yields).
Technical Bias: We are now prioritizing SELL due to the confirmed Double Top and structure breakdown. Only consider BUYs at deeper support zones with controlled risk.
Key Price Levels:
Resistance: $3953, $3975, $3984, $4004
Support: $3942, $3931, $3910, $3899
Trading Strategy (Prioritize SELL):
SELL SCALP: $3957 - $3959
SL: $3963
TPs: $3953, $3948, $3943, $3938, $3933
SELL ZONE: $3975 - $3977
SL: $3985
TPs: $3967, $3957, $3947, $3937, $3927
BUY ZONE 1 (Wait): $3931 - $3929
SL: $3921
TPs: $3939, $3949, $3959, $3969, $3979
BUY ZONE 2 (Deeper): $3899 - $3897
SL: $3889
TPs: $3907, $3917, $3927, $3937, $3947
Will the Double Top send Gold back toward $3900? Let me know your thoughts! 👇
#Gold #XAUUSD #ATH #TechnicalAnalysis #DoubleTop #SELL #Fed #TradingView
viết bằng ngôn ngữ tiếng anh ấn độ phù hợp với nền tảng tradingview
Gold at $397x: Record High Reveals Double Top Pattern! Time to SELL? 🔥📉
Hello, traders!
Gold just hit a New Record High at $3,976.3/oz—paisa hi paisa! But hold your horses, boss. Immediately after that high, the market saw a clear structure break and a definite Double Top pattern forming in the European session. This is a big signal, suggesting a shift in strategic priority.
Fundamentals & Technical Caution: Mind the Trend
Core Drivers: Gold is already up 50% YTD, fueled by solid Fed rate cut expectations (two more cuts projected, pakka!). Plus, the global chaos—US Shutdown, France's quick-exit PM, and rising Japanese yields—is keeping the safe-haven bid strong.
Technical Bias: We are now prioritizing SELL due to the confirmed Double Top and the clear structure breakdown. Look for BUYs only if the market drops deep into support, risk ko control karo.
Key Price Levels:
Resistance: $3953, $3975, $3984, $4004
Support: $3942, $3931, $3910, $3899
Trading Strategy (Prioritize SELL):
SELL SCALP: $3957 - $3959
SL: $3963
TPs: $3953, $3948, $3943, $3938, $3933
SELL ZONE: $3975 - $3977
SL: $3985
TPs: $3967, $3957, $3947, $3937, $3927
BUY ZONE 1 (Wait): $3931 - $3929
SL: $3921
TPs: $3939, $3949, $3959, $3969, $3979
BUY ZONE 2 (Deeper): $3899 - $3897
SL: $3889
TPs: $3907, $3917, $3927, $3937, $3947
Will this Double Top be the beginning of a correction, or is $4000 still in the cards? Tell me your move! 👇
#Gold #XAUUSD #ATH #TechnicalAnalysis #DoubleTop #SELL #Fed #TradingView #MarketAnalysis

Sustainable Price Rise: Where’s the Next Optimal Entry?Hello TradingView community! 🚀
Gold (XAU/USD) is in an extremely sustainable upward structure. Instead of lengthy analysis, let's dive straight into the action plan: What is the optimal entry point and what target is Gold aiming for? Check out the details below.
1. Market Structure Analysis: The Strength of the Bulls 🐂
Looking at the chart, the first thing that catches our eye is a series of "BoS" (Break of Structure).
Every time Gold breaks an old peak, it not only creates a Higher High but also confirms that the upward trend is very strong and sustainable. This indicates that buying power is completely overwhelming and shows no sign of weakening. Smart Money is continuously pushing the price higher, and our job is to ride this "wave."
2. Potential Buying Zones - Where to Catch the Wave? 🧐
To optimize profits and minimize risks, finding a beautiful entry point after a price correction is extremely important. Based on the chart, we have 2 noteworthy potential buying zones:
Buying Zone 1 - Fibonacci Confluence ($3885): This is an extremely ideal "Buy Zone," coinciding with the golden Fibonacci ratio of 0.618. In technical analysis, this is a very strong support level, where prices often tend to reverse and continue the main trend. Professional traders always hunt for pullbacks to this zone.
Buying Zone 2 - Exploiting FVG ($3914 - $3933): Slightly higher, we have the FVG (Fair Value Gap) area at $3914 and the "Buy Scalping" zone at $3933. These are "price gaps" created by supply-demand imbalances when prices rise too quickly. The market tends to return to fill these gaps before continuing its journey. This could be an opportunity for those wanting to catch an earlier wave.
3. Target Conquest - What’s Gold’s Next Destination? 🎯
Once we have a buying position, where will our target be?
Short-term target: The "Sell Scalping FVG" zone around $3969 could be a minor resistance point where some traders will take profits.
Main target: The ultimate destination this structure is aiming for is the "Sell Gold Liquidity" zone at $3998. This is an important "liquidity" area, concentrating many stop-loss orders of the Sellers. Prices are often attracted to these zones like a "magnet" to sweep liquidity before making further moves.
Summary & Advice
Main trend: UP.
Primary strategy: Buy on dip when prices correct to important support zones.
Potential buying zones: $3885 (Fibonacci) and $3914 - $3933 (FVG).
Price targets: $3969 (short-term) and $3998 (main target).
Always remember, risk management is the key to surviving in the market. Set reasonable Stop-loss for all your trades.
WHAT DO YOU THINK ABOUT THIS PLAN?
Will Gold retrace to the Fibonacci zone $3885 or react right at the FVG zone $3914? Leave your opinions and perspectives in the comments below. We will discuss together to find the best opportunities!
👇 Don't forget to Like 👍 and Follow my TradingView channel to not miss daily Gold analyses!

“Gold Price Action: Bullish Momentum with Key Correction ZonesAnalysis of XAU/USD (Gold Spot)
The chart shows a clear uptrend channel, supported by higher highs and higher lows.
Price recently pulled back after testing the $3,915 zone, which is acting as a short-term resistance.
Multiple support zones are highlighted (around $3,760 and $3,700), which can provide strong buying opportunities on retracement.
The structure suggests impulse–correction–impulse movement, aligning with bullish continuation patterns.
Bullish Scenario
If price holds above the $3,760–$3,780 support, continuation towards $3,915 (previous high) is expected.
A breakout above $3,915–$3,920 will open the door for further upside, targeting $3,960–$3,980.
Bearish Scenario
If price breaks below the trendline support (~$3,760), deeper correction is possible toward $3,680–$3,640 (TP1 zone).
That zone is mentioned on the chart as a strong re-entry point for long positions.
✅ Suitable Target (Bullish):
Immediate Target: $3,915 (previous high)
Extended Target: $3,960 – $3,980
⚠️ Correction Target (Bearish Pullback):
$3,680 – $3,640 (strong buy zone for re-entry)

Gold Breaks $3900: Safe-Haven Demand Soars & Fed Fuels the Rally📊 Market Context
Gold continues to assert its strength by breaking the psychological barrier of $3,900, becoming the central asset amidst financial and political turmoil.
US government shutdown → defensive capital flows strongly into gold.
Fed expected to cut interest rates by another 0.25 points → further strengthens the advantage for the non-yielding precious metal.
Lack of economic data → investors closely follow private reports, adding uncertainty and supporting gold's role as the “number 1 safe haven”.
👉 Market sentiment is perfectly aligned: USD under pressure, capital moving away from risky assets, BUY side FOMO continues to amplify → gold stands before the opportunity to climb and conquer the 3950–3990 range.
🔎 Technical Analysis (H1/H4)
Main trend: Strong uptrend, price holding above the rising trendline.
BUY ZONE 1: 3904–3902 → Volume CP Zone, supports momentum.
BUY ZONE 2: 3885–3883 → Retest old ATH, accumulation zone for the next rally.
SELL Zone: 3949–3950 → Liquidity Zone, prone to liquidity traps.
Extended target: 3994 (Fib 3.618).
🔑 Key Levels
BUY Zones: 3904–3902, 3885–3883
SELL Zone: 3949–3950
Resistance: 3950, 3994
Support: 3900, 3880
📈 Scenario & Trading Plan
✅ BUY ZONE 1: 3904–3902
SL: 3898
TP: 3910 - 3915 - 3925 - 3935 - 3945 - ???
✅ BUY ZONE 2: 3885–3883
SL: 3878
TP: 3895 - 3905 - 3920 - 3935 - 3945 - ???
⚠️ SELL ZONE (scalp/trap): 3949–3950
SL: 3955
TP: 3940 - 3935 - 3925 - ???
⚠️ Risk Management Notes
Liquidity may sweep above 3950 before adjusting → need to wait for price action confirmation.
Avoid FOMO at the peak, prioritize BUY only when price adjusts to support zones.
Order volume should be slightly reduced before unexpected Fed policy announcements.
✅ Summary
Gold is in the “golden phase” of an uptrend: political instability + dovish Fed + safe haven demand = BUY is the main strategy. Plan to accumulate around 3904–3902 and 3885–3883, with an extended target of 3950–3990. SELL is only a short-term strategy at the liquidity zone.
📢 Follow MMFLOW TRADING for real-time updates & BIGWIN setups with the team!

Gold Hits $394x! New ATH: Fed & BoJ Drive the Rally.Hello, traders!
Gold (XAU/USD) has just delivered a massive breakthrough in the Asian session, setting a New ATH around $394x after comfortably breaching that $3900 level. This strength, bhai, is getting serious support from two big monetary policy moves: Fed rate cut expectations and the likelihood of the BoJ (Bank of Japan) delaying rate hikes due to the new PM. Paisa hi paisa!
Fundamentals & Technical Caution: Mind the FOMO
Dual Drivers: Market sentiment is clear—the Fed is expected to cut rates two more times, and the dovish BoJ outlook only adds more fuel, creating a rock-solid foundation for Gold.
Safe-Haven: The continuous US Shutdown drama and geopolitical tensions are keeping that safe-haven bid strong.
FOMO Warning: The momentum is fierce, but you must avoid buying the high. Prioritize Buying on pullbacks to FVG (Fair Value Gaps) to secure a safer entry point. Discipline is key, boss.
Key Price Levels:
Resistance: $3954, $3963
Support: $3910, $3895, $3883, $3870
Trading Strategy (Absolute Risk Management):
BUY SCALP: $3910 - $3908
SL: $3904
TPs: $3918, $3928, $3938, $3948, $3958
BUY ZONE (FVG): $3895 - $3893
SL: $3885
TPs: $3903, $3913, $3923, $3933, $3943
SELL ZONE (High Risk): $3964 - $3966
SL: $3974
TPs: $3956, $3946, $3936, $3926, $3916
Are you placing your bets on a $4000 target this week? Let me know your plan! 👇
#Gold #XAUUSD #ATH #Fed #BoJ #Shutdown #TradingView #MarketAnalysis #GoldFever

Gold Soars on FOMO – 1000-Pip Opportunity Ahead!GOLD PLAN FOR 06.10 | Captain Vincent
✳️ Hello to all traders,
Today, we are not only analysing Gold (XAU/USD) from a purely technical perspective ⚙️, but also witnessing the perfect confluence between technicals and fundamental news. A bullish storm is forming, promising attractive trading opportunities.
📊 1. Technical Analysis: Sustainable Bullish Structure
From a technical standpoint, the uptrend of Gold on the H1 chart is undeniable.
🔹 Break of Structure (BoS):
Gold continuously breaks previous highs, indicating that buying pressure is completely dominant.
Each BoS point is a clear affirmation of the strength of the uptrend.
🔹 Potential Demand Zone:
After each rally, the price often takes a “pause” to accumulate.
Currently, the price may adjust to the $3,883,020 - $3,911,169 zone, where the confluence between Fair Value Gap (FVG) and Bullish Order Block (Bullish OB) – creates an ideal launchpad for the next rally.
🏦 2. Fundamental Analysis: The Fire Has Been Lit
If technicals show the way, then fundamental news is the fuel driving the uptrend.
🔸 US Government Shutdown:
This event creates political and economic instability, causing capital to flee from risky assets.
Gold – the number one safe haven – is directly benefiting as investors seek to preserve their assets.
🔸 Fed Ready to Cut Interest Rates:
The market is almost certain that the Fed will cut interest rates by 0.25%.
This reduces the appeal of the USD, further strengthening Gold's advantage, which is a non-yielding asset.
🔸 “Thirst” for Economic Data:
The government shutdown also disrupts the release of important economic data, leaving the market lacking information and increasing uncertainty.
In this environment, Gold continues to hold its safe haven role.
🎯 3. Comprehensive Trading Plan
When technicals and fundamentals align, the reliability of the trading strategy is significantly enhanced.
Strategy:
Wait to buy (Long) when the price adjusts to the demand zone $3,883,020 - $3,905,169.
Entry signals:
Observe confirmation of a bullish reversal in this zone such as:
Pin bar candles, engulfing
Or BoS on the M15 chart
Targets:
Short-term: $3950 – $3990
Long-term: Target “+1000 pips”
Risk management:
Place Stop Loss below the Bullish OB to protect the account.
🧭 Conclusion
The current market sentiment is very favourable for the Buyers:
USD is under downward pressure
Defensive capital flows are strongly moving into Gold
The FOMO effect can stimulate an extended rally
The combination of a solid technical structure and strong fundamental support is creating an almost perfect bullish picture.
👉 Be patient, stick to the plan, and await this golden opportunity.
💼 Wishing everyone an effective and victorious trading day!

New ATH: Shutdown Fuels Gold's Seventh Straight WinHello, traders!
Gold just sealed its seventh consecutive weekly gain, boss, with futures hitting a whopping $3,908.9/oz. This rally is powered by growing tension over the US Government Shutdown and the solid expectation of a Fed rate cut (97% chance in October, no less!).
Fundamentals & Outlook: Pure Safe-Haven Rally
Political Instability: The prolonged Shutdown is a proper bullish driver now. It's delaying key economic reports, creating huge uncertainty, and attracting big safe-haven capital flows.
Rate Cut Certainty: The market is absolutely banking on a Fed rate cut, giving massive support to non-yielding Gold.
Technicals & Trading Strategy: Focus on $3867
The weekly buying power is super strong. Gold is holding steady near the $3900 mark. The $3867 level is our critical line, bhai; if the price stays above it, the potential for new ATHs remains very high.
Key Price Levels:
Resistance: $3902, $3912, $3922, $3942
Support: $3867, $3855, $3839, $3792
Trading Strategy (Absolute Risk Management):
BUY ZONE 1: $3867 - $3865
SL: $3857
TPs: $3875, $3885, $3895, $3905, $3915
BUY ZONE 2: $3839 - $3827
SL: $3824
TPs: $3847, $3857, $3867, $3877, $3887
SELL ZONE 1: $3902 - $3904
SL: $3912
TPs: $3894, $3884, $3874, $3864
SELL ZONE 2: $3942 - $3944
SL: $3952
TPs: $3934, $3924, $3914, $3904
What's your view? Will the US political drama help Gold finally break past $3900 next week? Tell me below! 👇
#Gold #XAUUSD #ATH #Shutdown #Fed #TradingView #MarketAnalysis #GoldRush

XAUUSD/Gold Weekly Buy Projection (05.10.25) chartXAUUSD/Gold Weekly Buy Projection (05.10.25) chart.
Here’s a clear technical summary of what your chart shows:
🔹 Overall Structure
The chart projects a bullish move for XAUUSD (Gold).
Title: Weekly Buy Projection – 05 Oct 2025
Main trend: Ascending continuation pattern (marked by blue upward trendlines).
Current price zone: around $3,886.45.
🔹 Key Levels
Support S2: around $3,838 – $3,846
Support S1: around $3,870 – $3,878
Resistance 1: around $3,900 – $3,910
Resistance 2 (New ATH): around $3,939 – $3,970
🔹 Pattern & Projections
Golden Ratio (0.618 Fibonacci) formed near $3,874, signaling a retracement support.
Bullish engulfing candle noted at Support S1, confirming buying interest.
Possible Double Top highlighted near Resistance 1, indicating a short-term pullback risk before continuation.
Fair Value Gap (FVG) exists between $3,875–$3,890, suggesting potential liquidity refill before next le

XAU/USD Near Record Highs: Key Data AheadGold (XAU/USD) Technical Outlook – October 3, 2025
1. Macro & News Context
Gold is holding near record highs, heading for its seventh consecutive weekly gain, supported by expectations that the Federal Reserve will continue cutting rates and by concerns around the ongoing U.S. government shutdown. Spot prices have recently tested the ₹3,890–3,900 region and are now consolidating around ₹3,860.
Nonfarm Payrolls (NFP) – Typically scheduled for 18:00 IST on the first Friday of the month, the September jobs report is likely to be delayed due to the U.S. government shutdown.
Key event to watch today:
ISM Services PMI (September) will be released at 19:30 IST. Since ISM data is privately produced, it will be published regardless of the shutdown and may serve as the main volatility catalyst in today’s U.S. session. 【ISM】
Labor market signals: Challenger job cut data showed lower layoffs in September, but planned hiring at the lowest level since 2009, reinforcing a softer employment backdrop. Combined with the Fed’s recent 25 bps rate cut (to 4.00%–4.25%), this continues to support the bullish gold narrative.
USD trend: The dollar has weakened broadly this week, aligning with market bets on further monetary easing. This backdrop provides an additional tailwind for gold.
2. Technical Landscape (H1 Chart)
The attached chart highlights key technical zones and a completed Harmonic XABCD pattern on the 1H timeframe:
Support levels:
Near-term: ₹3,844–3,841
Deeper: ₹3,827 (intraday pivot), ₹3,792 (strong low)
Strategic: ₹3,764–3,770 (Bullish Order Block)
Resistance levels:
Immediate: ₹3,865
Strong supply: ₹3,880–3,890 (Bearish Order Block)
Extended target: ₹3,930–3,940 (Sell Scalping | Fibo zone)
Momentum: After bouncing from point D of the harmonic structure, gold has been forming higher lows (HL). Price currently sits above the longer-term moving average and is testing the shorter-term average, suggesting a constructive short-term bias as long as supports hold.
3. Trade Scenarios
Scenario 1 – Buy-the-dip (preferred bias)
Entry zone: ₹3,844–3,841
Stop loss: Below ₹3,827 (safer: below ₹3,792)
Targets:
₹3,865 (first take-profit)
₹3,880–3,890 (major supply)
Stretch: ₹3,930–3,940
Rationale: Higher low formation, bullish macro backdrop, aligned with strong weekly uptrend.
Scenario 2 – Countertrend short at resistance
Trigger zone: ₹3,880–3,890 (Bearish OB)
Confirmation: Rejection candles (H15–H1) such as wicks, engulfing, or failed breakout.
Stop loss: Above ₹3,895–3,900 (or above ₹3,945 if price spikes into the ₹3,930–3,940 fib zone).
Targets: ₹3,865 → ₹3,844 → ₹3,827
Rationale: Potential liquidity sweep ahead of ISM, with profit-taking likely near supply zones.
Scenario 3 – Breakdown through support
Trigger: 1H close below ₹3,841
Path: ₹3,827 → ₹3,792 (Strong Low) → ₹3,764–3,770 (Bullish OB)
Rationale: Loss of intraday structure would flip bias short until major demand zones.
4. How to Trade Around Today’s Data
If NFP is indeed delayed, the 18:00 IST slot may bring limited volatility.
Focus instead on the ISM Services PMI at 19:30 IST, which could trigger sharp swings in both USD and gold.
Adjust position sizing: Expect spread widening and slippage around the release. Reduce leverage or scale into positions.
5. Risk Management
Limit risk per trade to 0.5–1% of account equity.
Avoid chasing price once levels are tested; wait for H15–H1 candle closes for confirmation.
Monitor the U.S. Dollar Index (DXY) and Treasury yields – further dollar weakness would reinforce bullish gold setups.
🔑 Key Takeaway
Gold remains structurally bullish in the broader trend, with immediate support at ₹3,841–3,844 critical to maintain upside momentum. Watch for reactions around ₹3,880–3,890 and ₹3,930–3,940. With NFP possibly delayed, the ISM Services PMI at 19:30 IST will be today’s most important catalyst for directional moves.

Gold Correction: Fed Warning vs. Massive Safe-Haven Flows Hello, traders!
Gold pulled back to $3,845.78/oz after Dallas Fed President Lorie Logan called for caution regarding further rate cuts.
Fundamentals: Fed Warns, But the Buying Wave is Unstoppable
The market stands at a crossroads:
Downward Pressure: The caution signal from Fed's Logan.
Upward Momentum: Government shutdown (increases instability, delays jobs report), weak private sector jobs data (down 32k), and SPDR Gold Trust ETF holdings rising to the highest level since 2022.
Conclusion: Political instability and weak economic data continue to reinforce the likelihood of a Fed rate cut. Massive safe-haven capital is flowing into Gold.
Technical Analysis & Strategy
Gold retreated to the FIBO 0.618 - 0.5 zone, indicating a healthy technical correction after the sharp rally. Priority remains Buy if the price holds above $3861. Be cautious of Stop Loss hunting.
Resistance: $3870, $3884, $3894
Support: $3855, $3833, $3798
Trading Strategy (Tight SL):
BUY SCALP: $3838 - $3836 / SL: $3832 / TP: $3846 - $3857
BUY ZONE: $3798 - $3796 / SL: $3788 / TP: $3816 - $3836
SELL ZONE: $3888 - $3890 / SL: $3898 / TP: $3870 - $3850
Do you think the Fed's warning is strong enough to reverse this trend? 👇
#Gold #XAUUSD #Fed #GovernmentShutdown #TradingView #PhânTíchVàng #ETF

(XAU/USD) – Gold likely to touch $4,000/oz: Ideal buying levels?1. Market Structure & Trend Outlook
On the H1 chart, gold is sustaining its bullish structure with higher highs and higher lows.
After the BoS (Break of Structure), price retraced near 3,862 Buy Zone and bounced upward.
At present, price trades above EMA34 and EMA89, keeping bullish bias intact.
2. Important Levels
Buy Zone: 3,862 – 3,865. Acts as short-term support. Holding above strengthens the bullish case.
OB1: 3,806 – 3,810. Next support in case Buy Zone breaks.
OB2: 3,763 – 3,770. Deeper support, triggered only if market corrects heavily.
Sell Scalping Zone (Fibo): 3,912. A short-term resistance, profit booking expected.
Sell Zone / ATH: 3,933 – 3,935. Breakout here may lead to fresh record highs.
3. Trade Setups
Bullish Setup: Buy on retest of 3,862 – 3,865.
SL: Below 3,850.
TP1: 3,912.
TP2: 3,933 – 3,935.
Bearish Setup (Defensive): If below 3,860, expect test of 3,806 – 3,810.
If this fails, price may decline towards 3,763 – 3,770.
4. Conclusion
Trend remains positive on H1. Best strategy: Buy on dips near support, manage SLs carefully, and book partial profits near resistances. Sustaining above 3,933 may open doors for new highs.
