XAUUSD/GOLD WEEKLY SELL PROJECTION 08.02.26XAUUSD Weekly Sell Projection – 08.02.26
This is the XAUUSD weekly chart, and this analysis is based on 08 February 2026.
Gold is currently trading near a major resistance zone, where strong selling pressure was seen earlier.
After a sharp rejection from the R2 resistance area, price dropped aggressively, indicating institutional selling activity.
Now, price has retraced back into the 0.618 Fibonacci retracement level, which also aligns with a previous resistance zone.
In this area, we are expecting a Double Top pattern formation, which is a strong bearish reversal signal on the weekly timeframe.
This highlighted zone is marked as a strong selling zone.
As long as price stays below this level, the sell bias remains intact.
The upper trendline is acting as dynamic resistance, and price is reacting close to that trendline.
🔴 Stop Loss:
If price breaks and closes above 5,351, this sell setup will be invalidated.
🎯 Target Levels:
First target near 4,964
Second target around 4,700
Final target near 4,404, which is a strong weekly support area
Price is expected to move with pullbacks and continuations, not in a straight line.
Xauusdwave

XAUUSD / GOLD – 1H SELL PROJECTION (05-02-2026)
Gold was moving inside a rising channel, respecting the uptrend line.
However, price failed to sustain bullish momentum and clearly broke the uptrend, indicating a market structure shift.
After the breakdown:
Price retraced back into a Fair Value Gap (FVG)
The retracement got rejected near Resistance (R1)
A Three Black Crows candlestick pattern formed, confirming strong bearish pressure
This rejection from the FVG zone after an uptrend break signals a high-probability sell continuation setup.
🔍 Confluences Used
Broken uptrend line
Fair Value Gap (Sell zone)
Resistance rejection
Three Black Crows pattern
Bearish market structure
🎯 Trade Expectation
Sell from FVG zone
Stop Loss: Above recent high
Targets:
TP1: Previous support
TP2: Lower liquidity / Support S3

XAUUSD/GOLD WEEKLY SELL PROJECTION 01.02.26“This is the weekly sell projection for Gold, XAUUSD.
Price has reached a major resistance zone and shows clear selling momentum.
An evening star pattern is formed at the top, which indicates a potential trend reversal.
The market has broken the previous support and is now retesting the broken zone.
This area also aligns with the 50% Fibonacci retracement, making it a strong sell zone.
As long as price stays below this resistance, the bearish bias remains valid.
Downside targets are the next support levels, Support S1 and Support S2.
Risk management is very important.
Always use proper stop loss and trade with confirmation.
This is a technical analysis, not financial advice.
Trade smart, stay disciplined, and protect your capital.”

XAUUSD/GOLD CORRECTION BUY PROJECTION 29.01.26XAUUSD / Gold – Correction Buy Setup (29-01-2026)
Market View:
Gold is in a strong bullish trend. The current move is a normal correction, not a trend reversal.
Buy Zone:
Support S2 + Fair Value Gap (FVG)
0.618 Fibonacci Golden Ratio
Area around 5396 – 5400
Trade Plan:
Look for buy confirmation in the marked support zone.
Expect price to respect the uptrend line and move higher.
Targets:
First target: Resistance R1
Main target: 5600+
Stop Loss:
Below Support S2 / below recent structure low.

XAUUSD/GOLD 1H BUY LIMIT PROJECTION 22.01.26Today I’m sharing a HIGH PROBABILITY XAUUSD 1H Buy Limit Projection 📈
✅ Demand Zone Entry
✅ 0.618 Golden Fibo Confirmation
✅ Liquidity Collection Area Support
✅ Breakout confirmation & upside projection
🎯 Targets: R1 ➝ R2
🛑 SL: Below Stoploss Zone

XAUUSD/GOLD WEEKLY BUY PROJECTION 21.01.26Resistance R1: 4826.190
✅ Target Price 1: Around 4900 zone
✅ Target Price 2: Around 5000 zone
✅ Long-Term Resistance Target: 2.618 Fibonacci = 4996.920
🟩 Best Buy / Entry Zone
📍 Broken trendline + Resistance retest area
If price pulls back into this zone,
fills the Fair Value Gap (FVG),
and gives a strong bullish confirmation candle,
✅ then it becomes a high-probability buy entry.
🟥 Stoploss Area
📍 Stoploss should be placed below the Fair Value Gap / retest zone
Safer stoploss: below the last swing low.

XAUUSD/GOLD 15MIN BUY PROJECTION 20.01.26Market Structure
Bullish continuation pattern formed
Clear BOS (Break of Structure) confirming buyers strength
Support Zones
Day Opening acting as Support
Day Low Support (S2) – strong demand base
Resistance
Yesterday High acting as Resistance
Price is trying to break & hold above this level
Entry Plan
✅ Entry only AFTER RETEST
Wait for price to retest the breakout zone
Confirm with bullish candle / rejection wick
Targets
🎯 Target Zone: Top green box area
Expect price to push higher towards target price zone
Stoploss
🛑 Stoploss Zone: Red box
Below retest support area / below structure low
🎙️ NARRATION (For YouTube / Telegram)
“XAUUSD Gold 15-minute chart shows a strong bullish continuation setup.
We got a clear break of structure, confirming buyers are in control.
Day opening is acting as support and day low support zone is holding strongly.
Right now price is approaching yesterday’s high resistance, so the best plan is to take entry only after a clean retest of the breakout zone.
Once the retest confirms with bullish rejection, we can expect price to continue upside towards the target zone.
Stoploss will remain below the retest support to protect the trade.”
If you want, I will also make this into short 15-sec voice style script for YouTube Shorts 🎬

XAUUSD/GOLD 30MIN SELL PROJECTION 12.01.26Chart reading (simple)
Supply zone la price reject aagudhu → sell bias
Current price ~ 4574 (chart right side)
Resistance line near 4583–4584 area
Swing low target near 4546
✅ Best Next Move (30M Plan)
🔥 Sell Entry Zone
➡️ 4573 – 4576 (Entry zone chart-la mark panniruka range)
🛡 Stoploss (safe SL)
➡️ 4586 – 4588 (Supply/Stoploss zone top)
🎯 Targets
TP1: 4565 (support zone touch)
TP2: 4555
Final TP: 4546 (Swing Low) ✅

XAUUSD/GOLD WEEKLY SELL PROJECTION 04.01.26Price was moving inside a parallel uptrend channel
That channel is clearly broken, which is the first early warning of trend weakness
After the break, price failed to continue higher → bullish momentum exhausted
2️⃣ Major Reversal Patterns
Double Top Formation
Price tested the same resistance zone twice
Both tops were rejected strongly
This confirms buyers are unable to push price higher
M Pattern Confirmation
After the second top, price breaks below the neckline
This confirms trend reversal
3️⃣ Candlestick Confirmation (Very Strong)
At the resistance zone:
Evening Star (Triple Candlestick Pattern) → Classic reversal signal
Bearish Engulfing Candle → Sellers completely overpower buyers
These patterns together give a high-probability SELL confirmation
4️⃣ Resistance Zones
Resistance R2 → Major rejection zone (double top area)
Resistance R1 → Previous supply zone
Price respected resistance and obeyed the trendline → SELL zone
5️⃣ Entry Logic (SELL)
Sell after:
Trendline break
Double top confirmation
Bearish engulfing close
This is a swing low sell setup
6️⃣ Targets & Risk Management
Support S1 → First target / partial booking zone
Support S2 → Final target
Risk : Reward = 1 : 2

XAUUSD/GOLD 4H BUY PROJECTION 28.12.25Pair: XAUUSD / Gold
Timeframe: 4H
Bias: Bullish (Buy continuation)
Date: 28-12-2025
Market is in a strong uptrend, respecting a parallel ascending channel.
📈 Technical Structure Explained
1️⃣ Trend & Pattern
Price is moving inside a Parallel Uptrend Channel
A Bullish Flag formed after a strong impulsive move
Then price formed a V-Continuation Pattern → strong bullish sign
Breakout happened with momentum candles
👉 This confirms trend continuation, not reversal
2️⃣ Key Levels Marked
🟦 Supports
Support S1: ~4520
Support S2: ~4500
These are dip-buy zones if price retraces.
🟥 Resistance / Breakout Area
Immediate Resistance: ~4530
Price broke & retested this zone
Also aligns with Fibonacci retracement + structure break
👉 This level is now acting as support
3️⃣ Entry Logic (Buy Setup)
✅ Buy Confirmation Zone
After breakout + retest
Strong bullish candle close above 4530
Momentum continuation (higher highs & higher lows)
🟩 Safe Buy Area:
4525 – 4535 (retest zone)
4️⃣ Targets (Upside Projection)
🎯 Target 1 (R1 / Previous High): ~4560
🎯 Target 2 (Expected ATH): ~4620
🎯 Extended Target: ~4660 – 4680
(Top of the channel / projected ATH)
5️⃣ Stop Loss (Risk Management)
🛑 SL Options:
Conservative SL: below 4500
Aggressive SL: below 4510
ATR-based SL preferred for volatility control

XAUUSD/GOLD 1H BUY PROJECTION 10.12.25“Character Invalid Here” (Lower Pink Zone)
This zone represents heavy sell pressure.
Price dropped deeply here → buyers were weak → sellers dominated.
From this area, the market started recovering upward slowly.
2️⃣ Day High as Resistance R1 (Middle Pink Zone)
This is a strong resistance level.
Price tested this zone multiple times and faced rejection.
This confirms it as a key intraday resistance.
Once price breaks and retests this area, bullish confirmation becomes stronger.
3️⃣ Bounce Back Area (Green Horizontal Zone)
This area is where you expect the pullback (retracement) to happen.
When price returns to this zone:
✔ Buyers re-enter the market
✔ Trend continues upward
✔ You get safe entry confirmation
This is a high-probability buy zone.
4️⃣ Entry After Bounce Back (Red Zone)
This is the ideal buy entry area after confirmation.
Your structure shows:
Price breaks the resistance
Pulls back for retest
Holds the major trendline
Respects the curved support (cup structure)
This indicates a strong bullish continuation setup.
5️⃣ Target Price (Weekly High Resistance & TP)
This is the weekly high, which acts as the final target.
The price is expected to reach this level due to:
Strong bullish momentum
Breakout + retest confirmation
Trendline support
Clean upside liquidity
This is a realistic and high-probability target.

XAUSD/GOLD 4H SELL PROJECTION 07.12.251. Major Rejection Zone
Price tapped into the Huge Liquidity Collection Zone (yellow zone).
Strong rejection with bearish candlestick formations (Engulfing + Spinning Top).
2. Pattern Confirmation
Double Top formation at Resistance R1–R2.
Neckline broken and candle closed below – confirming trend reversal.
Break of a major triangle pattern also supports bearish continuation.
3. Entry Zone
Entry marked at 4,207.97 zone after retest and bearish confirmation.
Confluence with:
Resistance Rejection
Structure Break
Bearish candle patterns
4. Stop Loss (SL)
SL placed at 4,243.17, above the wick and liquidity grab zone.
5. Take Profit (TP)
Targeting Premium Zone around 4,146.62.
Risk–Reward Ratio: 1 : 2
🎯 Final Sell Projection
Expecting price to drop towards 4,146–4,150 zone after rejection from liquidity and break of structure.
Bearish candlestick confirmation increases probability of continuation move.

XAUUSD/GOLD 1H BUY PROJECTION 02.12.25“Gold is currently reacting strongly from the premium weekly support zone.
A clear bullish engulfing candle has formed at the bottom, indicating strong buying pressure.”
Next:
Price was moving inside a parallel downtrend channel, but
The bearish structure has now broken, confirming a potential trend reversal.
The market has also broken the trendline, showing strong momentum from buyers.
After breaking the trendline, price is expected to:
Retest the break level (support turning from resistance).
Continue bullish towards Resistance R1 around 4228–4232.
If momentum holds, the move may extend towards Resistance R2 at 4255–4260.
This structure aligns with a clean liquidity grab, followed by trend reversal and bullish continuation.
🎯 Key Points (Easy to Explain on YouTube)
✅ Premium Weekly Support Zone Hit – strong reversal area
✅ Bullish Engulfing Formed – confirmation of buyer strength
✅ Downtrend Channel Broken – trend reversal confirmation
✅ Expecting Retest → Buy Continuation
🎯 Target 1: Resistance R1 (4230 level)
🎯 Target 2: Resistance R2 (4260 level)
⛔ Stop Loss: Below Weekly Support Zone (around 4185)
📌 Summary for Your Video / Telegram Post
“Gold is showing a strong bullish reversal from the premium weekly support zone.
A bullish engulfing followed by a clean trendline break confirms a potential buy setup.
As long as price holds above the retest zone, we expect upside targets towards 4230 and 4260.”
If you want, I can also prepare:
✔ YouTube Title + Description
✔ Thumbnail text (big bold letters)
✔ Short-form script (30–45 sec)
✔ Hashtags
✔ PDF or PNG formatted analysis
Just tell me “make title, description & thumbnail” and I’ll generate it.

XAUUSD/GOLD 1H BUY PROJECTION 02.12.25Market Structure
Price has broken the uptrend line, causing a corrective move inside a descending channel.
The correction is respecting channel boundaries (multiple rejections on top & bottom).
🔹 Key Zones
Support Zone: 4180 area
→ Confluence of FVG (Fair Value Gap) + Demand Zone + Channel Bottom.
Target Zone: 4218–4220
→ Retest of the broken structure zone.
🔹 Buy Setup Logic
Price dipped into OBEY CHANNEL + FVG + SUPPORT zone (blue/purple box).
Expectation: Price should bounce from support and move higher.
First target aligns with:
Channel Top
Breaked zone retest
Previous minor structure level.
🔹 Projection Outcome
A bullish push towards 4218.89 zone is projected if support holds.
SL should be placed below the 4168–4170 zone under channel + FVG.

WILL GOLD CONTINUE TO RISE?I. BASIC CONTEXT
On November 10, 2025, gold prices surged after the market reacted positively to news of the U.S. government reopening.
The current market sentiment expects the FED to cut interest rates soon as recent economic data indicates a weakening U.S. economy.
Lower interest rates mean cheaper money, a weaker USD, thereby driving funds into safe-haven assets like gold.
The current rally is seen as a news-based pullback, potentially extending to key resistance areas before the market establishes a medium-term trend.
II. TECHNICAL ANALYSIS
Main timeframe: H2
Market structure:
Gold prices have broken out of the accumulation triangle pattern.
Formation of an Inverse Head and Shoulders pattern → signaling the correction phase has ended.
III. TRADING SCENARIOS
✅ Main scenario: WATCH TO BUY THE TREND (BUY THE DIP)
Trend expectation: Prices continue to extend the pullback to resistance areas 4180–4220.
Buy zones (BUY ZONES):
Zone 4105–4103 (near old H2 resistance → becoming new support).
Zone 4115–4116 (confirmation area post-breakout).
Deeper zone: 407x – 405x (Fib 0.618, trendline confluence area).
If prices retest the H2 structure: 4040 – 4035.
Buy stop:
When prices break through the 416x area with strong candle force → a buy stop can be placed to follow the breakout momentum.
Note to check the timing and candle force on H2/M30 to confirm momentum.
⚠️ Alternative scenario: WATCH TO SELL REACTION
If clear signs of weakness appear at resistance, consider a short SELL reaction at:
4180–4185
4205–4220
These are potential profit-taking areas for the current pullback wave.
IV. RISK MANAGEMENT
Stop Loss (SL): 10 points
Take Profit (TP): 10–12–13 points depending on setup
RR ratio: 1:1 – 1:1.3
Prioritize capital management according to the principle R ≤ 1% account/order.
Additionally, monitor news on Mr. Trump's actions during this period.
The U.S. government has reopened this week, so expect a fair amount of news, stay alert.
Trade effectively

XAUUSD/GOLD 1H SELL PROJECTION 11.11.25XAUUSD/GOLD 1H Sell Projection (11.11.25) chart.
Here’s a quick technical breakdown of what this chart represents:
🟣 Setup Overview
Pair: XAUUSD (Gold)
Timeframe: 1 Hour (H1)
Bias: Bearish (Sell Setup)
🧩 Key Levels
Resistance / High: 4148.82
Stoploss: ~4141.63
Entry Zone: ~4129.45–4128.32
Target 1 (TP1): Around 4110 (S1 + FVG zone)
Target 2 (TP2): Around 4081 (S2 zone)
📉 Projection Logic
Price rejected from major resistance at 4148.
A short-term pullback / retracement is expected into the entry zone.
After possible retest, price is expected to drop towards TP1 and TP2.
The setup suggests a Risk-Reward Ratio (RRR) of roughly 1:2.5 to 1:3, favoring the sell side.
⚙️ Trading Idea Summary
Parameter Value
Bias Sell
Entry Range 4128–4130
Stop Loss 4141
Take Profit 1 (TP1) 4110
Take Profit 2 (TP2) 4081
R:R Ratio ≈ 1:3
Confirmation Bearish engulfing or rejection from resistance zone

XAUUSD/GOLD 1H SELL LIMIT PROJECTION 28.10.251H Sell Limit Projection Chart for XAU/USD (Gold):
📝 Chart Summary (28.10.25)
Timeframe: 1 Hour
Setup Type: Sell Limit Projection
Market Structure: Bearish
📈 Key Levels:
Sell Limit Zone (Entry Area): Around $3,958 (Resistance R1)
Stop Loss: Around $3,982 (Top of FVG + Trendline)
Target 1 (TP1): Support S1 – around $3,920
Target 2 (TP2): Support S2 – around $3,883
📉 Technical Confluences:
🔹 1H Downtrend Line acting as dynamic resistance
🔹 FVG (Fair Value Gap) aligning with entry zone
🔹 Fibonacci retracement zone overlap
🔹 Resistance R1 matches previous supply zone
🧭 Trading Plan Idea:
Wait for price to retrace back to $3,958 zone.
Place Sell Limit order in the zone.
Stop loss: Above $3,982 zone to protect from fakeouts.
Take Profit: First target at $3,920 (partial booking), second target at $3,883 (runner).
⚠️ Risk Notes:
Watch for liquidity grabs above R1 before rejection.
Avoid market entry — wait for price confirmation near the zone.
Adjust SL if price structure shifts on lower timeframes.

XAUUSD/GOLD WEEKLY SELL PROJECTION 26.10.25Here’s a clear explanation of the 4H SELL SETUP shown in your chart 📊👇
📌 Chart Breakdown (XAU/USD — Gold 4H)
Pattern: Rising wedge / structure breakdown
Trendline: “4H Uptrend Line – Broken” ✅
Candle signal: Bearish Engulfing at ATH (strong reversal confirmation)
🧭 Key Levels
🟥 Stop Loss: Around 4,225.640 (above structure high)
🟡 Entry Zone: ~4,192 (below trendline break)
🟢 Targets:
TP1: 4,125
TP2: 4,075
TP3: 4,031
🧠 Trading Logic
Market formed a Bearish Engulfing at the top.
The main trendline was broken, indicating possible trend reversal.
After a retest of the broken structure, price is expected to continue downward.
Multiple TPs (TP1, TP2, TP3) help scale out profits gradually.
SL is placed above the previous high to protect against a fake breakout.

XAUUSD / GOLD WEEKLY BUY PROJECTION – 12.10.25The market is currently showing strong bullish momentum after a clean V-shaped reversal from the support zone around $3,960–$3,980.
✅ Key Technical Highlights:
Support S2 Zone held well, forming a reversal V pattern, confirming buyers stepping in.
Price has broken and retested the breakout zone around $4,000, indicating buying strength.
A bullish momentum candle confirms continuation towards higher levels.
Fibonacci 0.5–0.618 retracement zone aligned perfectly with the support, giving more confluence for long entries.
If momentum sustains, price is projected to push towards:
📍 Resistance R1: $4,060 zone (first TP)
📍 Resistance R2 / New ATH Zone: $4,120 zone (final TP)
🛡️ Invalidation:
A clean break below the $3,960 support and the fair value gap would signal weakening momentum and cancel the bullish outlook.
📈 Summary:
Entry: After retest of breakout zone ($4,000–$4,010)
TP1: $4,060
TP2: $4,120
SL: Below $3,960 (Fair value gap)
🚀 Bias: Bullish
📅 Timeframe: 4H / Weekly
⚠️ Note: Always manage risk with proper position sizing and SL discipline

XAUUSD/GOLD WEEKLY BUY PROJECTION 28.09.25XAUUSD/Gold Weekly Buy Projection (27.09.25). Here’s a breakdown of what it shows:
Current Price Level: Around 3,759.85.
Technical Zones Marked:
Broke the Uptrend Line (earlier support turned resistance).
Bearish Engulfing Failed (bullish strength seen).
Fair Value Gap (FVG) near 3,740–3,750 zone, acting as a demand zone.
Projection Path:
Price expected to bounce from the FVG/demand area.
Then follow an upward zigzag movement toward the target zone around 3,860.
Trend Channel:
Multiple parallel blue channels drawn indicate a bullish structure.
Projection suggests continuation of the uptrend.
Target Price:
Marked close to 3,860, aligning with the upper channel line.
🔑 Summary of Projection:
Bias: Bullish
Entry Zone: 3,740–3,760 (Fair Value Gap zone)
Target Zone: 3,860
Risk Area: If price breaks below 3,720, projection may fail.
👉 Do you want me to prepare a trading plan (entry, SL, TP, and risk %) based on this projection for you?

XAUUSD/GOLD 1H BUY PROJECTION – 18.09.25The 1-hour chart of Gold shows a recent V pattern formation, signaling a strong bullish reversal after a sharp drop.
A downtrend breakout is confirmed, supported by a Three White Soldiers pattern, strengthening the bullish momentum.
Entry Zone: Around 3,668 (current price).
Support (S1): 3,655 – strong demand zone where buyers are likely to defend.
Resistance (R1): 3,685 – key target level for this bullish move.
Risk-to-Reward Setup: Stop-loss below support (S1) at 3,655, with take-profit at resistance (R1) near 3,685.
🔑 Conclusion: Gold (XAUUSD) is showing bullish signs with breakout confirmation. As long as price holds above support at 3,655, the projection favors upside movement towards 3,685.

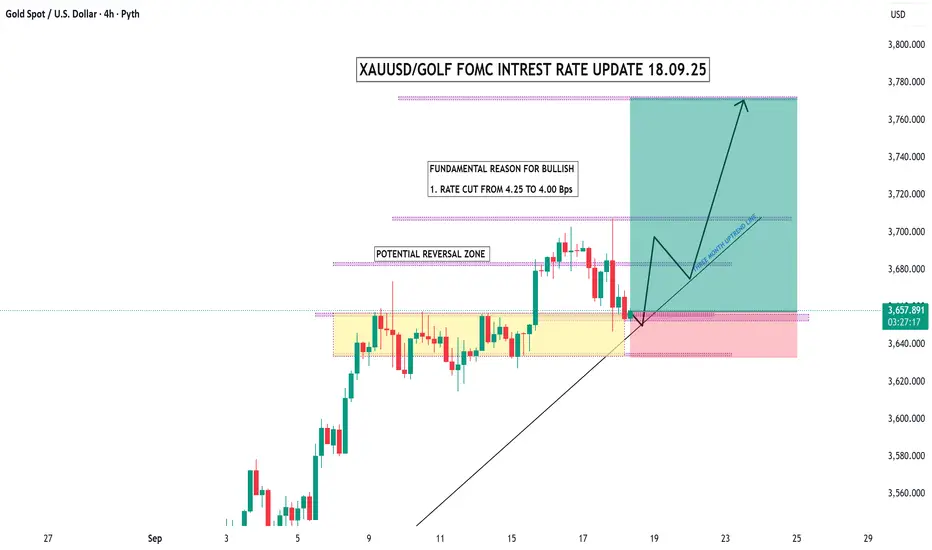
XAUUSD / Gold FOMC Interest Rate Update – 18.09.25Fundamental Reason for Bullish:
The Federal Reserve cut rates from 4.25% → 4.00%.
This supports gold’s bullish momentum since lower rates reduce the opportunity cost of holding gold.
Technical Structure:
Potential Reversal Zone: Highlighted in yellow. Price is currently testing this area around 3645–3655.
A bounce from this zone aligns with the 3-month uptrend line (black trendline).
If price respects this support, bullish continuation is expected.
Bullish Projection Path:
First, a rebound from the reversal zone.
Then, a push towards 3700–3720 with a possible retest.
Final Target Price Zone: ~3750–3780.
Risk Area (Stop Loss Zone):
If price breaks below the reversal zone and trendline (~3640–3635), bullish outlook weakens and downside risk opens.
🎯 Summary
Bias: Bullish (Fundamental + Technical confluence).
Reason: Rate cut + uptrend line support.
Targets: 3700 → 3750 → 3780.
Invalidation: Break below 3640.
XAUUSD/GOLD 1H SELL PROJECTION 15.09.25XAUUSD/Gold 1H Sell Projection (15.09.25). Here’s a structured breakdown of what the chart indicates:
🔎 Chart Analysis
Entry Zone: Around 3646 – 3647 (confluence of trendline + 0.618 Fibonacci retracement = "Golden Ratio").
Stop Loss: Around 3653.16 (above trendline & key resistance).
Take Profit Targets:
TP1 (Support S1): Around 3639 – 3640
TP2 (Support S2): Around 3630 – 3631
🧭 Trade Idea (Sell Bias)
Reasoning:
Price has rejected the descending trendline resistance.
Confluence with Fibonacci 0.618 retracement level (3647).
Bearish projection towards support zones.
📌 Summary
Setup: Short/Sell
Entry Zone: 3646 – 3647
Stop Loss: 3653
Target 1: 3640
Target 2: 3630
