XAUUSD (H4) – Weekly Outlook (Dec 22–26)Buy the dip inside the channel, watch for a short-term correction after Wave 5
Strategy summary for next week
On the H4 chart, gold is still trading inside a mid-term rising channel. However, the wave structure suggests Wave 5 is likely finished, so next week I’m focusing on two main ideas:
Mid-term BUY bias, but only if price pulls back to a better liquidity area.
Short-term SELL correction, triggered only with confirmation (break below 4309) on the lower timeframe.
1) Technical view: Uptrend channel holds, but a correction is likely
Price is currently in the upper half of the channel → not an ideal spot to chase buys.
The chart highlights two key liquidity areas:
Liquidity Sell Zone near 4433 (upside target, only valid if price builds a clean path higher).
Strong Liquidity around 4254 (the area where I want to reload mid-term buys).
Meaning: The channel is still the main framework, but if Wave 5 has finished, a pullback/correction is normal before the next directional leg.
2) Mid-term plan (priority): BUY at channel liquidity
✅ Buy zone: 4250 – 4255
SL: 4240
Expectation: A rebound back toward the channel’s midline, and if momentum returns, continuation toward 4433.
Logic: This is the “better price” area aligned with the channel structure + key liquidity. Risk-reward is far cleaner than buying at the highs.
3) Short-term plan: SELL the correction only after confirmation
Because Wave 5 looks completed, a corrective sell is valid — but I only want to sell after the market confirms on the lower timeframe:
✅ Bearish confirmation: break below 4309
After the break, prefer a sell on retest (no chasing).
A realistic correction target is a move back toward the 425x liquidity zone.
Note: This is a short-term correction trade and doesn’t conflict with the mid-term buy bias.
4) Fundamentals next week: Holiday liquidity = more sweeps
Dec 22–26 includes multiple European holidays, which often means thin liquidity: price may not trend hard, but it can still wick and sweep stops.
Geopolitical risk remains elevated: Israeli officials plan to brief Trump on potential new strikes on Iran — this can trigger sudden safe-haven flows into gold.
Action: Trade smaller, trade cleaner, and avoid getting trapped in abnormal volatility.
5) Execution checklist
Mid-term BUY: wait for 4250–4255, SL 4240.
Short-term SELL: only activate if 4309 breaks, then sell the retest on lower TF.
No FOMO in a low-volume holiday week.
Which scenario are you leaning into next week: buying 425x, or waiting for a 4309 breakdown to sell the correction?
Xauusdweekly

XAUUSD – ACCUMULATION TRIANGLE ON D1💛 XAUUSD – ACCUMULATION TRIANGLE ON D1, AWAITING A NEW BREAKOUT THIS WEEK 🎯
🌤 Overview of the New Week
Hello everyone, Lana here 💬
Gold, after a very strong rise from the 3,500 region to above 4,400, is entering a "resting" phase on the D1 frame: the price continuously tests the upward trendline but has not yet broken it to confirm a downtrend.
The market is clearly waiting for a real breakout before forming a new medium-term wave.
Next week, we have CPI and PPI – important inflation data that could act as a catalyst to push gold out of the current accumulation zone.
💹 Technical Analysis (Daily Triangle)
On the D1 frame, when connecting the descending peaks and ascending bottoms, gold is in a narrowing triangle pattern.
The upward trendline below is still maintained, indicating that the medium-term trend has not reversed.
Below are important zones:
≈ 3,890: if the price closes below this area, it could confirm medium-term weakening.
Fibonacci & psychological resistance zone 3,800–3,900: strong support, confluence with old price structure.
POC Volume Profile around 3,650: if a deep decline scenario occurs, this will be the next price attraction zone.
Above, the old peak zone around 4,300–4,400 remains a large liquidity zone, a natural target if gold breaks the upper edge of the triangle.
In summary: the more compressed the triangle, the stronger the breakout – the direction will depend heavily on CPI/PPI data & Fed expectations.
🎯 Reference Trading Plan (Medium-Term)
💖 Scenario 1 – Maintain Uptrend (priority when the trendline is not broken)
Observe the reaction at the D1 upward trendline (area around 4,000).
If the price continuously bounces from the trendline and stays above the 3,890 area, you can:
Prioritize buying according to the trend at support retests on H4–H1.
Medium-term targets: 4,150 → 4,250 → 4,300–4,400 if the triangle breaks upwards.
💢 Scenario 2 – Triangle Breaks, Shifts to Medium-Term Decline
If D1 closes below 3,890:
Consider this a signal confirming medium-term weakening.
Prioritize selling at newly formed resistance zones.
Step-by-step targets: 3,800 → 3,700 (POC) → 3,500 (strong previous support).
In both scenarios, specific entry points should be refined on smaller frames (H4, H1) based on price action/OB/FVG.
⚠️ Note News & Risk Management
Next week's CPI & PPI could be the "final blow," pushing gold out of the triangle – volatility can be wide and fast, spreads may widen.
Last week's NFP news hardly created big waves for gold after the US government shutdown, indicating the market is holding strength waiting for more important data.
🌷 Conclusion & Interaction with LanaM2
Gold on D1 is in the final stage of the accumulation triangle – this is a time where patient observation is as important as a beautiful entry point 💛
Next week, I will continue to update daily details on smaller frames so everyone can have more specific entry points.

Gold is compressed; next week’s US data will pick a side.Gold is being compressed, the upcoming US data week will determine which side is squeezed.
Good evening everyone, Brian here with a view on XAUUSD on the H2 and H4 frames for the upcoming week.
Fundamental Analysis – a "tailor-made" week for the USD
Next week is packed with US data, meaning gold will react more to numbers than narratives:
Core PPI, PPI, and Retail Sales
Initial Unemployment Claims
Prelim GDP q/q
Core PCE Price Index m/m – the Fed's preferred inflation measure
If inflation and growth come out weak, the market will lean more towards the slow growth / easing policy narrative. This usually puts pressure on the USD and supports gold, especially when real yields gradually decrease.
Conversely, stronger-than-expected data will strengthen the USD, increase yields, and create short-term downward pressure on gold. In such a context, price and liquidity areas around news release times will be more important than usual – typically, fading emotional spikes back to structural areas is safer than chasing the initial move.
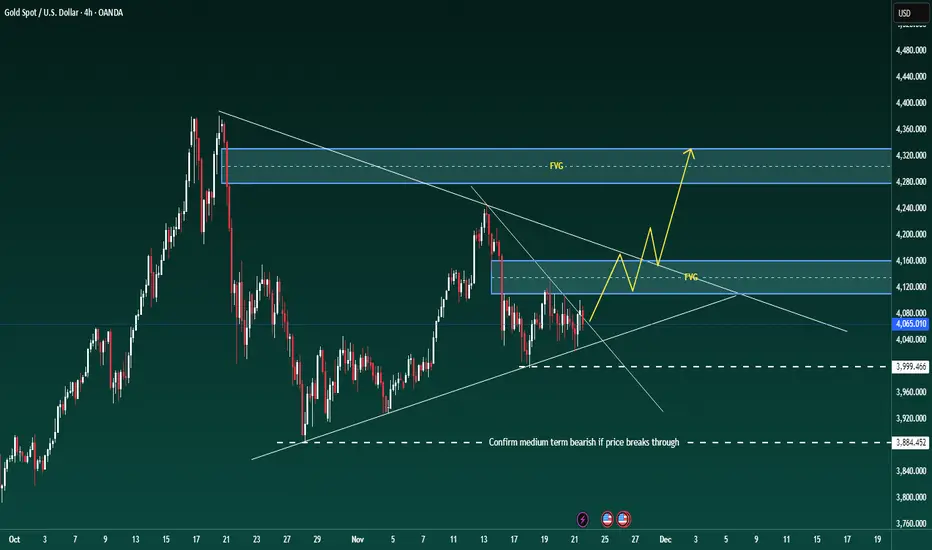
Technical Analysis – triangle, FVG, and key support areas
On the H4 frame, gold is still trading within a broad triangle structure. The previous decline has stalled, with prices continuously reacting at the upward support line and around 4,000, but there has yet to be a clear breakout from the pattern.
When zooming into H1–H2:
The price has broken a short-term downtrend line and closed strongly above – this is an early signal that selling pressure in this move is weakening.
The nearest support is around 4050–4040, deeper is the 4000–3998 support band (marked on the chart as important support). As long as it holds above 4,000, the structure remains positive.
Above, we have a very important confluence area around 4135–4160 including:
Fibo 0.382 of the most recent main decline
An old fair value gap (FVG) and resistance block
Chart note: "Gold will go strong if it passes this price range" – aligns with my view: if the price accepts above this area, the potential for a stronger upward move will open up.
Around 4100 is an area prone to "large liquidity response" – expect strong profit-taking and position restructuring if the price returns to this area.
Currently, I consider the market to be accumulating above 4,000 in a corrective pattern, with a slight upward bias as long as 4,000 is maintained.
Key Price Areas
Resistance:
4100 – first liquidity area
4135–4160 – Fibo 0.382 + FVG + strong resistance
Support:
4050–4040 – nearest intraday support
4000–3998 – large frame support; if broken, the picture changes
3940 area – stronger support if 4k is breached
Trading Scenarios for Next Week
(All are for reference only, not investment advice.)
Scenario 1 – Buy when price corrects above 4,000 (foundation for the next upward wave)
Idea: follow the forming upward bias as the price respects the triangle support and the 4,000 mark.
Entry area: 4050–4040 or any clean retest of the broken downtrend line on smaller frames
Cautious position addition area: 4025–4005 if there is a deep sweep to 4,000 with a strong bounce reaction
Stop loss: below 3990–3988 depending on risk appetite
Targets:
First: 4100 (liquidity area)
Second: 4135–4140 (lower edge of FVG/resistance)
Extended: 4155–4160 if a strong continuation move appears
Signals to wait for: wick rejections from support, bullish engulfing candles, or clear intraday structural phase shifts to higher highs and lows.
Scenario 2 – Break & Retest Long above 4135–4140
If the price doesn't give a deep correction and runs straight up:
Condition: H2/H4 candle closes clearly above 4135–4140 and holds on retest
Entry: when price pulls back in a controlled manner to the 4135–4140 area, turning this area from resistance to support
SL: below 4120
TP: 4180 → 4200+ depending on momentum strength
This is the "gold goes strong" scenario as noted on the chart – viewing the FVG/0.382 area as a launchpad for a larger impulsive upward wave.
Scenario 3 – Bearish scenario if 4,000 is broken
If fundamentals and flows turn against gold, decisively pushing the price below 4,000, the bullish view needs to be set aside.
Condition: daily candle closes clearly below 4000–3998
Plan: wait for the price to retrace up to retest 4000–4020 from below
Entry: short when rejection signals appear at that retest area
TP: 3960 → 3940, then reassess the structure
When below 4,000, the triangle will break down, and the market is likely to hunt deeper liquidity areas before potentially forming a new medium-term upward wave.
In summary: as long as 4,000 holds, I prioritize the buy scenario on corrections, respecting the upward potential to 4135–4160 and beyond. If there is a decisive break below 4,000, the picture will reverse – then retracements up will be opportunities to look for shorts.
Trade according to what the structure shows, not what I hope for. Manage risk tightly around next week's data points and let the major price areas "do the heavy lifting."
If this perspective helps you plan better, don't forget to follow Brian for weekly gold analysis and share your scenarios in the comments to compare.
XAUUSD 1W CHART ANALYSIStarget 2000 within 3 months from now which is before june 2022 .
when it closes above 200
THIS IS JUST FOR EDUCATIONAL PURPOSE. THIS ANALYSIS IS NOT FOR FINANCIAL PURPOSE.
