Yes Bank : Ready to reward you ~30% in a YearHi Friends,
Yes Bank looks promising now & ready for ~29% (Target ~30) upward journey.
I am anticipating the stock to start its upward journey.
Pattern : Beautiful inverse Head and shoulder is getting formed .
Entry point : Entry point is above YELLOW line.
Stoploss : Stoploss will be 10% below the YELLOW line
Timeline : ~01 Year
Targets, Stoploss & Entry are mentioned in the chart .
Please feel free to share your views regarding this chart & analysis .
Note : I am not a SEBI registered advisor . Please consider my analysis only for Education purpose .
Yesbank

BUY TODAY SELL TOMORROW for 5%DON’T HAVE TIME TO MANAGE YOUR TRADES?
- Take BTST trades at 3:25 pm every day
- Try to exit by taking 4-7% profit of each trade
- SL can also be maintained as closing below the low of the breakout candle
Now, why do I prefer BTST over swing trades? The primary reason is that I have observed that 90% of the stocks give most of the movement in just 1-2 days and the rest of the time they either consolidate or fall
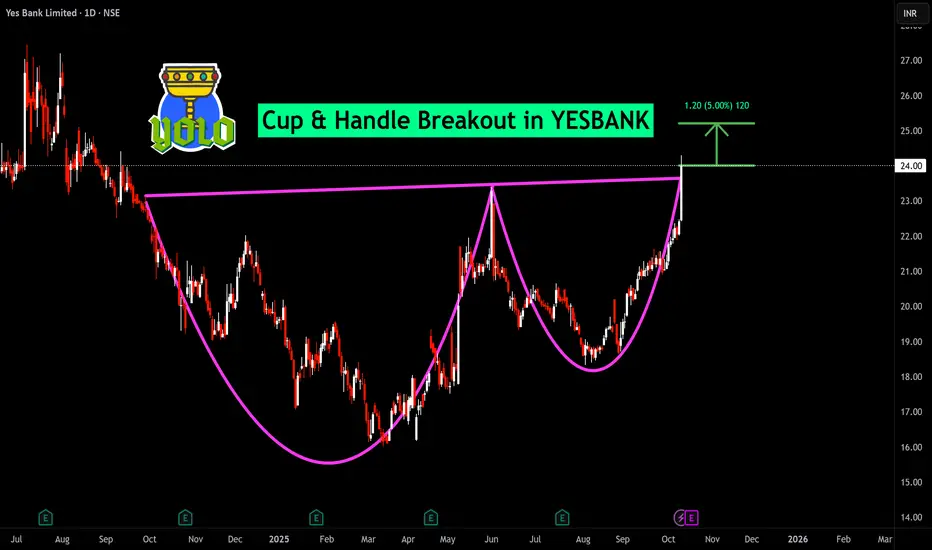
Cup & Handle Breakout in YESBANK
BUY TODAY SELL TOMORROW for 5%
YES BANK BY KRS Charts2nd Sept 2025 / 10:01 AM
Why Yes Bank ?
1. last few years YES BANK is making HH & HLs in Monthly & Weekly TFs . It has potential technically, but will check our patience.
2. Above Chart it fills up all the FVGs - Fair Value Gaps and bounced back in Month of April. As we can see in Chart mentioned recently also same FVG reversal is visible.
3. Also Potential of Reversal chart pattern at bottom of trend is also visible.🤞
4. Less than 2 Rs Risk and Almost 5 Rs Reward is making this trade Safe 👍
5. Point to be noted 20.25 Rs is nearest Resistance and Pattern Target of 28 Rs unlock After breakout of neckline at 22 Rs.

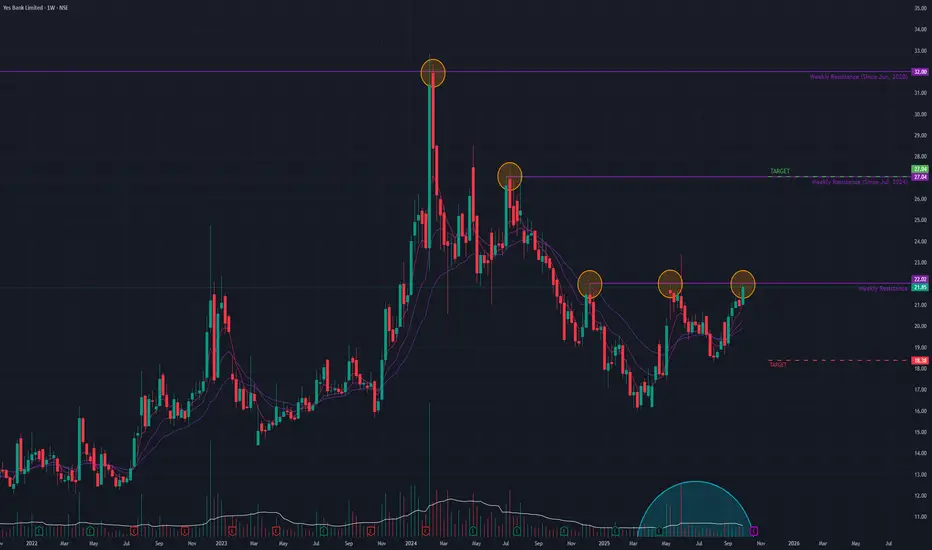
Yes Bank (W) - Challenges Key Resistance in Potential Trend RevYes Bank is showing signs of a potential trend reversal after being locked in a multi-year sideways consolidation since June 2020. Last week, the stock gained +4.2% on the back of a massive volume surge , indicating a significant increase in buyer interest.
The stock is now positioned directly below a critical horizontal resistance trendline . A decisive breakout above this level is required to confirm a shift from its long-term consolidation phase into a new uptrend.
Strong Long-Term Bullish Signals 👍
The potential for a reversal is supported by positive signals on higher timeframes:
- Monthly & Weekly Momentum: Short-term Exponential Moving Averages (EMAs) are in a bullish crossover state on both the monthly and weekly charts.
- Confirmed Strength: The Relative Strength Index (RSI) is also rising on both the monthly and weekly timeframes, confirming strong underlying momentum.
Outlook: A Breakout Awaits
The stock is at a crucial make-or-break point. While the long-term indicators are bullish, overcoming the overhead resistance is essential.
- Bullish Case 📈: If the current momentum is sustained and the stock achieves a decisive breakout, the next potential target is the ₹27 level.
- Bearish Case 📉: If the resistance holds and the momentum fades, the stock could pull back to find support near the ₹18 level.
Yes bank near breakout againSupport: ~ ₹20.00–₹20.50 (you might get safer entries here if stock dips)
Value Broking
Resistance: ~ ₹21.50–₹22.50; if it breaks above convincingly, next resistance could be slightly higher.
There is a strong daily upmove with volume ..Indicators like RSI, MACD are already showing bullish bias (but some show approaching overbought conditions).
My View — Should You Buy?
Yes — I lean toward yes, but with caution. If I were you, I’d consider buying some part now, holding with a stop-loss or watching these risk signals. It feels like the risk/reward is tilted in favor now more than it was some months ago.

YESBANK: Riding the Bullish WaveYes Bank has exhibited a notable breakout above the resistance level established in December 2024. This breakout is accompanied by a classic flag pattern formation, which has resolved to the upside—typically interpreted by technical analysts as a continuation signal within an existing trend.
A significant increase in trading volume during the breakout phase adds weight to the move, suggesting heightened market participation. Furthermore, the 20-day EMA has crossed above the 200-day EMA, a crossover often referred to as a "Golden Cross" , which is generally viewed as a bullish signal indicating potential for continued upward momentum.
The RSI is currently positioned above 60, reflecting sustained buying interest without yet entering overbought territory.
From a structural perspective:
Immediate resistance may be encountered near the 24.75 level.
A secondary resistance zone appears around 28.54.
On the downside, the stock seems to have established a support base near 19.54, which could act as a cushion in the event of a pullback.
Disclaimer:
This analysis is intended solely for informational and educational purposes. It does not constitute investment advice, a recommendation, or an offer to buy or sell any securities. Market conditions can change rapidly, and all trading involves risk. Individuals should conduct their own due diligence or consult with a qualified financial advisor before making any investment decisions.

YESBANK FLAG PENNANT BREAKOUTYesbank breaking flag pennant pattern
with huge volume,macd crossover done
it may retest n then move upward
#target 25 sl 21
NO BUY/SELL RECOMENDATION

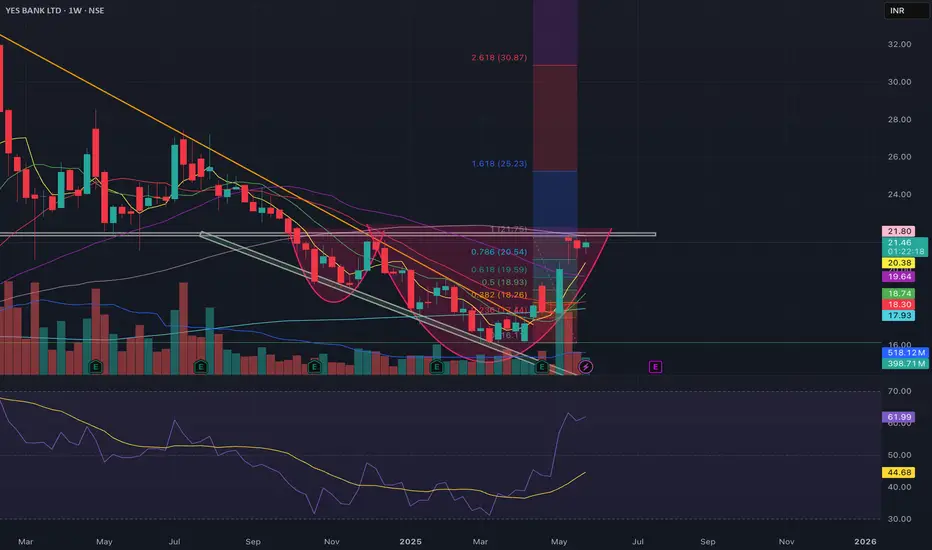
YESBANK set to give at least 10% upside C&H pattern formation in W
Price taken support on the MA.
Good consolidation since last several days
Resistance at 22.
RSI indicating strength.
Ideal target in the range of 24-25, CMP: 21.52 ,SL: 20
Upside targets of 30+ expected.
Life Ko Banao RichYes Bank - Cmp 21.55
Incorporated in 2003, Yes Bank Ltd is engaged in providing a wide range of banking and financial services
This is just to boost my confidence. No Suggestions for buying.
Disclosure: I am not SEBI registered. The information provided here is for educational purposes only. I will not be responsible for any of your profit/loss with these suggestions. Consult your financial Adviser before making any decisions.

YESBANK - Daily -Breakout with volumes -Inverted HnSThis is a daily chart for YES BANK LTD (YESBANK) as of May 9th, 2025.
Here's a technical analysis of the chart:
Falling Wedge Pattern:
The stock was in a clear downtrend, forming a falling wedge pattern from approximately February 2024 to early 2025. A falling wedge is often a bullish reversal pattern when it occurs after a downtrend.
The price broke out from the upper trendline of this falling wedge around January/February 2025.
Inverted Head and Shoulders Pattern:
Following the breakout from the falling wedge, an inverted head and shoulders pattern appears to have formed. This is also a bullish reversal pattern.
Left Shoulder: Formed around February 2025.
Head: The lowest point, formed around late February/early March 2025.
Right Shoulder: Formed around April/early May 2025.
Neckline: The neckline of this pattern is approximately at the 19.41. The price is currently testing and attempting to break out above this neckline.
Volume:
There's a noticeable increase in volume on the recent candles as the price challenges the neckline of the inverted head and shoulders pattern. This is a positive sign and can add conviction to a potential breakout.
Support and Resistance:
Immediate Resistance: The neckline area of 19.41 - 20.02 is the critical immediate resistance. A decisive close above this level is needed to confirm the breakout.
Next Resistance/Target: The chart indicates a potential target of 22.73 based on the height of the inverted head and shoulders pattern (approximately 3.33 points) projected upwards from the neckline.
Support:
The lows of the right shoulder (around 17.50-18.00) would act as initial support.
The low of the head (around 16.02) is a more significant support level.
The upper trendline of the previous falling wedge could also offer support if retested.
Interpretation:
The chart for Yes Bank shows multiple bullish reversal signals.
The breakout from the long-term falling wedge was the first sign of a potential trend change.
The formation of the inverted head and shoulders pattern further strengthens the bullish case.
The stock is currently at a crucial juncture, attempting to break out above the neckline of the inverted head and shoulders. The increased volume is supportive of this attempt.
A sustained close above ~20.02 would confirm the breakout and suggest a potential move towards the target of 22.73.
Failure to break out or a rejection from the neckline could lead to a retest of lower support levels.
Disclaimer: This technical analysis is for educational purposes only and should not be considered financial advice. Always conduct your own thorough research and consult with a qualified financial advisor before making any investment decisions

Smart money buying in YES BANK.YES Bank Breakout Alert
YES Bank has recently shown a strong breakout supported by high trading volume, following news that Japan's Sumitomo Mitsui Banking Corporation has received RBI approval to acquire a 51% stake in the bank.
From a technical standpoint, the chart structure indicates a bullish trend on higher time frames. If this breakout holds as genuine, the stock has the potential to test ₹22.50 and ₹28 levels in the near term — representing an upside of approximately 40% from current levels.

YES BANK - TECHNICAL#yesbank stock has been under scrutiny due to its performance. It has seen a decline over four consecutive days, amounting to a total drop of 7.11% as of February 11, 2025. The stock is trading below several key moving averages, which might indicate broader market pressures or specific challenges for the bank.

Update on #YESBANK The company has recently released its results and the results are outstanding with net profit rising 145 percent. I expect a strong rally with bullish momentum from here as we have filled the FVG between 17.5 to 19.5 and due to the strong financial result we could see serious bullish momentum take over. I had shared 3 entries at ₹23, ₹20 and ₹19.5 . All three of your entries should now be active.
These entries were perfectly timed with the result of yes bank and correction in nifty . I believe we will reach the three targets that I had mentioned within 4 to 5 years from here now.
Target prices ₹93, ₹120 and 280, check out my earlier post on Yes bank for more information about the company's fundamentals and technical.

BOB | Trendline Bull Breakout ⭕️ Swing Trading opportunity: Price Action Analysis Alert !!!⭕️
💡✍️Technical Reasons to trade or Strategy applied :-
✅Triangle Chart Pattern Bull Breakout
✅Breakout confirmed
✅Rise in Volume
✅Good 3 touches Trendline Breakout with volume
✅Clear uptrend with HH & HLs sequence
✅ Order block as potential Target
✅Check out my TradingView profile to see how we analyze charts and execute trades.
🙋♀️🙋♂️If you have any questions about this stock, feel free to reach out to me.
📍📌Thank you for exploring our idea! We hope you found it valuable.
🙏FLLOW for more !
👍LIKE if useful !
✍️COMMENT Below your view !

Yes Bank cmp 23 by Weekly Chart viewYes Bank cmp 23 by Weekly Chart view
- Support Zone at 21 to 22.50 Price Band
- Old Daily Chart Gap Down Opening of January 2023 has been filled
- Weekly basis Support at 20 > 16 > 11 with Resistance at 27 > 32 > 37
- *Recent Daily Chart Gap Down Opening of July 2024 will need to be filled, sooner or later*
- *Stock Price is sustaining above Support Zone but Volumes suggestive of probable breakdown if the Support Zone is crossed*

Yesbank is saying noYesbank chart is not saying anything positive, waiting for it to come 16-17 range to buy

Is YesBank Cheap, NOOOOOOOIs yesbank share price cheaper, No way, its 4 times costilier than HDFC, ICICI and AXIS, so do study before buying or keeping it for longer

YES Bank - SIP System InvestmentYes bank is good to buy on SIP based system.
Market Cap: ₹ 80,940 Cr.
Promoter holding: 0.00 %
FII holding: 28.4 %
DII holding: 38.1 %
Public holding: 33.5 %
Promotors holding is 0% now but majority of Stocks on DII has and DII are's most of banks and insurance companies. Once these company hold for the long time and stock rises. Promoters will be interested to buy this stock.

Yes Bank - Inverted head and shoulderBullish head and shoulder formed in Yes bank and waiting for closing above the neckline, once we get positive closing above the neckline then we are expecting the good move in upside in upcoming days.
Thank You
Arvind Yadav, Cfa
Arvind Share Academy


SWING IDEA - YES BANKYes Bank stock presents a compelling opportunity for a swing trade, supported by strong technical indicators:
Reasons are listed below :
Multiple tests at the 21 levels culminated in a decisive breakout.
A significant marubozu candle on the weekly timeframe signals bullish momentum.
The breakout was accompanied by a notable increase in trading volumes.
Ongoing formation of higher highs indicates a sustained upward trend.
Positive positioning, as the price is trading above both the 50 and 200-day Exponential Moving Averages (EMA), reflecting momentum strength.
Target - 30 // 49
StopLoss - weekly close below 20.85
DISCLAIMER -
Decisions to buy, sell, hold or trade in securities, commodities and other investments involve risk and are best made based on the advice of qualified financial professionals. Any trading in securities or other investments involves a risk of substantial losses. The practice of "Day Trading" involves particularly high risks and can cause you to lose substantial sums of money. Before undertaking any trading program, you should consult a qualified financial professional. Please consider carefully whether such trading is suitable for you in light of your financial condition and ability to bear financial risks. Under no circumstances shall we be liable for any loss or damage you or anyone else incurs as a result of any trading or investment activity that you or anyone else engages in based on any information or material you receive through TradingView or our services.
@visionary.growth.insights

Breakout in Yes Bank Limited...Chart is self explanatory. Levels of breakout, possible up-moves (where stock may find resistances) and support (close below which, setup will be invalidated) are clearly defined.
Disclaimer: This is for demonstration and educational purpose only. This is not buying or selling recommendations. I am not SEBI registered. Please consult your financial advisor before taking any trade.

YESBANK (Weekly BO)YesBank is back from the dead and gave a weekly breakout. Add some qty once it retraces the support area.
NOTE: I'm not a SEBI REG. Study before investing.
