ZEN – 80% Breakout and Still ClimbingZEN has been on absolute fire lately. After breaking out cleanly from a symmetrical triangle, the move didn’t just stop — it exploded. From the $11 breakout zone, price surged all the way to around $21, delivering nearly an 80% gain in just a few sessions. That’s the kind of follow-through breakout traders dream about.
The momentum is backed by solid fundamentals on the tape too — 24h trading volume topping $544M and a market cap now near $353M. The weekly performance is up 77.8%, monthly up 104%, and an insane 6-month run of +142%. This isn’t just a short-term pop — ZEN’s been in a sustained recovery phase after months of underperformance.
Technically, price is still holding strong above the former resistance line, and the breakout structure remains valid. A brief pullback to cool off wouldn’t surprise anyone, but the trend bias is clearly bullish while volume and momentum stay this strong.
ZEN’s breakout is a perfect example of how patience inside compression patterns pays off once the energy releases.
👉 Check out my profile and follow for more powerful breakout setups like this one.
ZEN

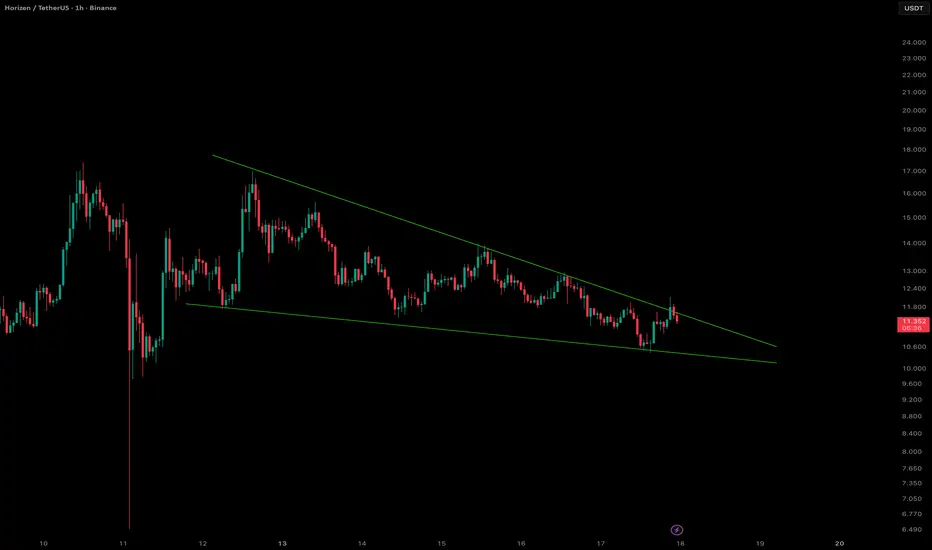
ZENUSDT Breaking Out of the Falling Wedge??HORIZEN (ZENUSDT) Analysis - 1 Hour Time Frame
Looks like ZEN is trying to break out of the falling wedge pattern. A candle close with decent volume or a successful retest above the falling wedge could confirm the bullish breakout.
In any case, Iam keeping an eye on this one, added to my watch list.
Dont forget to like and follow me to for more trade opportunities.
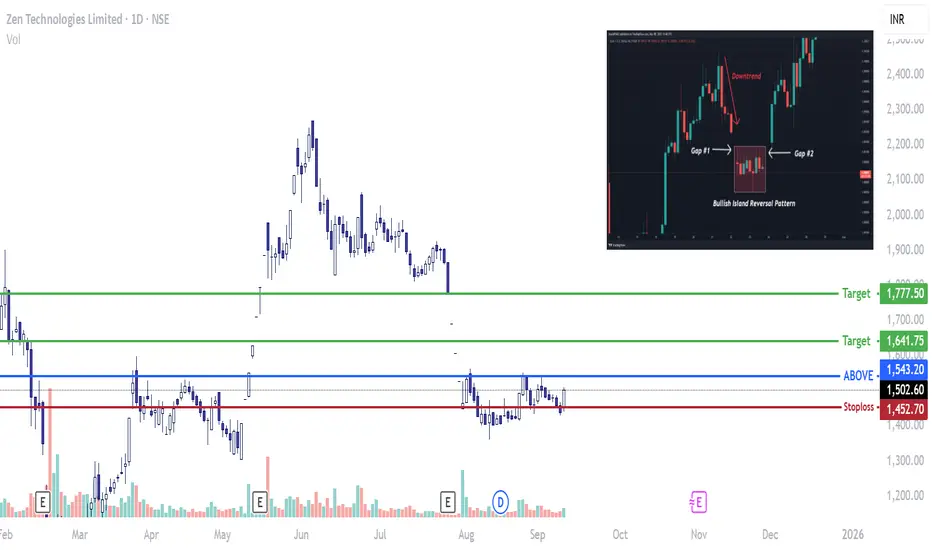
ZEN TECHNOLOGIES - Bullish Island Reversal?A very prominent contender in the Drone Space amongst the defence companies.
Mediocre results plummeted the stock to lower levels but the growth is still intact.
Look out for a gap up opening in days to come.
Low Risk High Reward Setup.
Stoploss is mandatory.
ZEN is gearing up for a potential bullish blastoff! 🚀💎 Paradisers, #ZEN is approaching a bullish Order Block (OB) + Demand area, which is further reinforced by a supportive trendline.
💎If #ZENUSDT breaks out above the resistance level from this point, we can anticipate a bullish movement up to the next resistance levels. It would be ideal if the price forms a bullish pattern here, such as a 'W' pattern, cup and handle, or an inverse head and shoulders.
💎However, in the event of a breakdown of the bullish OB, demand area, and supportive trendline, it will be considered bearish. In this scenario, I prefer to stay out of the market, as I am not interested in engaging on the bearish side for now.


There is a possibility for the beginning of an uptrend in ZENETHTechnical analysis:
. Horizen/Ethereum is in a range bound and the beginning of uptrend is expected.
. The price is below the 21-Day WEMA which acts as a dynamic resistance.
. The RSI is at 37.
Trading suggestion:
. There is a possibility of temporary retracement to suggested support zone (0.03900 to 0.03600). if so, traders can set orders based on Price Action and expect to reach short-term targets.
Beginning of entry zone (0.03900)
Ending of entry zone (0.03600)
Entry signal:
Signal to enter the market occurs when the price comes to " Buy zone " then forms one of the reversal patterns, whether " Bullish Engulfing ", " Hammer " or " Valley " in other words, NO entry signal when the price comes to the zone BUT after any of reversal patterns is formed in the zone. To learn more about " Entry signal " and the special version of our " Price Action " strategy FOLLOW our lessons :
Take Profits:
TP1= @ 0.04420
TP2= @ 0.05170
TP3= @ 0.05780
TP4= @ 0.06390
TP5= @ 0.07260
TP6= @ 0.08360
TP7= Free

There is a possibility for the beginning of an uptrend in ZENETHTechnical analysis:
. HORIZEN/ETHEREUM is in a range bound and the beginning of uptrend is expected.
. The price is above the 21-Day WEMA which acts as a dynamic support.
. The RSI is at 62.
Trading suggestion:
. There is a possibility of temporary retracement to suggested support zone (0.03790 to 0.03320). if so, traders can set orders based on Price Action and expect to reach short-term targets.
Beginning of entry zone (0.03790)
Ending of entry zone (0.03320)
Entry signal:
Signal to enter the market occurs when the price comes to " Buy zone " then forms one of the reversal patterns, whether " Bullish Engulfing ", " Hammer " or " Valley " in other words,
NO entry signal when the price comes to the zone BUT after any of the reversal patterns is formed in the zone.
To learn more about " Entry signal " and the special version of our " Price Action " strategy FOLLOW our lessons:
Take Profits:
TP1= @ 0.04420
TP2= @ 0.05170
TP3= @ 0.05780
TP4= @ 0.06390
TP5= @ 0.07260
TP6= @ 0.08360
TP7= Free
