GIFT Nifty & Global Index Correlations1. Introduction
The Indian financial ecosystem has undergone a significant transformation with the emergence of GIFT Nifty, a rebranded and relocated avatar of the former SGX Nifty. As India sharpens its global financial ambitions through GIFT City (Gujarat International Finance Tec-City), the GIFT Nifty has become a key component of the country’s market-linked globalization strategy.
But how does GIFT Nifty correlate with global indices like the Dow Jones, NASDAQ, FTSE 100, Nikkei 225, Hang Seng, and others? What signals can traders extract from global market trends before the Indian markets open?
This article explores in detail the correlation dynamics, strategic trading implications, and macroeconomic interlinkages between GIFT Nifty and major global indices.
2. Understanding GIFT Nifty
2.1 What is GIFT Nifty?
GIFT Nifty is the derivative contract representing the Nifty 50 index, now traded on the NSE International Exchange (NSE IX), based in GIFT City, Gujarat. It replaced SGX Nifty, which was earlier traded on the Singapore Exchange.
2.2 Trading Timings (as of 2025)
GIFT Nifty offers nearly 21 hours of trading, split into:
Session 1: 06:30 AM to 03:40 PM IST
Break: 03:40 PM to 04:35 PM IST
Session 2: 04:35 PM to 02:45 AM IST (next day)
This extended timing gives Indian and global investors the chance to react to major international events before the NSE opens.
3. Why GIFT Nifty Matters in Global Context
3.1 Price Discovery
Previously, SGX Nifty was used globally to gauge early cues on Indian markets. Now, GIFT Nifty fulfills that role and is even more significant because it's regulated by Indian authorities.
3.2 Liquidity Bridge
Foreign investors prefer GIFT Nifty because of:
Tax neutrality (IFSC jurisdiction)
Global accessibility
Ease of hedging and arbitrage opportunities
3.3 Strategic Global Position
Being open almost all day, GIFT Nifty trades during:
Asian trading hours
European sessions
Part of US session
This makes it a strategic derivative bridge between Indian equity markets and global macro flows.
4. Global Indices Overview: Benchmarks that Influence
Index Country Nature
Dow Jones USA Blue-chip, Industrial
NASDAQ USA Tech-heavy, Growth
S&P 500 USA Broad-market gauge
FTSE 100 UK Multinational, Export-led
DAX Germany Industrial + Auto-heavy
Nikkei 225 Japan Export, Tech-heavy
Hang Seng Hong Kong/China China proxy
Kospi South Korea Semiconductors & Auto
ASX 200 Australia Commodities & Finance
5. Key Correlation Patterns: GIFT Nifty & Global Indices
5.1 US Markets (Dow, NASDAQ, S&P 500)
Time Lag Advantage:
GIFT Nifty's evening session overlaps with the US market opening hours, making it sensitive to Dow/NASDAQ moves.
Risk-On/Risk-Off Trends:
If the NASDAQ or S&P 500 is sharply rising or falling due to earnings, inflation data, or Fed policy, GIFT Nifty reacts instantly.
Example:
Fed raises interest rates → US markets drop → GIFT Nifty falls in Session 2 → Nifty 50 opens gap-down next day.
Correlation Type:
Short-term positive correlation, especially during high-volatility events like CPI data or FOMC meetings.
5.2 European Markets (FTSE 100, DAX, CAC 40)
Mid-Day Influence:
European indices open in the afternoon IST, during GIFT Nifty’s Session 1. Their influence is moderate, often acting as early signals.
Macroeconomic Impact:
German or UK GDP data, ECB policy, or political issues (e.g., Brexit) affect GIFT Nifty during Session 1.
Example:
Weak PMI in Europe → FTSE falls → Risk aversion spreads → GIFT Nifty may drift lower.
Correlation Type:
Indirect correlation; significant during global crises or common central bank themes (e.g., inflation).
5.3 Asian Markets (Nikkei 225, Hang Seng, Kospi, ASX 200)
Morning Cue Providers:
Asian indices open before or along with GIFT Nifty’s Session 1, providing the first directional hint for Indian markets.
China Sentiment Impact:
Hang Seng and Shanghai Composite are highly sensitive to China policy. Their movements impact EM sentiment, which includes India.
Example:
Weak China export data → Hang Seng crashes → GIFT Nifty opens weak → Nifty follows suit.
Correlation Type:
Early session leading indicators, often showing short-term correlation due to regional capital flow sentiments.
6. Real Market Scenarios (Case Studies)
6.1 Fed Rate Hike Day – March 2025
US Market:
Dow fell 500 points post-Fed hawkish tone.
GIFT Nifty Reaction:
Dropped 120 points in the 2nd session.
Next Day NSE Open:
Nifty 50 gapped down by 110 points.
Inference:
Strong US market correlation, with GIFT Nifty acting as a real-time risk indicator for Indian markets.
6.2 China Lockdown News – July 2024
Asian Markets:
Hang Seng fell 4% due to Beijing lockdown.
GIFT Nifty Session 1:
Opened weak and stayed under pressure.
European Markets:
Added to risk-off mood.
Inference:
GIFT Nifty reflected immediate EM sentiment decline, even before Indian equities opened.
7. Correlation Statistics (Indicative)
Index Average Correlation Coefficient (6-Month Daily Returns)*
S&P 500 +0.55 (moderate positive)
NASDAQ +0.47 (tech-led directional link)
Dow Jones +0.52 (risk sentiment)
Nikkei 225 +0.41 (Asian correlation)
Hang Seng +0.48 (China-linked flows)
FTSE 100 +0.35 (weak to moderate)
Note: Correlation coefficients range from -1 (inverse) to +1 (perfect positive). Above +0.4 shows moderate correlation.
8. Correlation Factors: What Drives Interlinkage
8.1 Global Risk Sentiment
Markets move together when there is either extreme fear (e.g., war, recession) or exuberance (e.g., tech rally, global rate cuts).
8.2 Dollar Index (DXY) & US Bond Yields
When the Dollar rises, emerging markets like India often see outflows, affecting GIFT Nifty.
8.3 Crude Oil
India imports >80% of its oil. Rising crude → inflation risk → negative for Indian markets → reflected in GIFT Nifty.
8.4 Institutional Flows
Foreign Institutional Investors (FIIs) hedge positions through GIFT Nifty based on global triggers like Fed policy or earnings in the US.
8.5 Tech & IT Linkage
Indian IT stocks (Infosys, TCS) are correlated with NASDAQ performance due to global outsourcing demand.
Conclusion
The GIFT Nifty’s correlation with global indices is not just statistical—it’s strategic. It acts as a real-time risk barometer for Indian markets, influenced by global capital flows, geopolitical risks, tech trends, and central bank moves. While the correlations vary across geographies, they offer a powerful predictive framework for active traders and investors alike.
By mastering how GIFT Nifty reflects or diverges from global benchmarks like the Dow Jones, NASDAQ, Nikkei, or FTSE, traders can make more informed entry-exit decisions, especially during pre-market and overnight sessions.
Zomato
Quantitative Trading with Minimal Code (No-code/Low-code Tools)1. Introduction to Quantitative Trading
Quantitative trading (quant trading) refers to using mathematical models, statistical techniques, and algorithmic execution to trade in financial markets. Instead of relying solely on human judgment or traditional analysis, quant traders use data-driven strategies to make decisions.
Traditionally, quantitative trading required strong programming skills, knowledge of statistics, and access to large computing resources. However, the financial technology (fintech) landscape has changed drastically in recent years. Today, even non-programmers can access and build powerful trading strategies using no-code or low-code tools.
This article explores the world of quantitative trading with minimal code, empowering retail traders and small teams to automate strategies with limited technical barriers.
2. Understanding the Traditional Quant Trading Stack
Before diving into no-code/low-code alternatives, it’s important to understand the traditional quant stack:
Layer Traditional Tools
Data Collection Python, APIs, Web Scraping
Data Analysis Pandas, NumPy, R, SQL
Strategy Design Python, MATLAB
Backtesting Backtrader, Zipline, QuantConnect
Execution Interactive Brokers API, FIX Protocol
Monitoring & Reporting Custom dashboards, Logging scripts
Each layer generally requires coding proficiency, especially in Python or C++.
3. The Rise of No-Code and Low-Code Quant Platforms
No-code platforms allow users to perform complex tasks without writing any code, usually via graphical interfaces.
Low-code platforms require minimal coding—often drag-and-drop features with the option to customize small logic using scripting.
Drivers of Growth:
Democratization of finance and technology
Retail interest in algo and quant trading
Cloud-based platforms and APIs
Accessible market data and broker APIs
Lower cost and increased competition
4. Key Components of No-Code/Low-Code Quant Trading
To trade algorithmically without coding, you still need to go through the following steps—but tools simplify each process:
a. Data Sourcing
Even in no-code systems, data is the backbone.
Pre-integrated sources: Many platforms come with data from NSE, BSE, Forex, Crypto, and US markets.
Custom uploads: Upload your own CSV/Excel files.
APIs: Some tools let you connect with APIs like Yahoo Finance, Alpha Vantage, Polygon.io.
b. Strategy Building
Instead of writing logic like if RSI < 30: buy(), platforms offer drag-and-drop rule builders.
Indicators: RSI, MACD, Bollinger Bands, EMA, SMA, VWAP
Conditions: Crossovers, thresholds, trend direction, volume spikes
Signals: Buy, sell, hold, short, exit
c. Backtesting
Platforms allow historical simulation:
Choose timeframe (e.g., 5-minute candles, daily)
Run strategy across past data
Analyze win rate, drawdown, Sharpe ratio, etc.
Visual performance charts
d. Paper Trading & Live Execution
Once backtests look good, you can deploy:
Paper trading (no real money)
Broker integrations: Connect with brokers like Zerodha, Fyers, Alpaca, IBKR
Execution modes: Time-based, event-driven, portfolio-based
e. Monitoring
Real-time dashboards
Notifications via email, SMS, Telegram
Log of executed trades, slippages, and system errors
5. Popular No-Code / Low-Code Tools for Quant Trading
Here’s a list of tools currently used by non-coders and quant enthusiasts alike:
1. Tradetron (India-Focused)
No-code strategy builder with conditions, actions, and repair logic
Built-in indicators, custom variables, Python scripts (for low-code)
Supports Indian brokers (Zerodha, Angel, Alice Blue, etc.)
Auto trade, backtest, paper trade
Marketplace for strategy leasing
Ideal for: Retail traders in India with no coding background
2. QuantConnect (Low-Code, Global)
Primarily Python-based but offers drag-and-drop templates
Access to US equities, FX, Crypto, Futures
Lean Algorithm Framework (can host locally or in cloud)
Advanced backtesting and optimization
Ideal for: Semi-technical traders who want power with minimal code
3. Alpaca + Composer
Alpaca: Commission-free stock trading API
Composer: No-code visual strategy builder using drag-and-drop blocks
Rebalance logic, momentum themes, machine learning templates
Real-time execution on Alpaca
Ideal for: US market-focused traders, especially beginners
4. BlueShift (by Rainmatter/Zerodha)
Low-code environment for backtesting strategies
Python-based (but simpler than QuantConnect)
Integrated with Zerodha's Kite API
Access to Indian historical data
Ideal for: Traders with light Python skills focused on Indian markets
5. Kryll.io (Crypto)
No-code crypto strategy builder
Visual editor with technical indicators
Connects to Binance, Coinbase, Kraken, etc.
Marketplace for ready-made bots
Ideal for: Crypto traders who don’t want to code
6. MetaTrader 5 with Expert Advisors Builder
MT5 is very powerful but requires MQL5 coding
Tools like EA Builder allow strategy creation without coding
Drag-and-drop indicators, entry/exit rules
Suitable for Forex, CFDs, and indices
Ideal for: Traditional traders moving into automation
7. Amibroker + AFL Wizard
AFL (Amibroker Formula Language) can be complex
AFL Wizard helps create strategies via dropdowns and templates
Chart-based testing and semi-automated trading
Ideal for: Intermediate Indian traders familiar with Amibroker
6. Building a Quant Strategy Without Coding (Example)
Let’s walk through a basic momentum strategy using a no-code platform like Tradetron:
Goal: Buy stock when 14-period RSI crosses above 30; sell when it crosses below 70.
Steps:
Select Instrument: Nifty 50 index
Condition Block:
Condition 1: RSI(14) crosses above 30 → Action: BUY
Condition 2: RSI(14) crosses below 70 → Action: SELL
Position Sizing: Fixed lot or % of capital
Execution: Real-time or on candle close
Backtest: On 1Y daily data
Deploy: Connect to broker API for live or paper trading
All done with dropdowns, no typing code.
Conclusion
Quantitative trading no longer belongs only to PhDs and hedge funds. With the rise of no-code and low-code platforms, anyone can participate in data-driven algorithmic trading.
Whether you're a retail trader in India using Tradetron, a crypto enthusiast on Kryll, or a US equity trader exploring Composer, the tools today empower you to create, test, and execute trading strategies—with minimal to no coding.
Part4 Institution Trading Options trading in India is governed by SEBI and offered by NSE and BSE. Most options are European-style, meaning they can be exercised only on expiry day (unlike American options which can be exercised any time before expiry).
Popular instruments:
Index Options: Nifty 50, Bank Nifty, Fin Nifty
Stock Options: Reliance, HDFC Bank, Infosys, etc.
Example Trade
Suppose Nifty is at 22,000. You expect it to rise. You buy a Nifty 22,200 CE (Call Option) at ₹100 premium, lot size 50.
If Nifty goes to 22,400 → intrinsic value = 200, profit = ₹100 × 50 = ₹5,000
If Nifty stays at or below 22,200 → Option expires worthless, loss = ₹5,000
This asymmetry is what makes options attractive for speculation.
1. Retail Traders
Mostly use options for directional bets and small capital plays.
2. Institutions (FIIs, DIIs)
Use options for complex hedging and large-volume strategies.
3. Hedgers
Use options to reduce portfolio risk.
4. Speculators
Profit from volatility or short-term price movements.

Part 6 Institution Trading Introduction
In the world of financial markets, Options Trading has emerged as one of the most powerful instruments for traders and investors alike. While traditional stock trading involves buying or selling shares, options give you the right—but not the obligation—to buy or sell a stock at a certain price within a certain time. This opens up a wide range of possibilities: from hedging your risks to speculating on market moves with limited capital.
But as exciting as options trading is, it also carries complexity. This detailed guide will explain what options are, how they work, key terminologies, strategies, risks, and how you can practically start trading options in India.
Chapter 1: What Are Options?
An option is a financial contract between two parties—the buyer and the seller.
There are two types of options:
Call Option: Gives the buyer the right to buy the underlying asset at a specified price (strike price) before or on expiry.
Put Option: Gives the buyer the right to sell the underlying asset at a specified price before or on expiry.
Unlike stocks, options do not represent ownership. They are derivatives, meaning their value is derived from the price of an underlying asset (like Nifty 50, Bank Nifty, or Reliance stock).

Part 8 Institutional TradingTable of Contents
Introduction to Options Trading
Structure of the Indian Options Market
Types of Options
Key Terminologies in Options
How Options are Priced
Option Trading Strategies (Basic to Advanced)
Understanding Open Interest and Option Chain
Weekly & Monthly Expiry Trends in India
FII/DII Participation in Options
Role of SEBI, NSE & Regulatory Oversight

News-Based Momentum TradingIntroduction
In the fast-paced world of financial markets, news-based momentum trading stands out as one of the most powerful short-term strategies. It harnesses the psychological impact of breaking news on investor sentiment and exploits it to ride price momentum. Whether it's a corporate earnings surprise, regulatory change, economic announcement, geopolitical conflict, or a CEO scandal — news can move markets in seconds.
This strategy aims to identify such news as early as possible and enter trades aligned with the initial price momentum triggered by the event. The idea is simple: "Buy the good news, sell the bad news", but execution is where mastery lies.
What is News-Based Momentum Trading?
News-Based Momentum Trading is a technical and sentiment-driven approach that relies on real-time news events to create a trading opportunity. When a major piece of news breaks, it often leads to a rapid price reaction. Momentum traders aim to enter the trade in the direction of that reaction, expecting further continuation of price due to:
Herd behavior
Panic or euphoria
Short covering or long liquidation
Delay in information absorption by the wider market
Unlike long-term investing where news is absorbed over time, this strategy thrives on short bursts of volatility and liquidity. The holding period can range from a few minutes to a few days.
Core Principles Behind News-Based Momentum Trading
Price Reacts Faster Than Fundamentals
News affects sentiment before it alters earnings, business models, or valuations.
Price often overshoots fundamentals in the short term due to emotional reactions.
Volume Validates News
Spikes in volume during or after a news event confirm broad market participation.
High volume ensures liquidity for entering/exiting trades efficiently.
Follow the Flow, Not the News
It's not just the content of the news but the market’s reaction to it that matters.
Some negative news gets ignored; some positive news leads to massive rallies. Focus on how price behaves, not how you feel about the news.
Speed and Discipline are Critical
The best trades are often gone in minutes.
Emotional hesitation results in missed or failed trades.
Types of News That Create Momentum
Not all news has the same impact. Here's a breakdown of high-impact categories for momentum trading:
1. Corporate Earnings Announcements
Beats or misses of EPS/revenue estimates
Forward guidance or revision of outlook
Surprise dividend payouts or buyback plans
2. Mergers and Acquisitions (M&A)
Acquisition of a company (target tends to surge, acquirer may dip)
Strategic alliances and joint ventures
De-mergers and spin-offs
3. Regulatory Approvals or Bans
FDA approvals (biotech)
SEBI/RBI policy updates (Indian markets)
Anti-trust decisions or penalties
4. Economic Data Releases
Inflation (CPI, WPI)
GDP numbers
Employment data (e.g., U.S. Non-Farm Payrolls)
RBI/Fed interest rate decisions
5. Geopolitical Events
Wars, sanctions, terrorist attacks
Elections and political transitions
Trade disputes (e.g., U.S.-China trade war)
6. Sector-Specific News
Government incentives (PLI schemes)
Commodity price fluctuations (oil, gold, etc.)
Climate-related events (impacting agriculture, energy)
Tools & Indicators for News-Based Momentum Trading
Though news is the trigger, technical tools help refine entries:
1. Volume Spike Detector
Look for sudden surges in volume
VWAP and OBV (On-Balance Volume) indicators confirm strong participation
2. Moving Averages
9 EMA and 20 EMA help confirm short-term momentum
Price above 20 EMA post-news often signals continuation
3. VWAP (Volume Weighted Average Price)
Great tool for intraday traders
If price holds above VWAP after news, bias is bullish
4. Price Action & Candlestick Patterns
Bullish Marubozu or Engulfing candle post-news
Avoid Doji or indecisive candles immediately after news
Example: News-Based Momentum Trade (Real Case)
Stock: Tata Motors
News: JLR posts record quarterly sales, beats estimates
Initial Reaction: Stock gaps up 4% at open
Volume: Highest in 3 months
Action:
Entry: Break above 2-day high at ₹880
SL: ₹868 (below VWAP and breakout candle low)
Target: ₹910 (Fibonacci extension level)
Result: Stock hit ₹915 within 2 sessions.
Why it worked:
Strong earnings surprise
Sector-wide interest in autos
Clean technical breakout
Risks and Challenges in News-Based Momentum Trading
1. Fakeouts / Whipsaws
Not all news leads to sustained momentum.
Price may reverse after a knee-jerk reaction.
2. Late Entry
Retail traders often enter after the move is already 80% done.
Chasing rallies often leads to losses.
3. Overtrading and Emotion
Frequent news events can tempt traders to overtrade.
Not every piece of news is tradable.
4. Slippage and Gaps
Entry and exit prices may not be ideal due to fast moves.
Pre-market or after-hours news leads to gaps.
5. Fake News / Rumors
Always confirm the source.
Do not trade on unverified social media posts.
GIFT Nifty & SGX Nifty Correlation1. Introduction
The Indian derivatives market has witnessed a historic transformation with the shift of offshore Nifty trading from SGX Nifty (Singapore Exchange) to GIFT Nifty (Gujarat International Finance Tec-City International Financial Services Centre). This move, significant in both strategic and geopolitical terms, was designed to bring liquidity, price discovery, and market influence back to Indian jurisdiction.
The relationship or correlation between GIFT Nifty and SGX Nifty is not just about numbers; it encapsulates the evolution of India’s financial markets, regulatory reforms, and global investor behavior. This guide explains the intricate correlation between the two, contextualized by market structure, trading dynamics, and macro-financial impacts.
2. Background of SGX Nifty
Before GIFT Nifty emerged, SGX Nifty was the go-to platform for global investors to gain exposure to Indian equity markets without being subject to Indian capital controls. Introduced in 2000 by the Singapore Exchange (SGX), SGX Nifty offered Nifty 50 index futures for global investors, especially hedge funds, proprietary traders, and institutional players who wanted to trade Indian indices in USD without directly accessing the NSE (National Stock Exchange) in India.
Key Points:
Cash-settled in USD.
Available for trading ~16 hours a day.
Offered strong liquidity and price discovery overnight.
Heavily used by global institutions for hedging Indian equity exposure.
3. Emergence of GIFT Nifty
GIFT Nifty was launched in 2023 on the NSE International Exchange (NSE IX) at GIFT City (Gujarat International Finance Tec-City) as a replacement for SGX Nifty, aiming to:
Localize Nifty trading.
Bring offshore volumes back to India.
Provide tax-efficient and regulated access to foreign investors.
GIFT Nifty is the sole platform for trading international Nifty derivatives post-transition, and it is denominated in USD, keeping global appeal intact.
4. Timeline: Transition from SGX Nifty to GIFT Nifty
Important Milestones:
2018: NSE terminated its data-sharing agreement with SGX, sparking a legal and market debate.
2019–2021: Regulatory developments and infrastructure improvements at GIFT City.
July 3, 2023: Official transition from SGX Nifty to GIFT Nifty. SGX stopped offering Nifty futures.
GIFT Nifty now operates under NSE IFSC regulations and continues to serve the same investor base with enhanced Indian regulatory control.
5. Structure and Functioning: SGX vs GIFT Nifty
Feature SGX Nifty GIFT Nifty
Exchange Singapore Exchange (SGX) NSE International Exchange (NSE IX)
Currency USD USD
Underlying Index Nifty 50 Nifty 50
Settlement Cash-settled Cash-settled
Regulation MAS (Singapore) IFSCA (India)
Time Zone Singapore Time (SGT) Indian Standard Time (IST)
Taxation Singapore tax regime IFSC-friendly tax structure
While the structure is mostly similar, the jurisdiction and oversight shifted from Singapore to India.
6. Trading Hours Comparison
Exchange Trading Hours (IST)
SGX Nifty (old) 06:30 AM – 11:30 PM IST (approx)
GIFT Nifty 6:30 AM – 3:40 PM (Session 1)
markdown
Copy
Edit
**4:35 PM – 2:45 AM** (Session 2) |
GIFT Nifty provides almost 21 hours of trading — covering both Asian and U.S. market hours, similar to SGX Nifty — ensuring that international investors can continue trading Nifty seamlessly.
7. Price Discovery and Global Influence
SGX Nifty's Role:
SGX Nifty was often viewed as the early indicator for Nifty 50 due to its early start.
It reflected overnight global cues (US, Asian markets).
It had strong influence over NSE opening gaps.
GIFT Nifty's Continuity:
Now assumes SGX Nifty’s role in overnight price discovery.
GIFT Nifty trading between 4:35 PM and 2:45 AM IST captures US and Europe market reactions.
Acts as a lead indicator for Nifty’s direction in the Indian market.
Thus, the correlation pattern of market impact continues, just the platform has shifted.
8. Liquidity and Volume Shifts
Pre-Transition:
SGX Nifty volumes averaged USD 1–1.5 billion/day.
Liquidity was concentrated in Singapore due to ease of access.
Post-Transition:
GIFT Nifty quickly absorbed liquidity, crossing $1 billion in daily turnover within weeks of launch.
Leading global market makers and brokers now operate from GIFT City.
Trading is supported by IFSCA-approved entities and clearing corporations like NSE IFSC Clearing Corporation.
The liquidity correlation was maintained as investors smoothly moved to GIFT Nifty.
9. Institutional Participation and Derivative Strategies
Institutional investors still require Nifty derivatives to hedge equity portfolios.
GIFT Nifty options and futures offer equivalent utility as SGX Nifty did.
Hedge funds, FPIs, global trading desks have migrated their Nifty-linked strategies to GIFT City.
Because GIFT Nifty is cash-settled and USD-denominated, hedging and arbitrage strategies remain unaffected.
Correlation in terms of usage and derivative structuring remains intact.
10. Impact on Indian Traders
Retail Indian traders are not directly impacted because both SGX and GIFT Nifty were/are offshore products.
However, GIFT Nifty can be tracked through price feeds and platforms like NSE IFSC, Refinitiv, Bloomberg, etc.
Indian traders still monitor GIFT Nifty early morning to assess gap-up/gap-down expectations.
So, GIFT Nifty remains a sentiment barometer, just like SGX Nifty was.
Conclusion
The GIFT Nifty-SGX Nifty correlation is best described as a seamless transition of purpose, structure, and function from one platform to another — with jurisdiction and regulatory benefits tilting in India's favor. While SGX Nifty served global investors well for over two decades, GIFT Nifty now fulfills the same role with greater regulatory sovereignty, tax efficiency, and strategic national interest.
Key takeaway:
SGX Nifty and GIFT Nifty are fundamentally correlated in utility and influence — but GIFT Nifty is the future.
Technical Analysis with AI ToolsWhat is Technical Analysis?
Technical Analysis (TA) is the study of price and volume data to forecast future market trends. It assumes that:
Price discounts everything – All information (news, sentiment, fundamentals) is already reflected in the price.
Prices move in trends – Uptrends, downtrends, and sideways trends persist.
History repeats itself – Price patterns and human psychology create repeatable patterns.
Traders use charts, indicators, and patterns like head and shoulders, triangles, trendlines, etc., to make trading decisions.
However, TA has limitations:
Subjectivity in pattern recognition
Reliance on lagging indicators
Difficulty adapting to real-time market shifts
That’s where AI-based tools step in.
💡 What is Artificial Intelligence in Trading?
Artificial Intelligence in trading refers to computer systems that can learn from data, identify patterns, and make trading decisions with minimal human intervention.
The key subfields of AI used in trading include:
Machine Learning (ML): Algorithms that improve through experience (e.g., linear regression, decision trees, neural networks)
Deep Learning (DL): Complex neural networks mimicking the human brain; used for advanced pattern recognition
Natural Language Processing (NLP): Used to analyze news sentiment, earnings reports, and social media
Reinforcement Learning: AI that learns through trial and error in dynamic environments (e.g., Q-learning in trading bots)
When applied to technical analysis, AI processes historical price, volume, and indicator data to detect hidden relationships and optimize trading signals in real time.
🤖 How AI Enhances Technical Analysis
1. Pattern Recognition at Scale
Traditional TA relies on human eyes or predefined rules to identify chart patterns.
AI, particularly deep learning (e.g., CNNs – Convolutional Neural Networks), can scan thousands of charts simultaneously and identify complex patterns (like cup-and-handle or flag patterns) faster and more accurately.
2. Backtesting with Intelligence
AI allows advanced backtesting of strategies using years of tick-by-tick or candle-by-candle data.
Unlike static rules, ML-based strategies can adapt their weights or parameters over time based on the evolving nature of the market.
3. Nonlinear Indicator Relationships
Classic TA uses indicators independently. But markets are nonlinear.
AI models learn nonlinear relationships among multiple indicators and create composite signals that outperform single-indicator strategies.
4. Sentiment-Infused Technical Models
AI tools can combine technical signals with NLP-based sentiment analysis from Twitter, Reddit, or news headlines.
This fusion helps predict breakouts or reversals that aren’t visible in price action alone.
5. Real-Time Decision Making
Traditional TA often suffers from lag.
AI-powered systems like algorithmic trading bots can respond to price movements in milliseconds, executing trades without delay.
🔧 AI Tools and Platforms for Technical Analysis
✅ 1. MetaTrader 5 with Python or MQL5 AI Modules
Integrates technical indicators with custom AI models
Python API allows users to run ML/DL models within MetaTrader
Widely used by forex and commodity traders
✅ 2. TradingView with AI-Based Scripts
Offers Pine Script for strategy development
Developers can integrate AI signals via webhook/API
Visual pattern recognition and crowd-shared AI scripts
✅ 3. QuantConnect / Lean Engine
Open-source algorithmic trading platform
Allows users to train ML models and backtest strategies
Supports data from equities, options, crypto, futures
✅ 4. Kaggle & Google Colab
Ideal for building AI-based technical analysis tools from scratch
You can train models using pandas, scikit-learn, TensorFlow, etc.
Excellent for custom strategies, like classifying candle patterns
✅ 5. Trade Ideas
Proprietary AI engine called “Holly” scans 60+ strategies daily
Uses ML to learn which trades worked yesterday and adjust accordingly
Includes real-time alerts, performance tracking, and automated trading
✅ 6. TrendSpider
AI-powered charting platform
Automatic trendline detection, dynamic Fibonacci levels, heat maps
Smart technical scanning and pattern recognition
🧠 AI Techniques Applied in Technical Analysis
1. Supervised Learning
Used when historical data is labeled with desired outcomes (e.g., up or down after a candle close).
Algorithms: Logistic Regression, Random Forest, Support Vector Machine (SVM)
Use Case: Predict next candle movement based on RSI, MACD, price, etc.
2. Unsupervised Learning
Used for pattern discovery in unlabeled data.
Algorithms: K-means, DBSCAN, Autoencoders
Use Case: Cluster similar stock behavior, detect anomalies, group market conditions
3. Reinforcement Learning
Learns from rewards/punishments in dynamic environments (e.g., financial markets).
Algorithms: Q-learning, Deep Q-Networks (DQN)
Use Case: Train bots to buy/sell based on profit performance in changing conditions
4. Deep Learning
Excellent for modeling time-series data and pattern recognition.
Algorithms: LSTM, GRU, CNN
Use Case: Predict future prices based on sequential price movements
🛠 How to Build an AI-Based Technical Analysis System (Simplified)
Step 1: Data Collection
Historical OHLCV data from sources like Yahoo Finance, Binance, Alpaca
Add technical indicators like RSI, MACD, ATR, etc.
Step 2: Feature Engineering
Normalize or scale features
Create additional features like percentage change, volatility
Step 3: Model Selection
Choose ML/DL models: Random Forest, XGBoost, LSTM
Train with price data labeled as “up”, “down”, or “flat”
Step 4: Backtesting
Simulate how the model would have performed in the past
Use performance metrics like Sharpe ratio, win rate, drawdown
🧾 Conclusion
Technical analysis has entered a new era, powered by Artificial Intelligence. Traders are no longer limited to static indicators or gut feeling. AI tools offer the ability to process vast amounts of data, detect patterns invisible to the human eye, and adapt strategies dynamically.
However, success doesn’t come automatically. To benefit from AI in technical analysis, traders must combine domain knowledge, data science skills, and market intuition. When used responsibly, AI can be an invaluable ally, not a replacement, in your trading journey.
Algo-Based Options Trading & AutomationIn the modern trading landscape, technology is not just a supporting tool—it’s the central force reshaping how markets function. Nowhere is this more visible than in options trading, where algorithmic trading (or “algo trading”) is taking over traditional manual strategies. With increased speed, accuracy, and scalability, automation in options trading is transforming retail and institutional participation alike.
This guide breaks down everything you need to know about algo-based options trading: what it is, how it works, what strategies are used, its pros and cons, and how automation is practically implemented in today's markets.
1. What is Algo-Based Options Trading?
Algo-based options trading involves using computer programs to execute options trades based on pre-defined rules and mathematical models. These programs analyze market data, identify trading signals, and place orders automatically—often much faster and more accurately than humans can.
The key components include:
Predefined logic or strategy (e.g., "Buy a call option when RSI < 30 and price is above 50-DMA")
Real-time market data feed
Execution engines that place and manage orders without manual intervention
Risk management modules to monitor exposure, margin, and stop-losses
2. Why Use Algo Trading in Options Instead of Manual Trading?
Options are complex instruments. Their prices are influenced by multiple variables like time decay, implied volatility, strike price, delta, gamma, and more.
Humans can’t always process this data fast enough, especially during high-volatility events. Here’s where algos shine:
Manual Trading Algo Trading
Emotion-driven Emotionless and consistent
Slower execution Millisecond-level speed
Prone to fatigue Runs 24/7 without breaks
Hard to backtest Easily backtested and optimized
Limited scalability Can manage thousands of trades simultaneously
3. Core Components of an Options Algo Trading System
To build or understand an automated options trading system, it’s essential to know its primary components:
A. Strategy Engine
This is the brain of the system. It defines:
Entry/Exit conditions (based on indicators like RSI, MACD, IV percentile, etc.)
Type of options to trade (call, put, spreads, straddles, etc.)
Timeframe (intraday, weekly, monthly)
Underlying asset and strike price selection logic
B. Data Feed & Market Scanner
Live option chain data from exchanges like NSE or brokers like Zerodha, Upstox
IV, OI, delta, gamma, theta, vega data
Historical data for backtesting
C. Order Management System (OMS)
This handles:
Order placement
Modifications (e.g., SL changes)
Cancel/re-entry logic
Smart order routing (SOR)
D. Risk Management Module
Risk management is critical. The automation should enforce:
Maximum daily loss limits
Exposure per trade
Position sizing based on capital
Portfolio hedging logic
E. Logging and Monitoring
Every trade, price, and action is logged for audit and improvement. Some systems send alerts via Telegram, email, or SMS.
4. Common Algo Strategies Used in Options Trading
1. Delta-Neutral Strategies
Goal: Profit from volatility while maintaining a neutral directional view.
Examples: Straddle, Strangle, Iron Condor
How Algos Help: Adjust delta automatically by hedging with futures or adding more legs
2. Trend Following with Options
Algos can detect breakouts and directional momentum and buy/sell options accordingly.
Example: Buy call when price crosses above 20-DMA and volume spikes
Add-ons: Use trailing SLs, exit when RSI > 70
3. Option Scalping
Used in very short timeframes (1m, 5m candles). Algo enters/exits trades rapidly to capture small moves.
Needs: Super-fast execution and co-location
Popular in: Weekly expiry trading
4. IV-Based Mean Reversion
Buy when Implied Volatility (IV) is abnormally low or sell when it’s high.
Algos monitor: IV percentile, skew, vega exposure
5. Open Interest & Volume Based Strategies
Breakout Strategy: Detect long buildup or short covering using OI change + price movement
Algo filters trades: Where volume > 2x average and OI shows new positions being created
5. Platforms and Tools for Algo Options Trading
Even retail traders can now access automation tools without knowing how to code.
No-Code Platforms:
Tradetron
Streak by Zerodha
AlgoTest
Quantiply
These platforms offer:
Drag-and-drop strategy builders
Live market connections
Backtesting features
Broker integrations
Custom Python/C++ Based Systems
Used by advanced retail or prop firms. These offer:
Full control and flexibility
Integration with APIs like:
Zerodha Kite Connect
Upstox API
Interactive Brokers
Summary and Final Thoughts
Algo-based options trading is not just for hedge funds anymore. With accessible platforms, cloud computing, and APIs, even retail traders can build, test, and deploy automated strategies.
However, success in algo trading depends on:
Solid strategy design (math + market logic)
Risk management above all
Continuous monitoring and iteration
Avoiding over-reliance on backtests
Staying compliant with broker and SEBI norms
Technical Analysis for Modern MarketsIn the ever-evolving world of financial markets, Technical Analysis (TA) has remained one of the most powerful tools used by traders and investors to make informed decisions. From analyzing simple price charts to applying advanced indicators with the help of AI and automation, technical analysis has transformed over the years to suit modern, fast-paced markets.
Whether you are a beginner looking to understand the basics or an experienced trader aiming to sharpen your strategies, this guide covers everything you need to know about Technical Analysis in Modern Markets — in detail, with practical insights, and in simple language.
1. What is Technical Analysis?
Technical Analysis is the study of past market data—primarily price and volume—to forecast future price movements.
In contrast to Fundamental Analysis, which evaluates a stock’s intrinsic value based on financials, management, and industry outlook, Technical Analysis focuses purely on the chart—believing that all information is already reflected in the price.
In today’s markets, TA is used not just for stocks but also for commodities, forex, cryptocurrencies, indices, and even real estate.
2. The Core Assumptions of Technical Analysis
Technical Analysis is built on three core beliefs:
1. The Market Discounts Everything
All known and unknown information (news, earnings, policies, emotions) is already reflected in the stock price.
2. Prices Move in Trends
Prices don’t move randomly—they follow identifiable trends that can persist over time (uptrend, downtrend, or sideways).
3. History Tends to Repeat Itself
Markets are driven by human psychology. Since human behavior often repeats under similar circumstances, price patterns tend to reoccur over time.
3. Key Components of Technical Analysis
### A. Price Charts
Charts are the foundation of TA. The most commonly used are:
Line Chart – Simplest form; connects closing prices.
Bar Chart – Displays open, high, low, and close.
Candlestick Chart – Most popular today; each candle shows open, high, low, close and reflects market sentiment visually.
Why Candlesticks Rule Modern Markets?
Candlesticks are ideal for fast decision-making. Bullish and bearish candlestick patterns (like Doji, Hammer, Engulfing, etc.) reveal trader emotions and potential reversals.
B. Trendlines and Channels
Trendlines: Lines drawn to connect swing highs or lows to identify direction.
Channels: Parallel lines creating a trading range.
They help traders identify support (price floor) and resistance (price ceiling) zones.
C. Support and Resistance
These are zones where prices tend to pause, reverse, or consolidate.
Support: Where buying interest is strong enough to overcome selling pressure.
Resistance: Where selling pressure overcomes buying interest.
These zones become crucial decision points for entry, exit, or reversal trades.
4. Indicators and Oscillators – Modern Trader’s Tools
Technical indicators are mathematical calculations based on price, volume, or open interest. They are divided into:
A. Trend-Following Indicators
1. Moving Averages (MA)
Simple Moving Average (SMA): Average price over a period.
Exponential Moving Average (EMA): Gives more weight to recent data.
Used to identify trends and their strength. A common setup: 50 EMA and 200 EMA crossover (Golden Cross, Death Cross).
2. MACD (Moving Average Convergence Divergence)
Helps traders spot changes in trend momentum and potential reversals.
B. Momentum Indicators
1. RSI (Relative Strength Index)
Measures momentum on a scale of 0 to 100.
RSI above 70 = Overbought; Below 30 = Oversold.
2. Stochastic Oscillator
Compares a stock’s closing price to its range over a certain period. Useful in choppy, range-bound markets.
C. Volatility Indicators
1. Bollinger Bands
Created using a moving average and two standard deviation lines.
Price touching upper band = overbought.
Price touching lower band = oversold.
Bollinger Band squeeze indicates a big move coming (expansion phase).
D. Volume-Based Indicators
1. On-Balance Volume (OBV)
Tracks buying/selling pressure based on volume flow.
2. Volume Profile
Modern tool showing volume at different price levels, not just over time.
5. Chart Patterns – Price Action Signals
Chart patterns are repetitive formations on price charts that indicate potential breakouts or reversals. They are divided into:
A. Reversal Patterns
Head & Shoulders (top = bearish, bottom = bullish)
Double Top/Bottom
Triple Top/Bottom
B. Continuation Patterns
Triangles (Symmetrical, Ascending, Descending)
Flags & Pennants
Cup & Handle
These patterns, if confirmed by volume and breakout, give high-probability trade signals.
Conclusion
Technical Analysis is both an art and a science. It’s not about predicting the future with certainty but about stacking probabilities in your favor. In modern markets flooded with data, volatility, and emotion, TA gives you structure, clarity, and a rules-based approach to decision-making.
Whether you are trading Nifty options, cryptocurrencies, or global stocks, technical analysis empowers you to ride the trend, control risk, and stay disciplined.

Options Trading Strategies (Weekly/Monthly Expiry Focused)In today’s fast-paced financial world, options trading has become a vital part of many traders' toolkits—especially those who focus on weekly or monthly expiry contracts. These expiry-based strategies offer flexibility, potential for quick profits, and can be customized based on market outlook, volatility, and risk appetite.
Whether you're a beginner aiming to earn consistent returns or an experienced trader managing large portfolios, understanding expiry-focused strategies will help you become a more efficient and confident trader.
What Are Weekly and Monthly Expiry Options?
Before we dive into strategies, let’s first clarify:
Weekly Expiry Options: These contracts expire every Thursday (or Wednesday if Thursday is a holiday). Weekly options are available for indices like Nifty, Bank Nifty, and many liquid stocks.
Monthly Expiry Options: These expire on the last Thursday of every month. Monthly options are more traditional and have been around since the inception of options trading.
Both types follow the same structure but differ in time to expiry, premium decay, trading psychology, and risk-reward dynamics.
Why Trade Based on Expiry?
Expiry-based strategies offer unique advantages:
Time Decay (Theta): Premiums erode faster closer to expiry—benefiting option sellers.
Predictable Volatility Patterns: Volatility tends to fall post major events (RBI, Fed, earnings), making short strategies viable.
Quick Capital Turnover: Weekly expiry allows 4–5 trading opportunities in a month.
Defined Risk: You can design strategies where loss is capped (e.g., spreads, iron condors).
Popular Weekly & Monthly Expiry Strategies
Let’s break down some of the most effective strategies used by traders during expiries:
1. Covered Call (Best for Monthly Expiry)
What It Is:
A covered call involves buying the underlying stock and selling a call option against it.
Use Case:
Suitable for investors holding stocks expecting sideways to mildly bullish movement.
Monthly expiry works better due to better premium.
Example:
You own 1 lot (50 shares) of TCS at ₹3500. You sell a monthly ₹3600 call for ₹40 premium.
If TCS stays below ₹3600, you keep the full ₹2000 (₹40 x 50) premium.
Risk/Reward:
Risk: Falls in stock price.
Reward: Limited to premium + upside until strike price.
2. Naked Option Selling (Weekly)
What It Is:
Selling a call or put option without holding the underlying. It’s risky but very popular during weekly expiry, especially on Thursdays.
Use Case:
Traders use it on expiry day for quick theta decay.
Needs strong trend or range view.
Example:
On Thursday, Nifty is at 22,000. You sell 22,200 Call and 21,800 Put, each for ₹10.
If Nifty stays in between, both go to zero—you keep ₹20.
Risk/Reward:
Risk: Unlimited.
Reward: Limited to premium received.
Tip: Always monitor positions or hedge to manage losses.
3. Iron Condor (Weekly/Monthly)
What It Is:
An Iron Condor involves selling OTM Call and Put, and simultaneously buying further OTM Call and Put to limit losses.
Use Case:
Best for range-bound markets.
Weekly iron condors are common in Nifty/Bank Nifty due to fast premium decay.
Example (Weekly Iron Condor):
Nifty spot: 22,000
Sell 22,200 CE and 21,800 PE
Buy 22,300 CE and 21,700 PE
Net credit: ₹40
Max profit = ₹40
Max loss = ₹60 (difference in strike – net credit)
Risk/Reward:
Risk: Capped.
Reward: Capped.
Ideal for non-directional markets.
4. Calendar Spread (Weekly vs Monthly)
What It Is:
You sell a near-term option (weekly) and buy a far expiry option (monthly) on the same strike.
Use Case:
Traders expecting low short-term volatility but high long-term movement.
Volatility plays a crucial role.
Example:
Sell 22,000 CE (weekly) at ₹80
Buy 22,000 CE (monthly) at ₹120
Net debit: ₹40
If Nifty remains around 22,000 till weekly expiry, the short option loses premium quickly.
Risk/Reward:
Risk: Limited to net debit.
Reward: Can be significant if timing is right.
5. Straddle (Monthly/Weekly)
What It Is:
A straddle is buying or selling the same strike price Call and Put.
Types:
Long Straddle: Expecting big move (buy both).
Short Straddle: Expecting low movement (sell both).
Example (Short Weekly Straddle):
Nifty at 22,000
Sell 22,000 CE at ₹60
Sell 22,000 PE at ₹60
Total premium = ₹120
If Nifty closes near 22,000, both decay—you pocket the premium.
Risk/Reward:
Short Straddle Risk: Unlimited.
Long Straddle Risk: Limited to premium paid.
Weekly expiries give better opportunities due to quick decay.
6. Strangle (Weekly Special)
What It Is:
Sell OTM Call and OTM Put (Short Strangle) or buy both (Long Strangle).
Use Case:
Short Strangle is very popular on Thursday.
Use when expecting low volatility.
Example (Short Strangle):
Nifty at 22,000
Sell 22,300 CE and 21,700 PE at ₹20 each
If Nifty expires between 21,700–22,300, both go worthless.
Risk/Reward:
Risk: Unlimited.
Reward: Limited to ₹40.
Tip: Add hedges or monitor closely to avoid slippage on big moves.
✅ Conclusion
Weekly and monthly expiry-focused options strategies can be a goldmine when used smartly. Each strategy has its place—some are built for income, others for momentum or volatility plays. The trick lies in matching the right strategy with market context, expiry timeline, and your risk appetite.
For beginners, start small—paper trade or use small lots. For experienced traders, explore advanced hedged strategies like Iron Condor, Calendar Spread, and Butterflies for consistent profits.
In expiry trading, discipline, risk control, and clear bias are your best tools. Don’t treat expiry days as gambling sessions. Treat them as structured opportunities to benefit from predictable market behavior.
Trading master class with experts ➤ Definition:
Trading is the act of buying and selling financial instruments (like stocks, commodities, currencies, or derivatives) with the intention of making a profit over short to medium timeframes. Traders do not necessarily hold positions for the long term. They react to price movements and market trends.
➤ Core Features of Trading:
Short-Term Focus: Hours to weeks.
Active Management: Constant monitoring of charts, news, and prices.
Profit from Price Movement: Traders capitalize on volatility and momentum.
Risk Management: Stop-loss and position sizing are vital.
Types: Intraday trading, swing trading, scalping, positional trading.
➤ Pros:
Quick returns possible.
Flexibility in strategy.
Can be automated (algo/quant trading).
Capitalize on both bullish and bearish markets.
➤ Cons:
High risk due to leverage and volatility.
Emotionally draining.
Requires high skill and market understanding.
Brokerage, slippage, and taxes eat profits if not careful.

Trade Like a Institutions Trading is the act of buying and selling financial instruments (like stocks, commodities, currencies, or derivatives) with the intention of making a profit over short to medium timeframes. Traders do not necessarily hold positions for the long term. They react to price movements and market trends.
➤ Core Features of Trading:
Short-Term Focus: Hours to weeks.
Active Management: Constant monitoring of charts, news, and prices.
Profit from Price Movement: Traders capitalize on volatility and momentum.
Risk Management: Stop-loss and position sizing are vital.
Types: Intraday trading, swing trading, scalping, positional trading.
➤ Pros:
Quick returns possible.
Flexibility in strategy.
Can be automated (algo/quant trading).
Capitalize on both bullish and bearish markets.
➤ Cons:
High risk due to leverage and volatility.
Emotionally draining.
Requires high skill and market understanding.
Brokerage, slippage, and taxes eat profits if not careful.

Macro Trading / Global Market TrendsIntroduction
In the complex and dynamic world of finance, macro trading has emerged as one of the most influential strategies for investors seeking to profit from large-scale economic shifts. This investment style, deeply rooted in macroeconomic analysis, aims to capitalize on changes in global economic indicators, political developments, central bank policies, and geopolitical events. Macro trading operates across asset classes—equities, bonds, currencies, commodities, and derivatives—enabling investors to position themselves in anticipation of, or in response to, global macroeconomic trends.
In recent decades, the convergence of globalization, technological innovation, and interconnected financial systems has intensified the relevance of macro trading. Understanding the mechanisms and implications of macro trading within the context of global market trends provides not only a strategic edge to investors but also insights into how capital flows influence world economies.
Understanding Macro Trading
1. Definition and Core Principles
Macro trading is a strategy based on the analysis of broad economic and political factors affecting markets on a national or global scale. Traders analyze variables like:
GDP growth
Inflation
Interest rates
Trade balances
Central bank policies
Geopolitical risk
Unlike traditional bottom-up investing, which focuses on company fundamentals, macro trading takes a top-down view—starting from macroeconomic data and drilling down to specific investment opportunities.
2. Instruments and Markets
Macro traders typically operate across a wide range of financial instruments:
Currencies (Forex): Betting on relative strength or weakness of national currencies.
Interest Rate Instruments: Bonds, futures, and swaps linked to changes in rate policies.
Commodities: Energy, metals, agriculture based on global demand/supply and inflation trends.
Equities and Indices: Long or short positions based on sectoral or regional performance.
Derivatives: Options and futures are frequently used for leverage and hedging.
Evolution of Macro Trading
1. Early Origins
Macro trading began to take shape in the 1970s with the collapse of the Bretton Woods system, which introduced floating exchange rates and enabled speculation on currencies. Traders like George Soros and Stanley Druckenmiller gained prominence by making massive profits on macro bets—famously, Soros “broke the Bank of England” by shorting the pound in 1992.
2. Rise of Hedge Funds
The 1980s and 1990s saw the rise of macro-focused hedge funds. Firms like Bridgewater Associates, Moore Capital, and Brevan Howard institutionalized macro investing, managing billions and influencing policy through market signals.
3. Technological and Data Revolution
In the 21st century, real-time data, algorithmic tools, and machine learning have transformed macro trading. Traders now use AI models to parse economic indicators, sentiment, and even satellite imagery to forecast trends.
Macro Trading Strategies
1. Directional Trades
Traders take long or short positions based on anticipated macroeconomic trends. For example:
Long U.S. dollar during tightening cycles
Short Chinese equities amid economic slowdown fears
2. Relative Value Trades
These involve taking offsetting positions in related instruments to exploit discrepancies. Examples:
Long German Bunds, short U.S. Treasuries on divergent rate paths
Long Brazilian Real, short Argentine Peso based on relative macro strength
3. Event-Driven Trades
Profiting from specific events such as:
Elections
Referendums
Central bank meetings
Trade agreement announcements
4. Thematic Investing
Aligning with long-term macro themes such as:
Energy transition (e.g., long clean energy, short fossil fuel producers)
Demographics (e.g., aging populations and healthcare demand)
Technological disruption (e.g., AI and productivity trends)
Conclusion
Macro trading offers an expansive, intellectually challenging, and potentially lucrative approach to investing. By interpreting the movements of economies, governments, and global markets, macro traders can position themselves ahead of systemic shifts. However, the strategy also carries significant risks—from poor timing and model error to sudden geopolitical shocks.
As global market trends evolve—with themes like technological disruption, climate change, and geopolitical realignment—macro trading remains a vital lens through which to understand and navigate financial markets. For investors and policymakers alike, it provides a unique window into the pulse of the global economy and the forces shaping our collective financial future.
Day Trading vs. Swing Trading1. Understanding the Basics
Day Trading
Day trading refers to the buying and selling of financial instruments—such as stocks, options, futures, or currencies—within the same trading day. A day trader closes all positions before the market closes to avoid overnight risk.
Key Features:
No positions held overnight.
Trades last from a few seconds to several hours.
High number of trades per day.
Requires constant monitoring of charts and market movements.
Swing Trading
Swing trading is a medium-term trading strategy that involves holding positions for several days to weeks to capture price “swings” or short-term trends.
Key Features:
Positions held for a few days to a few weeks.
Fewer trades than day trading.
Less screen time required.
Relies on technical and sometimes fundamental analysis.
2. Time Commitment
Day Trading
Day trading is a full-time job. Traders must monitor markets in real-time, react instantly to price movements, and manage trades proactively. It demands:
Quick decision-making.
High focus and attention.
The ability to execute trades at optimal times, sometimes within seconds.
Because of the time sensitivity, most day traders operate during regular market hours (e.g., 9:30 AM to 4:00 PM EST for U.S. stocks).
Swing Trading
Swing trading allows for greater flexibility. Since positions are held over several days, traders do not need to watch the market constantly. Time is mainly spent:
Analyzing charts after market hours.
Setting up trades in advance using limit and stop orders.
Reviewing economic news and fundamental data.
Swing trading can be compatible with part-time or full-time work outside of trading.
3. Strategy and Technical Tools
Day Trading Strategies
Day traders rely on:
Scalping: Very short-term trades to capture small price movements.
Momentum Trading: Capitalizing on stocks moving with high volume.
News-Based Trading: Reacting quickly to economic data or company announcements.
Technical Indicators: Tools like VWAP, RSI, MACD, Bollinger Bands, and moving averages for quick decision-making.
Speed and precision are critical, and traders often use level II quotes and advanced charting tools to gain an edge.
Swing Trading Strategies
Swing traders use:
Trend Following: Riding short-term uptrends or downtrends.
Support and Resistance: Buying near support and selling near resistance.
Technical Breakouts: Entering trades after a price breaks out from a consolidation pattern.
Chart Patterns: Recognizing setups like flags, pennants, head-and-shoulders, etc.
Indicators: RSI, MACD, Fibonacci retracement, and moving averages to confirm setups.
Swing traders focus more on price patterns and market psychology than minute-by-minute movement.
4. Risk and Reward
Day Trading
Risk: High. Rapid price fluctuations can lead to quick losses. The use of leverage increases exposure.
Reward: Potentially high daily returns, but gains are often incremental per trade.
Stop-Losses: Tight stop-losses are used due to small trade windows.
Risk Management: Requires precise entry/exit rules and strict discipline.
Because of frequent trading, day traders also face:
Slippage and commissions (though less of a concern with modern brokerages offering zero commission).
Mental fatigue and the temptation to overtrade.
Swing Trading
Risk: Moderate to high, depending on market conditions.
Reward: Trades aim to capture larger price movements, so the reward per trade is generally higher.
Stop-Losses: Wider stops to account for multi-day price fluctuations.
Risk Management: Requires patience, tolerance for volatility, and a solid trading plan.
Swing traders are vulnerable to overnight gaps, where unexpected news moves the market while it’s closed.
5. Tools and Platforms
Day Traders Need:
High-speed internet.
Direct-access trading platform with low latency.
Real-time news feeds (e.g., Bloomberg, Benzinga).
Advanced charting and order types.
Broker with low commissions and fast execution.
Swing Traders Need:
Reliable charting tools (e.g., TradingView, ThinkOrSwim).
Access to both technical and fundamental data.
Broker that supports extended hours trading.
Alerts and scanners to identify setups.
Swing traders may prioritize platforms with good research tools, while day traders focus on speed and customization.
6. Psychology and Personality Fit
Day Trading Personality:
Thrives under pressure and fast decision-making.
Can handle rapid losses without panic.
Enjoys active involvement and quick feedback.
Highly disciplined with emotional control.
This style is not suitable for those prone to stress, impulsiveness, or emotional reactions.
Swing Trading Personality:
Patient and analytical.
Comfortable holding positions overnight and through small drawdowns.
Able to wait for setups and follow a plan without micromanaging.
Less prone to overtrading.
This style is ideal for people who enjoy structure and can detach from market noise.
AI-Powered Trading & Algorithmic StrategiesIntroduction
The financial markets are dynamic, fast-paced, and data-intensive. For decades, traders have sought technological edges to gain advantage. In recent years, Artificial Intelligence (AI) and Algorithmic Trading have emerged as transformative forces, redefining the way financial instruments are analyzed, traded, and managed. Leveraging machine learning, natural language processing, and real-time data processing, AI-powered trading systems can detect patterns, predict market movements, and execute trades at speeds and volumes that far surpass human capabilities.
1. What is AI-Powered Trading?
AI-powered trading refers to the use of artificial intelligence and machine learning techniques to analyze financial data, identify patterns, generate trading signals, and execute trades. Unlike traditional rule-based algorithmic trading, AI systems can learn from data, adapt to changing market conditions, and optimize performance through self-improvement.
These systems rely on:
Machine Learning (ML): Models learn from historical and real-time data to predict asset prices and volatility.
Natural Language Processing (NLP): AI reads and interprets news, earnings reports, and social media sentiment.
Computer Vision: Occasionally used to interpret satellite images, store foot traffic, etc., for fundamental analysis.
Reinforcement Learning: A type of machine learning where algorithms learn optimal trading strategies by trial and error.
2. What is Algorithmic Trading?
Algorithmic trading involves using computer programs to follow a defined set of instructions (algorithms) to place trades. These instructions are based on timing, price, quantity, and other mathematical models. The goal is to execute orders faster and more efficiently than a human trader could.
Common types of algorithmic trading include:
Trend-following strategies: Based on moving averages or momentum.
Arbitrage strategies: Exploiting price differentials between markets.
Market-making: Providing liquidity by continuously placing buy and sell orders.
Statistical arbitrage: Trading based on mean-reversion and statistical relationships between assets.
3. The Evolution: From Algorithms to AI
Traditional algorithms follow static rules. While effective in structured environments, they struggle when market conditions change or new data types (like social media) come into play. AI, particularly ML, offers dynamic adaptability.
Key Differences
Feature Traditional Algo Trading AI-Powered Trading
Rule Design Manually coded Learned from data
Adaptability Low High
Data Types Quantitative only Quantitative + Unstructured Data
Human Supervision High Moderate to low
Decision-Making Deterministic Probabilistic
4. The Technology Stack
To build an AI-powered trading system, several components are essential:
a) Data Sources
Market Data: Price, volume, order books
Alternative Data: News, social media, satellite images, economic indicators
Historical Data: For backtesting and training models
b) Data Engineering
Data Cleaning: Removing noise, handling missing values
Normalization: Scaling data for model consumption
Feature Engineering: Creating meaningful variables from raw data
c) Machine Learning Models
Supervised Learning: Predicting price direction, classification of market regimes
Unsupervised Learning: Clustering assets, anomaly detection
Deep Learning: For complex patterns in time-series data
Reinforcement Learning: Training agents to optimize cumulative rewards in trading
d) Execution Engine
Order Management System (OMS)
Smart Order Routing
Latency Optimization
e) Risk Management
Real-time Monitoring
VaR (Value at Risk) Calculation
Position Sizing and Stop Loss Algorithms
5. AI-Based Trading Strategies
a) Sentiment Analysis
Using NLP, AI can interpret the tone and content of news articles, social media, and earnings calls. For example, a spike in negative sentiment on Twitter for a company might trigger a short trade.
b) Time-Series Forecasting
ML models like LSTM (Long Short-Term Memory) neural networks can predict future price movements by analyzing historical data patterns.
c) Portfolio Optimization
AI can dynamically rebalance portfolios to maximize return and minimize risk using real-time data.
d) Event-Driven Strategies
AI models can react instantly to earnings announcements, economic releases, or geopolitical news.
e) Arbitrage Detection
Unsupervised learning can help discover hidden arbitrage opportunities across exchanges or correlated assets.
f) Reinforcement Learning Agents
AI agents learn optimal strategies by simulating trades in virtual environments, optimizing reward functions such as Sharpe ratio or profit factor.
6. Real-World Applications
a) Hedge Funds
Firms like Two Sigma, Renaissance Technologies, and Citadel use advanced AI models for statistical arbitrage and high-frequency trading (HFT).
b) Retail Platforms
Apps like Robinhood, QuantConnect, and Kavout offer AI-enhanced features like robo-advisors, trade recommendations, and predictive analytics.
c) Investment Banks
Firms such as JPMorgan and Goldman Sachs use AI for fraud detection, trade execution optimization, and market forecasting.
Conclusion
AI-powered trading and algorithmic strategies represent a paradigm shift in the world of finance. They combine the speed of automation with the adaptability of learning systems, enabling traders to uncover complex patterns, respond rapidly to market events, and manage risk more effectively.
While the benefits are immense, AI trading also comes with challenges—model risk, ethical dilemmas, and regulatory scrutiny. Successful deployment requires not only technological expertise but also robust governance, continuous monitoring, and ethical oversight.
As technology evolves, AI will continue to democratize access to sophisticated trading tools, blur the line between institutional and retail investing, and redefine the competitive landscape of global financial markets. In this fast-moving frontier, those who can harness AI responsibly and innovatively will be best positioned to thrive.
Momentum, Swing & Day Trading StrategiesTrading in financial markets offers a variety of strategies suited to different timeframes, risk appetites, and goals. Among the most popular trading methodologies are Momentum Trading, Swing Trading, and Day Trading. These strategies, while overlapping in some aspects, are distinct in their approach to capitalizing on market opportunities. Each appeals to a particular type of trader and requires different skills, tools, and psychological traits.
This guide provides a deep dive into these three trading styles, helping aspiring traders understand how they work, what tools are needed, and how to determine which might be the best fit for their goals.
1. Momentum Trading
Definition
Momentum trading is a strategy that seeks to capitalize on the strength of existing market trends. Momentum traders aim to buy securities that are moving up and sell them when they show signs of reversing—or go short on securities that are moving down.
The underlying belief is that stocks which are already trending strongly will continue to do so in the short term, as more traders jump on the bandwagon.
Core Principles
Trend Continuation: Assets that exhibit high momentum will likely continue in their direction for a while.
Volume Confirmation: High volume typically confirms the strength of momentum.
Short-term holding: Positions are held for a few minutes to several days.
Relative Strength: Comparing the performance of securities to identify leaders and laggards.
Example Strategy
Identify stocks with high relative volume (5x or more average volume).
Look for breakouts above recent resistance with strong volume.
Enter the trade once confirmation occurs (price closes above resistance).
Use a trailing stop-loss to ride the trend while locking in gains.
2. Swing Trading
Definition
Swing trading involves taking trades that last from a few days to a few weeks in order to capture short- to medium-term gains in a stock (or any financial instrument). Swing traders primarily use technical analysis due to the short-term nature of the trades but may also use fundamental analysis.
This strategy bridges the gap between day trading and long-term investing.
Core Principles
Trend Identification: Traders look for mini-trends within larger trends.
Support & Resistance: Entry and exit points are often based on technical levels.
Risk-to-Reward Ratios: Focus on setups with favorable risk/reward profiles (typically 1:2 or better).
Market Timing: Entry and exit are more strategic and less frequent than day trading.
Example Strategy
Scan for stocks in a clear uptrend or downtrend.
Wait for a pullback to a key moving average or support zone.
Enter on a bullish/bearish reversal candlestick pattern.
Set stop-loss just below support or recent swing low.
Set target profit at next resistance level or use a trailing stop.
3. Day Trading
Definition
Day trading is a strategy that involves buying and selling financial instruments within the same trading day. Traders aim to exploit intraday price movements and typically close all positions before the market closes to avoid overnight risks.
This strategy demands intense focus, fast decision-making, and a strong grasp of technical analysis.
Core Principles
Speed: Executing trades rapidly and precisely.
Volume & Liquidity: Only liquid assets are traded to ensure quick execution.
Leverage: Often used to increase potential profits (and losses).
Volatility: The more a stock moves, the better for day trading.
Example Setup
Identify a high-volume stock with a news catalyst.
Wait for an opening range breakout.
Enter long/short based on breakout with tight stop-loss.
Set profit targets based on support/resistance or risk-reward ratio.
Tools Commonly Used Across All Strategies
Regardless of the strategy, traders typically use the following tools:
Charting Platforms: TradingView, ThinkorSwim, MetaTrader, NinjaTrader.
Screeners: Finviz, Trade Ideas, MarketSmith.
News Feed Services: Benzinga Pro, Bloomberg, CNBC, Twitter/X.
Brokerage Platforms: Interactive Brokers, TD Ameritrade, E*TRADE, Fidelity.
Risk Management Software: Used to calculate position sizing, stop losses.
Risk Management: The Cornerstone of All Strategies
No matter the strategy, risk management is essential. Key practices include:
Position Sizing: Never risk more than 1–2% of capital per trade.
Stop-Loss Orders: Automatically exits a losing trade at a predefined level.
Risk-Reward Ratio: Most successful traders seek at least a 1:2 ratio.
Diversification: Avoid overexposing to one sector or asset.
Conclusion: Which Strategy is Right for You?
Choosing the right trading strategy depends on your:
Time availability: Can you watch the markets all day?
Capital: Can you meet margin and liquidity requirements?
Personality: Are you calm under pressure, or do you prefer slower decision-making?
Experience level: Some strategies are more forgiving and suitable for beginners.
Market Drivers: Trade Policy, Inflation, SpeculationFinancial markets are influenced by a wide array of forces—ranging from fundamental economic indicators to investor psychology. Among the most impactful and multifaceted market drivers are trade policy, inflation, and speculation. These elements can significantly sway the direction of asset prices, influence macroeconomic stability, and affect the broader global economic system.
I. Trade Policy as a Market Driver
A. Definition and Components
Trade policy refers to a country’s laws and strategies that govern international trade. It encompasses:
Tariffs: Taxes imposed on imported goods.
Quotas: Limits on the amount of a particular product that can be imported or exported.
Trade agreements: Bilateral or multilateral treaties that establish trade rules.
Subsidies and protections: Government support for domestic industries.
These measures are designed to either protect domestic industries or promote international trade, often balancing between nationalist and globalist economic perspectives.
B. Mechanisms of Influence
Trade policy impacts markets in several ways:
Cost Structures: Tariffs increase the cost of imported goods, which can impact company profits and consumer prices.
Supply Chains: Restrictions or incentives can alter how and where companies source their goods.
Investment Flows: Favorable trade policies can attract foreign direct investment (FDI), while protectionist policies might repel it.
Currency Valuation: Trade deficits or surpluses influenced by policy can strengthen or weaken a nation's currency.
II. Inflation as a Market Driver
A. Understanding Inflation
Inflation refers to the general increase in prices over time, eroding purchasing power. It is typically measured by indices such as:
Consumer Price Index (CPI)
Producer Price Index (PPI)
Personal Consumption Expenditures (PCE)
Inflation arises from various sources, commonly categorized as:
Demand-pull inflation: Too much money chasing too few goods.
Cost-push inflation: Rising costs of production inputs.
Built-in inflation: Wage-price spirals based on inflation expectations.
B. How Inflation Influences Markets
1. Interest Rates
Inflation directly impacts interest rate policy. Central banks, particularly the Federal Reserve in the U.S., adjust rates to control inflation. When inflation rises, central banks typically raise interest rates to cool demand and vice versa.
Market Reaction:
Bonds: Prices fall when interest rates rise because older bonds yield less than new ones.
Stocks: Generally suffer when inflation rises due to higher costs and tighter monetary policy.
Real Estate: Can benefit initially (due to higher asset values), but higher mortgage rates can dampen long-term demand.
2. Currency Value
A country experiencing high inflation will often see its currency depreciate. Investors demand higher yields to hold assets denominated in that currency, and purchasing power diminishes.
3. Commodities and Precious Metals
Gold, silver, and other commodities often rise in value during inflationary periods, serving as hedges against currency debasement.
III. Speculation as a Market Driver
A. What is Speculation?
Speculation involves trading financial instruments with the aim of profiting from short-term fluctuations rather than long-term value. While investing relies on fundamentals, speculation often relies on technical indicators, market psychology, and trends.
Speculators are prevalent in all markets: equities, forex, commodities, derivatives, and crypto-assets.
B. Types of Speculators
Retail Speculators: Individual traders using platforms like Robinhood or eToro.
Institutional Traders: Hedge funds, proprietary trading desks.
Algorithmic/Quant Traders: Firms using mathematical models and AI.
IV. Interplay Between Trade Policy, Inflation, and Speculation
While each driver can operate independently, they often interact in complex and reinforcing ways:
A. Trade Policy → Inflation
Protectionist policies (e.g., tariffs on steel or semiconductors) can raise input costs, contributing to inflationary pressure. Conversely, liberalized trade can reduce costs and enhance price stability through global competition.
B. Inflation → Speculation
Periods of low interest rates and high inflation can drive speculation as real returns on traditional savings erode. Investors seek higher yields in riskier assets like tech stocks or cryptocurrencies.
Example: The post-2020 environment of ultra-low interest rates and rising inflation led to massive speculative flows into growth stocks and digital assets.
V. Conclusion
Trade policy, inflation, and speculation are cornerstone forces shaping the modern financial landscape. Their impacts permeate across asset classes, economic sectors, and even political realms.
Trade policy can shift competitive advantages, trigger geopolitical tensions, and reshape supply chains.
Inflation, while a natural economic phenomenon, can destabilize markets if poorly managed.
Speculation, though vital for liquidity and efficiency, carries risks of distortion and systemic crises.
In an interconnected world, no market driver operates in isolation. Understanding their mechanisms, implications, and relationships is essential for investors, policymakers, and analysts alike.
As markets evolve, particularly with the rise of digital finance, global trade realignment, and new inflationary paradigms, these drivers will remain at the forefront of both opportunity and risk.

ZOMATO: All set for 40% upside potential⚡️Price Analysis:
1️⃣ Price broke the resistance.
2️⃣ Price structure is bullish.
3️⃣ Price trading above EMAs
4️⃣ Strong candle formation.
✨ Key Observations:
➡️ RRR favourable at CMP.
➡️ Price should continue the upside momentum
➡️ Retest can be a good zone for further accumulation.
⚠️ Disclaimer: This is NOT a buy/sell recommendation. This post is meant for learning purposes only. Views are personal. Please, do your due diligence before investing.⚠️
💬 Share your thoughts in the comments below! ✌️
🔥Trade Safe!✅🚀
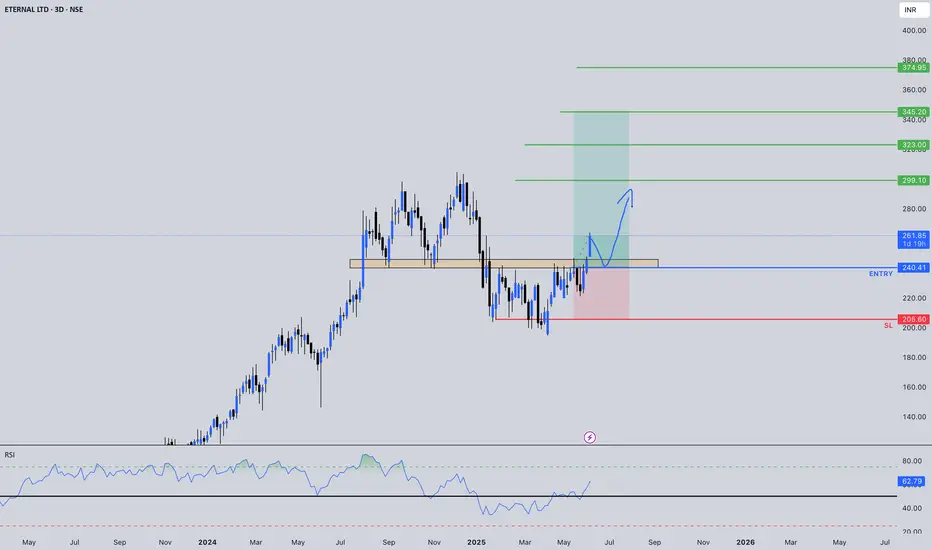
The Market SentimentPCR (Put-Call Ratio) – The Market Sentiment Radar
✅ What is PCR?
PCR stands for Put-Call Ratio, a popular sentiment indicator in the options market. It tells you whether traders are buying more puts (bearish bets) or more calls (bullish bets).
What is IV?
Implied Volatility (IV) is the market’s forecast of how volatile a stock or index might be in the future. It doesn’t tell direction, but only how fast or wild the moves could be.
✅ How does IV affect option prices?
Higher IV = Higher Option Premiums
Lower IV = Lower Option Premiums
Think of IV as the “air” in a balloon. More air (IV) = bigger premium (balloon).
✅ Why IV is Crucial:
Entry Timing: You want to buy options when IV is low (cheap premiums).
Exit Strategy: You want to sell options when IV is high (expensive premiums).
IV spikes before big events – like earnings, RBI policy, Budget, Fed meetings, etc.
✅ Example:
You buy a Nifty 20000 CE when IV is 14%. Then IV jumps to 22% even if price doesn’t move much.
Your option gains value because of IV expansion (called Vega Gain).
✅ IV vs HV:
IV: What market expects.
HV (Historical Volatility): What already happened.
When IV > HV = Overpriced Options.
When IV < HV = Underpriced Options.
VIX (Volatility Index) – The Fear Gauge of India
✅ What is VIX?
VIX is the Volatility Index, often called the "Fear Index". In India, we use India VIX, which measures expected volatility of Nifty 50 over the next 30 days.
✅ How is VIX calculated?
India VIX is derived from the option prices of Nifty 50 – mainly ATM (At-The-Money) options. It reflects market’s fear level or confidence.
✅ Interpretation:
VIX < 12 → Calm, low volatility (complacent market)
VIX 12–18 → Normal volatility
VIX > 20 → High fear, high volatility
🔁 VIX is inversely correlated with Nifty:
VIX rises → Nifty tends to fall
VIX falls → Nifty tends to rise
✅ Smart Usage of VIX:
Options Selling: When VIX is high, sell far OTM options (premium decay faster).
Options Buying: When VIX is low, buy options expecting breakout or event-driven moves.
Event Hedge: Spike in VIX signals market is anticipating big movement – ideal for straddle/strangle trades.
✅ Real Market Scenario:
During Budget day or unexpected geopolitical news, VIX may shoot up from 13 to 22 in a day.
Smart traders pre-position strangles or reduce exposure when VIX hits extremes.
🔷 Putting It All Together – Mastery Strategy
Let’s combine PCR, IV, and VIX for smart institutional-level setups.
🔹 1. PCR + VIX Confluence
PCR High + VIX High = Too much fear → Possible market bottom → Buy signal
PCR Low + VIX Low = Overconfidence → Possible correction → Sell signal
🔹 2. IV Crush Trade
Before event (high IV) → Sell options → Capture premium decay post-event
After event (low IV) → Buy directional options → Lower premium, better RR
🔹 3. Directional Bet with PCR + IV
Rising PCR + Rising IV = Building bearish pressure → Bearish bias
Falling PCR + Falling IV = Bullish optimism → Bullish bias

BTCUSD 1D TimeframeBitcoin is trading near $117,800 – $118,400
It’s in a sideways consolidation zone after a strong uptrend
📊 Technical Summary
📈 Trend Direction:
Primary Trend: Bullish (long-term)
Short-Term Trend: Sideways to slightly bullish
Structure: Higher highs and higher lows still intact
🔍 Key Support & Resistance Levels
🟢 Support Zones:
$117,000 — Immediate support zone
$115,000 — Minor demand zone
$112,000 — Key swing low support
$108,000 – $110,000 — Strong base if correction deepens
🔴 Resistance Zones:
$119,000 — Current price ceiling
$121,000 — Breakout target
$123,000 – $125,000 — All-time high resistance area
🧠 Indicators Overview
📌 RSI (Relative Strength Index):
Around 58–60
Shows moderate bullishness — not overbought
📌 MACD (Moving Average Convergence Divergence):
MACD line above signal line, but momentum is weakening
Indicates potential slowing of bullish push
📌 Moving Averages:
20-day EMA: Below price — short-term support
50-day EMA: Also below — confirms mid-term uptrend
200-day EMA: Far below — strong long-term bullish signal
🕯️ Candlestick Behavior
Recent candles are small-bodied: suggests indecision
Wicks both sides: market waiting for next trigger
No bearish reversal patterns visible yet

Technical Analysis vs Fundamental AnalysisWhat’s the Difference?
When people analyze stocks or any tradable asset, they usually follow one of two main approaches: Technical Analysis or Fundamental Analysis. Each one is like using a different lens to look at the same object. Both methods try to answer the same question:
“Should I buy, sell, or avoid this stock?”
But how they arrive at that answer is completely different.
1️⃣ What is Technical Analysis?
Technical Analysis is all about reading charts. It’s based on the belief that everything that affects a stock's price is already reflected in the stock price itself.
So instead of reading about a company's earnings or business strategy, technical analysts look at price movements, trading volumes, and patterns on charts to try to guess what might happen next.
How It Works:
Technical traders believe that history repeats itself.
Price moves in trends — up, down, or sideways.
Patterns like flags, triangles, and head-and-shoulders are seen as hints.
Indicators like RSI (Relative Strength Index), MACD (Moving Average Convergence Divergence), and moving averages are used to make decisions.
Key Concepts in Technical Analysis:
Candlestick Patterns: These show how the price moved in a given time — whether buyers or sellers were in control.
Support & Resistance: Support is a price level where a stock tends to stop falling. Resistance is where it often stops rising.
Volume: Helps you understand the strength behind a price movement.
Breakouts & Reversals: Important signals that indicate possible trend changes.
Real-Life Example:
Let’s say Stock A is trading at ₹500. It has bounced from this price three times before. That level becomes a support. If it suddenly jumps above ₹550 with high volume, that could be seen as a breakout, and a trader might enter a short-term position.
Pros of Technical Analysis:
Helpful for short-term trading like intraday or swing trades.
Fast decision-making based on visual cues.
Doesn’t require knowledge of a company’s financials.
Can be used across all asset classes (stocks, forex, commodities, crypto).
Cons of Technical Analysis:
It doesn’t look at what the company actually does.
False signals can mislead.
It works on probability — not certainty.
Can be overwhelming with too many indicators.
2️⃣ What is Fundamental Analysis?
Fundamental Analysis is like doing background research on a company before deciding whether to invest in it. Instead of looking at charts, you look at the company’s financial health, industry conditions, economic trends, and management quality.
The main goal is to find the true value (intrinsic value) of a stock and compare it with the current market price.
How It Works:
If the intrinsic value is more than the market price, the stock is considered undervalued and worth buying.
If the market price is more than the intrinsic value, it’s seen as overvalued, and better to avoid or sell.
Key Tools of Fundamental Analysis:
Financial Reports: Balance Sheet, Income Statement, Cash Flow Statement.
Ratios: PE (Price-to-Earnings), ROE (Return on Equity), Debt-to-Equity, EPS (Earnings Per Share).
Company's Business Model: What the company does, how it earns, and whether it's sustainable.
Management Quality: Experience and vision of the leadership.
Industry & Economy: Is the industry growing? Are economic conditions favorable?
Pros of Fundamental Analysis:
Ideal for long-term investment.
Helps understand the actual business you’re putting money into.
Less affected by short-term volatility.
Encourages rational decision-making.
Cons of Fundamental Analysis:
Takes time and effort to study.
May not tell you when exactly to buy or sell.
Requires understanding of finance, economics, and accounting.
Stock may stay undervalued for a long time despite good fundamentals.
✅ Which One Should You Choose?
It all depends on your personality, goals, and time commitment.
Go for Technical Analysis if:
You’re active and want to trade daily or weekly.
You like working with patterns and visuals.
You want to time your entry and exit precisely.
You are okay with taking risks for quick gains.
Go for Fundamental Analysis if:
You think long-term and want to build wealth.
You want to invest in solid companies.
You have patience and a stable mindset.
You prefer logic and numbers over charts.
⚖️ Can You Combine Both?
Yes, and that’s what many experienced market participants do.
This combined approach is called techno-fundamental analysis.
For example:
You use fundamentals to select a good company.
You use technicals to find the right entry point.
This way, you get the best of both worlds.
🧠 Final Thought
There’s no universal rule that says one method is always better. It’s all about what suits your style and objective.
If you’re building a portfolio for retirement or wealth over 10+ years, fundamental analysis is your friend.
If you want to trade actively and spot market opportunities daily or weekly, technical analysis is the way to go.
Over time, learning both will make you a more flexible and better-informed market participant.
NIFTY 1D TimeframeClosing Price: 24,837.00
Net Change: −225.10 points (−0.90%)
Opening: 24,981.35
High: 25,008.90
Low: 24,770.85
Trend: Bearish
📊 Technical Overview
✅ Candle Type:
Bearish candle formed with a long body and small wicks.
Indicates strong selling pressure throughout the day.
🔻 Support Zones:
24,750 – Immediate support (tested on 25 July)
24,600 – Stronger support zone
24,400 – Medium-term support from early July
🔺 Resistance Zones:
24,900 – Immediate resistance
25,000 – Psychological resistance
25,150–25,300 – Strong resistance zone
📈 Indicators Summary:
RSI: Likely near 45 – showing weakening momentum
MACD: Bearish crossover continues – indicating downward trend
Volume: Slightly higher than average – confirms active selling
🧠 Market Sentiment:
Sentiment remains cautious and bearish.
Selling seen in major sectors like Auto, Energy, FMCG, and Banking.
Only Pharma showed relative strength.
Global cues and foreign investor selling weighed on market sentiment.
This marks the fourth straight weekly loss for the Nifty index.
✅ Conclusion:
Nifty is in a short-term downtrend, unable to sustain above 25,000.
If 24,750 is broken decisively, the next target could be 24,600 or lower.
Bulls must reclaim and hold above 25,000–25,150 to reverse the sentiment.