Introduction to Stock Markets1. What is a Stock Market?
At its core, a stock market is a marketplace where buyers and sellers trade shares of publicly listed companies. A share represents a unit of ownership in a company, meaning that if you own a share, you essentially own a part of that company.
Stock markets serve multiple functions:
Raising Capital: Companies issue shares to raise funds for expansion, research, or debt repayment.
Liquidity: They allow investors to buy and sell shares easily.
Price Discovery: They determine the market value of companies based on supply and demand.
Investment Opportunities: They provide avenues for individuals and institutions to grow their wealth.
Two primary types of stock markets exist:
Primary Market: Where companies issue new shares through an Initial Public Offering (IPO) to raise capital.
Secondary Market: Where existing shares are traded among investors. Examples include the New York Stock Exchange (NYSE), NASDAQ, and India’s National Stock Exchange (NSE) and Bombay Stock Exchange (BSE).
2. History and Evolution of Stock Markets
The concept of stock markets dates back to the 17th century. The first organized stock exchange, the Amsterdam Stock Exchange, was established in 1602 for trading shares of the Dutch East India Company. Over time, stock markets spread globally, evolving into sophisticated institutions with advanced trading systems, regulations, and digital platforms.
Key milestones in stock market history include:
1792: The Buttonwood Agreement in New York, which marked the start of the NYSE.
1971: NASDAQ introduced electronic trading, revolutionizing speed and accessibility.
1990s: Introduction of online trading platforms, making markets accessible to retail investors.
3. Importance of Stock Markets
Stock markets are critical for both individual investors and the overall economy.
3.1 Economic Growth
Companies raise capital through stock issuance to expand operations, hire employees, and innovate.
Capital formation fuels industrial growth, increasing productivity and GDP.
3.2 Wealth Creation
Long-term investment in equities historically outperforms other asset classes like bonds or savings accounts.
Compound growth in stock investments allows individuals to accumulate substantial wealth over time.
3.3 Price Transparency
Stock markets provide real-time pricing based on supply and demand, reflecting the true value of companies.
Transparent markets reduce information asymmetry and promote investor confidence.
3.4 Corporate Governance
Listed companies must comply with regulatory norms and disclose financial information, ensuring accountability.
Shareholders gain a voice in company decisions through voting rights.
4. Types of Stocks
Stocks are not uniform. They vary based on ownership, risk, and returns. Common types include:
4.1 Common Stocks
Represent ownership in a company with voting rights.
Returns come in the form of dividends and capital appreciation.
4.2 Preferred Stocks
Offer fixed dividends but limited voting rights.
Generally less volatile than common stocks.
4.3 Growth vs. Value Stocks
Growth Stocks: Companies expected to grow faster than the market average. Returns are mostly capital gains.
Value Stocks: Companies trading below their intrinsic value, often providing steady dividends.
4.4 Blue-Chip Stocks
Large, financially stable companies with strong performance histories.
Example: Reliance Industries, Apple, Microsoft.
5. How the Stock Market Works
The stock market operates on the principles of supply and demand. Prices rise when demand exceeds supply and fall when supply exceeds demand.
5.1 Market Participants
Retail Investors: Individuals trading for personal wealth creation.
Institutional Investors: Banks, mutual funds, hedge funds trading in large volumes.
Traders: Short-term participants aiming to profit from price movements.
Market Makers: Entities that ensure liquidity by buying and selling securities.
5.2 Stock Exchanges
A stock exchange is a regulated platform where stocks are bought and sold.
Examples include NYSE, NASDAQ, NSE, and BSE.
Exchanges maintain transparency, liquidity, and security of transactions.
5.3 Trading Process
Placing an Order: Investors place buy/sell orders through brokers.
Matching Orders: Exchanges match buy and sell orders based on price and time priority.
Settlement: Transfer of ownership and funds between buyer and seller, usually within 2–3 days.
6. Factors Affecting Stock Prices
Stock prices fluctuate constantly. Factors include:
Company Performance: Revenue, profits, and management quality influence investor sentiment.
Economic Indicators: GDP growth, inflation, and unemployment rates impact markets.
Market Sentiment: Investor psychology, fear, and greed can cause volatility.
Global Events: Wars, pandemics, and geopolitical tensions affect prices.
Interest Rates: Higher rates can reduce investment in equities.
7. Stock Market Indices
A stock market index measures the performance of a group of stocks. Examples:
Nifty 50 (India): Represents 50 large companies listed on NSE.
Sensex (India): Comprises 30 leading BSE-listed companies.
S&P 500 (USA): Tracks 500 major US companies.
Indices provide a snapshot of market trends and investor sentiment.
8. Investment Strategies
Investors use various strategies to achieve their financial goals.
8.1 Long-Term Investing
Focused on wealth creation over years.
Often involves buying and holding blue-chip or growth stocks.
8.2 Trading
Short-term buying and selling to profit from price fluctuations.
Types include day trading, swing trading, and momentum trading.
8.3 Value Investing
Buying undervalued stocks based on fundamental analysis.
Popularized by Warren Buffett.
8.4 Growth Investing
Focused on companies with high growth potential.
Prioritizes capital gains over dividends.
9. Risks in the Stock Market
Investing in stocks involves risk. Common risks include:
Market Risk: Overall market movements affect stock prices.
Company Risk: Poor management or declining performance can lead to losses.
Liquidity Risk: Difficulty in selling stocks without affecting price.
Interest Rate Risk: Rising rates may reduce stock prices.
Inflation Risk: High inflation can erode real returns.
Risk management strategies, such as diversification and stop-loss orders, are crucial.
10. Regulatory Framework
Stock markets are heavily regulated to protect investors and maintain stability. Key regulatory bodies include:
SEBI (India): Securities and Exchange Board of India.
SEC (USA): Securities and Exchange Commission.
FCA (UK): Financial Conduct Authority.
These organizations enforce rules on listing, trading, disclosures, insider trading, and investor protection.
Conclusion
The stock market is a powerful tool for wealth creation, economic growth, and corporate financing. Understanding its structure, functions, and risks is essential for any investor. While markets can be volatile and unpredictable, disciplined investing, research, and risk management can make the stock market a reliable avenue for achieving financial goals.
Investing in stocks is not just about money—it’s about knowledge, patience, and strategic decision-making. By embracing these principles, anyone can navigate the stock market successfully, turning it into a lifelong tool for financial empowerment.
Zomato
Basics of Technical Analysis1. Philosophy Behind Technical Analysis
The foundation of technical analysis is based on three key assumptions:
a. Market Discounts Everything
This principle states that all known information—economic, political, and psychological—is already reflected in the current price of a security. Prices react immediately to news and events, so there is no need to analyze each piece of information individually. For example, if a company reports a better-than-expected quarterly result, its stock price will immediately adjust to reflect this news.
b. Prices Move in Trends
Technical analysts believe that prices follow trends, whether upward (bullish), downward (bearish), or sideways (consolidation). Recognizing these trends is crucial because “the trend is your friend.” Traders aim to align their trades with the prevailing trend rather than against it.
c. History Tends to Repeat Itself
Human psychology drives market behavior, and patterns of fear, greed, and optimism often repeat over time. Technical analysis relies on identifying these recurring patterns to predict potential price movements.
2. Core Components of Technical Analysis
Technical analysis consists of several tools and techniques. Understanding these fundamentals is essential for building an effective trading strategy.
a. Price Charts
Price charts are the most basic tool for technical analysts. They visually display the historical price movements of a security over time.
Line Chart: Shows a simple line connecting closing prices over time. Useful for spotting long-term trends.
Bar Chart: Displays open, high, low, and close (OHLC) for each period. Useful for analyzing volatility.
Candlestick Chart: Uses colored bars (candles) to indicate price movement. Highly popular due to its visual clarity and ability to display market sentiment.
Example of a Candlestick
Bullish Candle: Close is higher than open, indicating buying pressure.
Bearish Candle: Close is lower than open, showing selling pressure.
b. Support and Resistance
These are price levels where buying or selling pressure tends to prevent further movement.
Support: A level where demand exceeds supply, preventing the price from falling further.
Resistance: A level where supply exceeds demand, preventing the price from rising further.
Traders watch these levels to make entry and exit decisions. A breakout above resistance signals potential bullish momentum, while a breakdown below support indicates bearish momentum.
c. Trendlines and Channels
Trendlines connect price highs or lows to define the direction of the market. Channels are formed by drawing parallel lines above and below the trendline.
Uptrend: Higher highs and higher lows.
Downtrend: Lower highs and lower lows.
Sideways Trend: Prices fluctuate within a horizontal range.
Channels help traders identify potential reversal points or continuation of trends.
d. Technical Indicators
Indicators are mathematical calculations based on price, volume, or both. They help confirm trends, measure momentum, and identify potential reversals.
Popular Indicators:
Moving Averages: Smooth out price data to identify trends.
Simple Moving Average (SMA)
Exponential Moving Average (EMA)
Relative Strength Index (RSI): Measures the speed and change of price movements. Values above 70 indicate overbought conditions; below 30 indicate oversold.
MACD (Moving Average Convergence Divergence): Shows the relationship between two moving averages. Helps identify trend changes and momentum.
Bollinger Bands: Measure volatility by plotting upper and lower bands around a moving average. Prices touching the bands often signal potential reversals.
e. Volume Analysis
Volume indicates the number of shares or contracts traded in a given period. It confirms the strength of a trend:
Rising price with increasing volume → strong trend
Rising price with decreasing volume → weak trend, potential reversal
Falling price with increasing volume → strong bearish trend
Volume is often analyzed alongside price patterns to validate breakouts or breakdowns.
f. Chart Patterns
Chart patterns are formations created by price movements. They signal potential continuation or reversal of trends.
Common Patterns:
Head and Shoulders: Trend reversal pattern.
Double Top and Double Bottom: Indicate potential reversals.
Triangles (Ascending, Descending, Symmetrical): Represent consolidation before breakout.
Flags and Pennants: Short-term continuation patterns.
These patterns help traders predict the market’s next move based on historical price behavior.
g. Candlestick Patterns
Candlestick patterns provide insight into market sentiment over a short period.
Doji: Indicates indecision.
Hammer: Bullish reversal at the bottom of a downtrend.
Shooting Star: Bearish reversal at the top of an uptrend.
Engulfing Patterns: Strong reversal signals.
By combining candlestick patterns with support/resistance and indicators, traders enhance their decision-making accuracy.
3. Timeframes in Technical Analysis
Technical analysis can be applied across various timeframes:
Intraday: 1-minute, 5-minute, 15-minute charts.
Short-Term: Daily or weekly charts.
Long-Term: Monthly or yearly charts.
Traders choose timeframes based on their strategy:
Day Traders: Focus on intraday charts for quick trades.
Swing Traders: Use daily or weekly charts for holding positions for days or weeks.
Investors: Rely on long-term charts for position trades.
4. Combining Technical Tools
A single tool rarely provides a perfect trading signal. Successful technical analysis combines multiple tools:
Trend Identification: Determine if the market is trending or ranging.
Support/Resistance: Identify key price levels for entry or exit.
Indicators: Confirm momentum, strength, and potential reversals.
Volume Analysis: Validate the trend or breakout.
Patterns: Spot opportunities using chart or candlestick formations.
For example, a trader may buy a stock when the price breaks above a resistance level, the RSI is rising but not overbought, and the breakout is accompanied by high volume.
5. Risk Management in Technical Analysis
Even the best technical analysis cannot guarantee profits. Risk management ensures traders protect their capital.
Stop-Loss Orders: Automatically exit losing trades at a predetermined level.
Position Sizing: Adjust trade size according to risk tolerance.
Risk-Reward Ratio: Ensure potential reward is higher than potential risk (e.g., 2:1 ratio).
Diversification: Avoid concentrating all trades in one instrument or sector.
Proper risk management is critical for long-term trading success.
6. Psychological Aspect
Markets are influenced by human emotions—fear, greed, hope, and panic. Technical analysis helps traders remain objective:
Follow predefined rules for entry and exit.
Avoid trading based on emotions or news hype.
Stick to trend direction and signals.
Emotional discipline combined with technical tools improves consistency.
7. Limitations of Technical Analysis
While technical analysis is powerful, it has limitations:
No Fundamental Insight: Ignores company performance, earnings, and economic factors.
Subjectivity: Interpretation of charts and patterns can vary between analysts.
False Signals: Breakouts or reversals can fail.
Market Manipulation: Large participants can influence price temporarily.
Traders often combine technical and fundamental analysis to mitigate these limitations.
8. Practical Application: How to Start
Choose a Market: Stocks, commodities, Forex, or cryptocurrencies.
Pick a Charting Platform: TradingView, Zerodha Kite, MetaTrader, etc.
Learn Price Patterns and Indicators: Begin with support/resistance, trendlines, and moving averages.
Paper Trade: Practice without risking real money.
Develop a Strategy: Include entry/exit rules, stop-loss, and position sizing.
Analyze Performance: Keep a trading journal to track successes and failures.
9. Advanced Concepts
After mastering the basics, traders can explore:
Fibonacci Retracement: Identify potential reversal levels.
Elliott Wave Theory: Predict market cycles using waves.
Market Profile & Volume Profile: Advanced volume-based analysis.
Algorithmic Trading: Automated execution using technical indicators.
10. Summary
Technical analysis is a toolkit that allows traders to forecast market movements based on price and volume data. Its foundation lies in understanding trends, support/resistance, chart patterns, and indicators, combined with disciplined risk management and psychological control. While it does not guarantee success, a structured approach increases the probability of making profitable trades.
By consistently applying technical analysis, traders can:
Identify opportunities in trending and range-bound markets.
Time entries and exits effectively.
Minimize losses through disciplined risk management.
Improve confidence in trading decisions.

Fundamental Analysis in Trading1. Introduction to Fundamental Analysis
Fundamental analysis is based on the principle that a stock or asset has a true intrinsic value. The market price can often deviate from this intrinsic value due to short-term sentiment, speculation, or market inefficiencies. By analyzing the underlying factors that drive a company’s performance, traders can determine whether a stock is undervalued, overvalued, or fairly priced.
1.1 Difference Between Fundamental and Technical Analysis
Fundamental Analysis (FA): Focuses on why a stock should rise or fall over the long term. Considers financial statements, economic conditions, and industry trends.
Technical Analysis (TA): Focuses on how a stock moves in the short term. Uses charts, patterns, and indicators to predict price movements.
While TA is more suited for short-term traders, FA is preferred by long-term investors or swing traders who want to understand the real value of an asset.
2. Key Components of Fundamental Analysis
Fundamental analysis can be divided into microeconomic and macroeconomic factors.
2.1 Microeconomic Factors
These relate to the company or asset itself, including:
Financial statements: Balance Sheet, Income Statement, and Cash Flow Statement.
Management quality: Experience, track record, and corporate governance.
Products and services: Market demand, competitive edge, and innovation.
Competitive position: Market share, brand strength, and barriers to entry.
Profitability and growth potential: Revenue growth, margins, and scalability.
2.2 Macroeconomic Factors
These relate to the broader economy, affecting all companies in a sector or region:
GDP growth: Indicates overall economic health.
Interest rates: Affect borrowing costs and investment attractiveness.
Inflation: Influences consumer spending and company costs.
Exchange rates: Important for companies with international operations.
Political stability and regulations: Impact business operations and investor confidence.
3. Financial Statements and Their Importance
Financial statements are the core of fundamental analysis. They provide quantitative data about a company’s performance and financial health.
3.1 Income Statement
The income statement (profit and loss statement) shows a company’s revenue, expenses, and profit over a period.
Revenue (Sales): Total income from products/services.
Cost of Goods Sold (COGS): Direct costs of production.
Gross Profit: Revenue minus COGS.
Operating Expenses: Marketing, salaries, R&D.
Net Income: Profit after all expenses and taxes.
Example:
A company with growing revenue and net income over 5 years indicates strong operational performance.
3.2 Balance Sheet
The balance sheet provides a snapshot of a company’s assets, liabilities, and equity at a point in time.
Assets: Resources the company owns (cash, inventory, equipment).
Liabilities: Debts or obligations (loans, accounts payable).
Equity: Owners’ stake in the company (Assets − Liabilities).
Example:
High cash reserves and low debt often indicate a financially stable company.
3.3 Cash Flow Statement
This statement tracks cash inflows and outflows in three categories:
Operating Activities: Cash from core business operations.
Investing Activities: Cash spent or earned on assets and investments.
Financing Activities: Cash from loans, dividends, or share issuance.
Example:
A company may report profits but have negative cash flow, signaling potential liquidity issues.
4. Key Financial Metrics for Analysis
Several ratios and metrics help traders interpret financial statements:
4.1 Profitability Ratios
Gross Margin: Gross Profit ÷ Revenue × 100
Indicates how efficiently a company produces goods.
Net Margin: Net Income ÷ Revenue × 100
Shows overall profitability.
Return on Equity (ROE): Net Income ÷ Shareholders’ Equity
Measures how effectively shareholders’ money generates profit.
4.2 Liquidity Ratios
Current Ratio: Current Assets ÷ Current Liabilities
Shows short-term debt-paying ability.
Quick Ratio: (Current Assets − Inventory) ÷ Current Liabilities
More stringent liquidity check.
4.3 Debt Ratios
Debt-to-Equity (D/E): Total Debt ÷ Shareholders’ Equity
Measures financial leverage.
Interest Coverage Ratio: EBIT ÷ Interest Expense
Assesses ability to pay interest.
4.4 Efficiency Ratios
Inventory Turnover: COGS ÷ Average Inventory
Indicates how quickly inventory sells.
Receivables Turnover: Net Credit Sales ÷ Average Accounts Receivable
Shows efficiency in collecting payments.
5. Valuation Methods
After analyzing financial health, the next step is valuation, which estimates the stock’s intrinsic value.
5.1 Discounted Cash Flow (DCF)
DCF estimates the present value of future cash flows:
Project future cash flows.
Discount them using a required rate of return.
Sum the discounted cash flows to get intrinsic value.
Insight: If DCF value > market price → undervalued; if DCF < market price → overvalued.
5.2 Price-to-Earnings (P/E) Ratio
P/E ratio = Market Price ÷ Earnings per Share (EPS)
High P/E → Market expects growth, or stock is overvalued.
Low P/E → Potential undervaluation, or growth concerns.
5.3 Price-to-Book (P/B) Ratio
P/B ratio = Market Price ÷ Book Value per Share
Useful for asset-heavy industries.
Low P/B can indicate undervaluation.
5.4 Dividend Discount Model (DDM)
DDM values companies based on future dividends:
Estimate future dividends.
Discount them to present value.
Suitable for stable dividend-paying companies.
5.5 Other Ratios
EV/EBITDA: Enterprise Value ÷ Earnings Before Interest, Taxes, Depreciation, and Amortization.
PEG Ratio: P/E ÷ Earnings Growth Rate, adjusts for growth expectations.
6. Industry and Sector Analysis
Analyzing a company in isolation is not enough. Industry and sector trends can significantly affect performance.
Growth Industry: Fast-growing sectors like technology may justify high valuations.
Mature Industry: Slower growth sectors may offer stability and dividends.
Competitive Landscape: Number of competitors, entry barriers, and pricing power.
Cyclical vs Non-Cyclical: Cyclical industries (automobiles, real estate) follow the economy, while non-cyclical (food, healthcare) remain stable.
Example:
During an economic boom, cyclicals may outperform, whereas during recessions, defensive stocks are preferred.
7. Economic and Market Factors
Fundamental analysis also incorporates macroeconomic indicators:
7.1 GDP Growth
Strong GDP growth generally supports corporate profits and stock market performance.
7.2 Inflation
High inflation increases costs, potentially squeezing margins.
7.3 Interest Rates
Rising rates increase borrowing costs and reduce spending. Conversely, lower rates stimulate growth.
7.4 Currency Fluctuations
Important for exporters/importers, affecting revenue and costs.
7.5 Political and Regulatory Environment
Government policies, taxes, and regulations can significantly impact profitability and risk.
8. Qualitative Analysis
Numbers alone are not enough. Qualitative factors help complete the picture:
Management Quality: Leadership vision, integrity, and experience.
Brand Strength: Customer loyalty and reputation.
Innovation & R&D: Ability to stay ahead of competition.
Corporate Governance: Ethical practices, transparency, and accountability.
Example:
Two companies with similar financials may differ in future prospects based on leadership quality and innovation.
9. Steps to Apply Fundamental Analysis in Trading
Define your objective: Long-term investment vs short-term swing trading.
Select the company: Choose based on industry preference or market trends.
Collect financial data: Annual reports, quarterly statements, and filings.
Analyze financials: Use ratios, margins, and cash flow statements.
Perform valuation: Apply DCF, P/E, P/B, or other methods.
Assess macro factors: Consider economic, political, and market conditions.
Check qualitative factors: Leadership, brand, innovation, and governance.
Compare with peers: Relative valuation within the industry.
Make a decision: Buy, hold, or avoid based on intrinsic value vs market price.
10. Advantages of Fundamental Analysis
Provides a deep understanding of a company’s true value.
Helps in identifying long-term investment opportunities.
Reduces reliance on market sentiment and short-term volatility.
Useful for risk management by identifying financially weak companies.
Can identify undervalued stocks with potential for growth.
Conclusion
Fundamental analysis is a cornerstone of intelligent investing. By combining financial metrics, qualitative evaluation, and macroeconomic understanding, traders can make informed decisions that go beyond market noise. While it requires patience and diligence, FA provides a roadmap for sustainable investment and risk management.
When applied carefully, it helps traders identify undervalued stocks, avoid risky bets, and build a portfolio with long-term growth potential. Remember, in trading, knowledge is power, and fundamental analysis gives you the power to see beyond the price chart.
Candlestick Patterns Explained1. Introduction to Candlestick Patterns
1.1 What is a Candlestick?
A candlestick is a type of chart used to represent the price movement of an asset over a specific time period. Unlike traditional line charts that show only closing prices, candlestick charts display four crucial pieces of information:
Open price (O): The price at which the asset starts trading during the time frame.
Close price (C): The price at which the asset finishes trading.
High price (H): The highest price reached during the time frame.
Low price (L): The lowest price reached during the time frame.
Each candlestick consists of:
Body: The rectangular area between the open and close prices. A filled body (often red or black) represents a close lower than the open (bearish), while an empty or green body represents a close higher than the open (bullish).
Wicks/Shadows: The thin lines extending from the body, representing the high and low prices.
1.2 Why Candlestick Patterns Matter
Candlestick patterns reflect the psychology of the market. They show whether buyers or sellers are in control and help traders anticipate potential price movements. Patterns can indicate:
Trend continuation: The market is likely to keep moving in the same direction.
Trend reversal: The market may change direction soon.
Indecision: Neither buyers nor sellers have a clear advantage.
2. Types of Candlestick Patterns
Candlestick patterns are broadly categorized into two types:
Single-Candle Patterns: Formed by one candle, often signaling immediate market sentiment.
Multiple-Candle Patterns: Formed by two or more candles, providing stronger confirmation of trend direction or reversals.
3. Single-Candle Patterns
3.1 Doji
A Doji occurs when the open and close prices are almost equal, forming a very small body with long wicks. It signals market indecision and potential reversal.
Types of Doji:
Standard Doji: Open ≈ Close, wicks vary.
Long-Legged Doji: Long upper and lower shadows; extreme indecision.
Dragonfly Doji: Long lower shadow, little or no upper shadow; potential bullish reversal.
Gravestone Doji: Long upper shadow, little or no lower shadow; potential bearish reversal.
Example: After a strong uptrend, a Gravestone Doji may indicate the buyers are losing momentum.
3.2 Hammer and Hanging Man
Both have small bodies and long lower shadows, but their implications differ based on trend:
Hammer (Bullish Reversal): Appears after a downtrend. Shows that sellers pushed the price down, but buyers regained control.
Hanging Man (Bearish Reversal): Appears after an uptrend. Indicates sellers testing the market and potential reversal.
Tip: Always confirm with the next candle or technical indicators.
3.3 Shooting Star and Inverted Hammer
These are the opposite of Hammer and Hanging Man:
Shooting Star (Bearish Reversal): Appears after an uptrend, small body with long upper shadow. Indicates buyers tried to push prices up but failed.
Inverted Hammer (Bullish Reversal): Appears after a downtrend, small body with long upper shadow. Suggests buyers may be gaining control.
3.4 Spinning Top
A small body with long shadows on both sides. Reflects market indecision and weak trend momentum. Spinning tops often precede trend reversals if confirmed by the next candle.
4. Multiple-Candle Patterns
4.1 Engulfing Patterns
Engulfing patterns occur when one candle completely engulfs the previous candle's body, signaling strong momentum.
Bullish Engulfing: Appears after a downtrend. A large green candle engulfs a small red candle. Indicates buyers taking control.
Bearish Engulfing: Appears after an uptrend. A large red candle engulfs a small green candle. Indicates sellers gaining strength.
4.2 Harami Patterns
A Harami consists of a large candle followed by a smaller candle within the body of the first. It signals trend reversal or indecision.
Bullish Harami: Appears after a downtrend, small green candle within large red candle. Suggests buyers are entering.
Bearish Harami: Appears after an uptrend, small red candle within large green candle. Suggests selling pressure.
4.3 Tweezer Tops and Bottoms
Tweezer patterns are formed when two candles have equal highs or lows:
Tweezer Top (Bearish): Appears after an uptrend, equal highs indicate resistance.
Tweezer Bottom (Bullish): Appears after a downtrend, equal lows indicate support.
4.4 Morning Star and Evening Star
Three-candle reversal patterns:
Morning Star (Bullish Reversal): Downtrend → small-bodied candle → strong bullish candle. Indicates trend reversal upward.
Evening Star (Bearish Reversal): Uptrend → small-bodied candle → strong bearish candle. Indicates trend reversal downward.
4.5 Three White Soldiers and Three Black Crows
Strong trend continuation patterns:
Three White Soldiers (Bullish): Three consecutive green candles with higher closes, following a downtrend. Strong bullish signal.
Three Black Crows (Bearish): Three consecutive red candles with lower closes, following an uptrend. Strong bearish signal.
5. Candlestick Patterns in Trend Analysis
Candlestick patterns are more effective when combined with trend analysis:
Uptrend: Look for bullish patterns (Hammer, Bullish Engulfing, Morning Star).
Downtrend: Look for bearish patterns (Shooting Star, Bearish Engulfing, Evening Star).
Sideways Market: Look for indecision patterns (Doji, Spinning Top).
Tip: Patterns are not guarantees; they indicate probabilities. Always confirm with volume, support/resistance, or technical indicators like RSI, MACD, or moving averages.
6. Practical Trading Tips Using Candlestick Patterns
Confirm Patterns: Never trade based solely on one candlestick. Wait for confirmation from the next candle or trend indicators.
Combine with Support & Resistance: Candlestick patterns near key levels are more reliable.
Volume Matters: Patterns accompanied by high volume indicate stronger conviction.
Risk Management: Set stop-losses slightly beyond the wick extremes to protect against false signals.
Time Frames: Patterns work across all timeframes, but longer timeframes (daily/weekly) generally provide more reliable signals.
7. Common Mistakes Traders Make
Ignoring trend context: Trading reversal patterns against strong trends can lead to losses.
Over-relying on a single candle: Patterns should be confirmed with other indicators.
Misinterpreting Dojis or Spinning Tops: Context and location in the trend are critical.
Neglecting risk management: Even the strongest patterns can fail.
8. Summary
Candlestick patterns are a powerful tool for traders when used correctly. They visually depict market psychology and help forecast potential price movements. Key takeaways:
Single-Candle Patterns indicate immediate sentiment (Hammer, Doji, Shooting Star).
Multiple-Candle Patterns provide stronger signals (Engulfing, Morning Star, Three Soldiers).
Trend Confirmation increases reliability.
Support, Resistance, Volume, and Indicators enhance accuracy.
With practice, traders can read market sentiment quickly and make more informed decisions. Candlestick analysis is not a standalone solution but a vital part of a comprehensive trading strategy.
Part 1 Candlestick PatternPractical Examples
Example 1: Bullish Trade
Buy 1 call of Stock A at ₹100 strike, premium ₹5.
Stock rises to ₹120.
Profit = (120 – 100) – 5 = ₹15 per share.
Example 2: Bearish Trade
Buy 1 put of Stock B at ₹150 strike, premium ₹8.
Stock falls to ₹130.
Profit = (150 – 130) – 8 = ₹12 per share.
Example 3: Covered Call
Own Stock C at ₹200.
Sell call at ₹220, premium ₹5.
Stock rises to ₹230.
Profit = (220 – 200) + 5 = ₹25 (missed extra ₹10).
Protection against small drops due to premium received.
Advantages of Options
Limited risk for buyers
Leverage potential
Flexibility in strategy
Hedging capabilities
Profit from multiple market directions

Trading Master Class With ExpertsRisk and Reward in Options
Options provide defined risk for buyers and potential risk for sellers:
Buyers: Maximum loss = premium paid, profit = theoretically unlimited for calls, limited for puts.
Sellers (writers): Maximum profit = premium received, risk = potentially unlimited for uncovered calls, high for puts.
Example:
Selling a call without owning the stock (naked call) can lead to unlimited losses if the stock skyrockets.
Buying a put limits risk but can still profit from sharp downward moves.
Hedging with Options
Options are a powerful tool for hedging investments:
Protective Put: Buying a put on a stock you own protects against a decline.
Collar Strategy: Buy a put and sell a call to limit both upside and downside risk.
Portfolio Insurance: Large investors use index options to protect portfolios during market volatility.

Part 6 Learn Institutional Trading Black-Scholes Model
A widely used formula to calculate option prices using:
Stock price
Strike price
Time to expiry
Volatility
Risk-free interest rate
Greeks
Delta: Measures sensitivity of option price to underlying price changes.
Gamma: Measures delta’s rate of change.
Theta: Measures time decay of option.
Vega: Measures sensitivity to volatility.
Rho: Measures sensitivity to interest rates.
Understanding Greeks is critical for managing risk and strategy adjustments.

Part 2 Ride The Big MovesDisadvantages of Options
Complexity for beginners
Time decay risk (premium can vanish)
Unlimited risk for sellers of uncovered options
Requires active monitoring for effective trading
Tips for Successful Options Trading
Understand the underlying asset thoroughly.
Start with basic strategies like long calls, puts, and covered calls.
Use proper risk management and position sizing.
Keep track of Greeks to understand sensitivity.
Avoid over-leveraging.
Monitor market volatility; high volatility can inflate premiums.
Use demo accounts or paper trading for practice.

Part 1 Ride The Big Moves Options trading is one of the most versatile tools in financial markets, allowing traders and investors to hedge risk, generate income, and speculate on price movements. While options can seem complex at first, understanding their structure, types, and strategies can make them an invaluable part of your trading toolkit.
What Are Options?
An option is a financial contract that gives the holder the right, but not the obligation, to buy or sell an underlying asset (like stocks, indices, or commodities) at a predetermined price within a specific period. Unlike futures or stocks, options provide flexibility and limited risk.
There are two main types of options:
Call Option: Gives the buyer the right to buy the underlying asset at a predetermined price (strike price) before or on the expiration date.
Put Option: Gives the buyer the right to sell the underlying asset at the strike price before or on expiration.
Key terms to understand:
Underlying Asset: The stock, index, commodity, or currency on which the option is based.
Strike Price: The price at which the option can be exercised.
Premium: The price paid to buy the option.
Expiration Date: The date on which the option expires.
In-the-Money (ITM): Options with intrinsic value (profitable if exercised now).
Out-of-the-Money (OTM): Options without intrinsic value (currently unprofitable).
At-the-Money (ATM): Option strike price equals the underlying asset price.

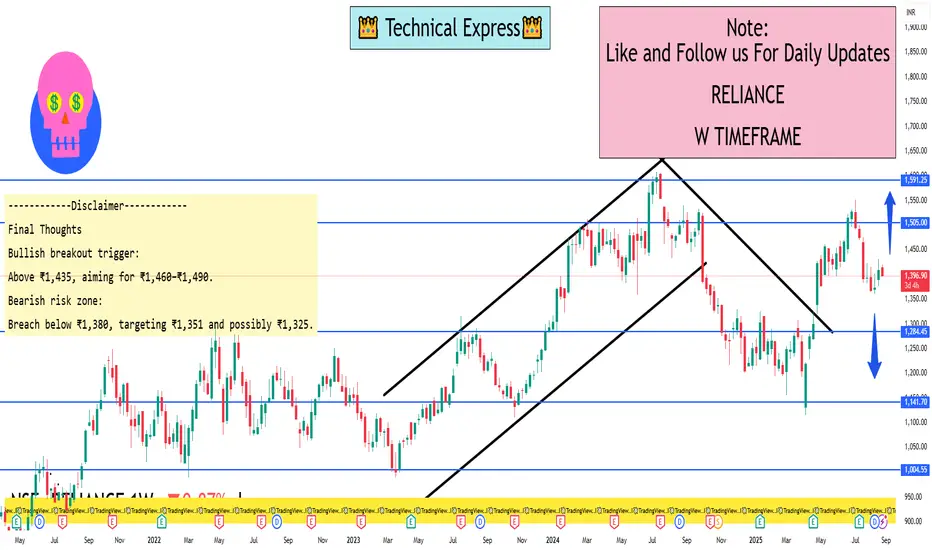
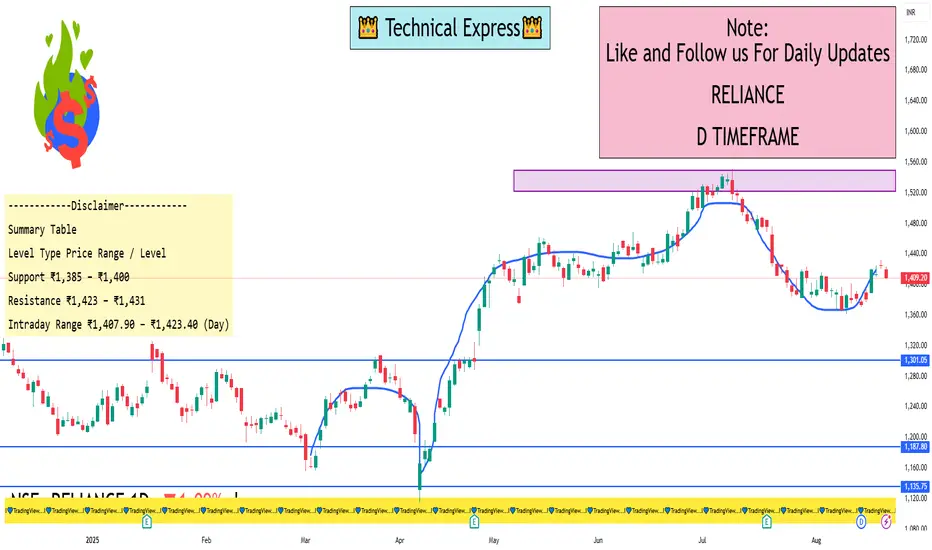
Reliance Industries 1 Week ViewWeekly Pivot & Key Levels (via TopStockResearch)
Weekly Pivot: ₹1,406.03
Support Levels:
• S1: ₹1,380.17
• S2: ₹1,351.13
• S3: ₹1,325.27
Resistance Levels:
• R1: ₹1,435.07
• R2: ₹1,460.93
• R3: ₹1,489.97
Central Pivot Range (CPR): Bottom: ₹1,404.45 | Centre: ₹1,406.03 | Top: ₹1,407.62
Weekly Outlook Summary (via EquityPandit)
Immediate Support: ₹1,380.17
Major Support (if price breaks down): ₹1,351.13
Immediate Resistance: ₹1,435.07
Major Resistance (on breakout): ₹1,460.93
Full Trading Range Expectation: ₹1,325.27 – ₹1,489.97
Additional Chart-Based Technical Insights
TradingView Community (Weekly timeframe): Indicates a key support zone at ₹1,385–1,400. On the daily timeframe, there’s a short-term support channel around ₹1,400–1,410.
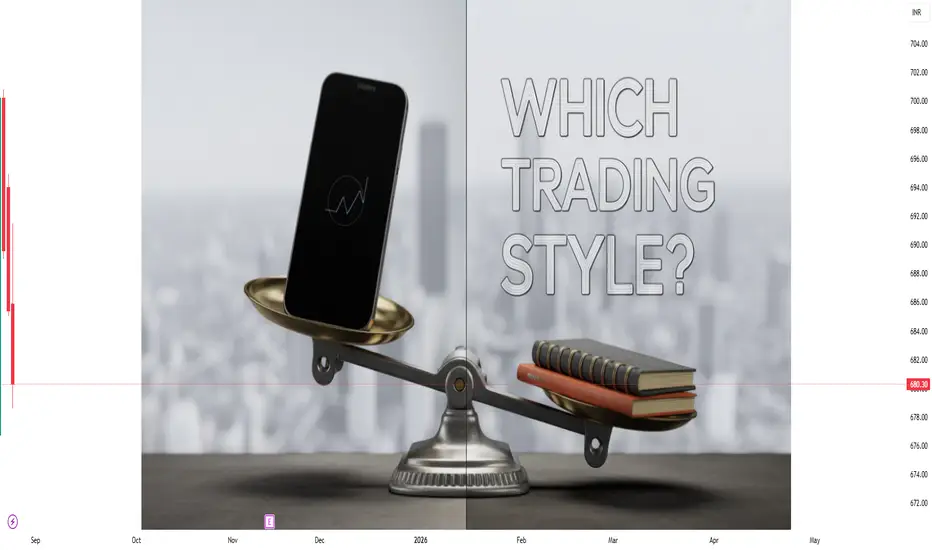
Day Trading vs Swing TradingIntroduction
Trading in the stock market comes in different shapes and sizes. Some traders like to enter and exit positions within minutes or hours, while others prefer to hold them for a few days or even weeks. Two of the most popular trading styles that fall in between short-term speculation and long-term investing are Day Trading and Swing Trading.
Both styles aim to profit from price movements, but the way they operate, the mindset they require, and the strategies they use are different. Understanding these differences is crucial before deciding which one suits you.
This guide will explain in detail:
What day trading is
What swing trading is
Their pros and cons
The skills required
Tools and strategies for both
Real-life examples
Psychological differences
Which style may be right for you
By the end, you’ll have a clear, practical understanding of Day Trading vs Swing Trading, and you’ll know how to choose based on your own lifestyle, risk tolerance, and personality.
What is Day Trading?
Day trading is the practice of buying and selling financial instruments—stocks, futures, forex, or options—within the same trading day. The goal is to capture short-term price fluctuations.
Timeframe: Minutes to hours (never overnight).
Holding period: Seconds, minutes, or a few hours.
Objective: Profit from intraday volatility.
Key characteristic: No position is carried overnight.
For example:
A trader buys Reliance Industries at ₹2,600 in the morning and sells it at ₹2,630 within two hours.
Another trader shorts Nifty Futures at 21,500 and covers at 21,350 within the same session.
Both trades are intraday.
Characteristics of Day Trading
High frequency of trades – Multiple trades in a single day.
Leverage use – Brokers often allow higher intraday margin.
Quick decisions – Requires monitoring charts and news constantly.
Focus on liquidity – Day traders choose highly liquid stocks for quick entries/exits.
Dependence on volatility – Profits come from short-term price swings.
What is Swing Trading?
Swing trading is about holding positions for several days to weeks to capture medium-term price movements. Swing traders don’t care about intraday noise but focus on larger trends.
Timeframe: Days to weeks.
Holding period: 2–20 days (sometimes longer).
Objective: Profit from multi-day moves in price.
Key characteristic: Positions are carried overnight and sometimes through weekends.
For example:
A swing trader buys HDFC Bank at ₹1,500 and sells it at ₹1,650 over the next 10 trading sessions.
Another spots a breakout in Infosys at ₹1,400 and holds for three weeks until it reaches ₹1,600.
Characteristics of Swing Trading
Fewer trades – Maybe 1–3 trades per week.
Moderate leverage – Lower than day trading.
More relaxed pace – No need to stare at charts all day.
Focus on trend continuation – Uses chart patterns, moving averages, or fundamentals.
Exposure to overnight risk – News events can gap the stock against your position.
Skills Required
Skills for Day Trading
Discipline – To follow strict stop-loss rules.
Chart-reading – Ability to read intraday patterns like flags, breakouts, and VWAP.
Risk control – Never risk more than 1–2% per trade.
Emotional control – Resist greed and fear.
Speed – Quick decision-making and execution.
Skills for Swing Trading
Patience – Trades may take days to play out.
Trend identification – Using moving averages, support/resistance.
Position sizing – Managing overnight risk.
Fundamental awareness – Earnings results, economic events.
Adaptability – Adjusting to new market conditions.
Pros and Cons
Pros of Day Trading
Quick results (profit/loss is known the same day).
No overnight risk.
Can take advantage of leverage.
Multiple opportunities daily.
Cons of Day Trading
High stress and pressure.
Requires full-time attention.
Higher transaction costs.
Easy to lose big money without discipline.
Pros of Swing Trading
Less stressful (don’t need to watch markets all day).
Can be done part-time.
Larger profit per trade.
Fits better with trends.
Cons of Swing Trading
Exposed to overnight gaps/news.
Requires patience.
Fewer trades (profits take longer to realize).
Need wider stop-losses.
Example Scenarios
Day Trading Example
Suppose Nifty opens at 21,500.
A day trader notices a breakout at 21,550 and buys futures.
Within 30 minutes, Nifty rises to 21,650.
He books 100 points profit and exits.
Done for the day.
Swing Trading Example
Infosys is consolidating at ₹1,400.
A swing trader notices a bullish breakout above resistance.
He buys at ₹1,420 and holds for 2 weeks.
The stock rallies to ₹1,600.
He sells, pocketing 180 points.
Both traders made money, but one in minutes, the other in weeks.
Psychology in Day vs Swing Trading
Day Trading Psychology
Requires handling adrenaline rush.
Must overcome fear of missing out (FOMO).
Emotional discipline is key because losses can happen quickly.
Often attracts people who like fast action.
Swing Trading Psychology
Requires patience and conviction.
Must handle overnight anxiety (news can move prices sharply).
Avoids overtrading and compulsive action.
Suits people who prefer a calmer pace.
Conclusion
Both Day Trading and Swing Trading have their place in the trading world. Day trading is like sprinting—fast, intense, and high-energy. Swing trading is like middle-distance running—steady, patient, and rewarding if done right.
Neither is “better” universally; the right style depends on your personality, time availability, risk tolerance, and financial goals.
Some traders even combine both—doing day trades on volatile days and swing trades when a strong trend forms.
The golden rule is: Don’t copy others blindly. Choose the trading style that matches your lifestyle and mindset.
Part 2 Trading Master Class With ExpertsOptions in Indian Markets
In India, options are traded on NSE and BSE, primarily on:
Index Options: Nifty, Bank Nifty (most liquid).
Stock Options: Reliance, TCS, Infosys, etc.
Weekly Expiry: Every Thursday (Nifty/Bank Nifty).
Lot Sizes: Fixed by exchanges (e.g., Nifty = 50 units).
Practical Example – Nifty Options Trade
Scenario:
Nifty at 20,000.
You expect big movement after RBI policy.
Strategy: Buy straddle (20,000 call + 20,000 put).
Cost = ₹200 (call) + ₹180 (put) = ₹380 × 50 = ₹19,000.
If Nifty moves to 20,800 → Call worth ₹800, Put worthless. Profit = ₹21,000.
If Nifty stays at 20,000 → Both expire worthless. Loss = ₹19,000.

Futures Trading ExplainedIntroduction
Futures trading is one of the most powerful financial instruments in the world of investing and trading. Unlike traditional stock buying where you own a piece of a company, futures are derivative contracts that allow you to speculate on the price movement of commodities, currencies, indices, and financial assets without owning them directly.
The futures market plays a crucial role in global finance by providing price discovery, risk management (hedging), and speculative opportunities. From farmers locking in prices for crops to institutional traders speculating on crude oil, futures are everywhere in the financial ecosystem.
In this guide, we’ll explore futures trading in detail, covering everything from the basics to advanced strategies, with real-world examples.
1. What are Futures?
A futures contract is a legally binding agreement to buy or sell an underlying asset at a predetermined price at a specific time in the future.
Key points:
Underlying asset: The thing being traded (wheat, crude oil, gold, stock index, currency, etc.).
Standardized contract: The size, quality, and delivery date are pre-defined by the exchange.
Leverage: Traders can control large positions with small capital (margin).
Cash-settled or physical delivery: Some futures end with cash settlement, others with delivery of the actual asset.
For example:
A wheat farmer agrees to sell 1000 bushels of wheat at $7 per bushel for delivery in 3 months. The buyer agrees to purchase it. Regardless of where the price goes, both are bound to the contract terms.
2. History and Evolution of Futures
Futures are not new – they date back centuries.
Japan (1700s): The Dojima Rice Exchange in Osaka is considered the birthplace of futures. Rice merchants used contracts to stabilize income.
Chicago Board of Trade (1848): Modern futures trading started in the U.S. with grain contracts.
20th Century: Expansion into metals, livestock, and energy.
Late 20th to 21st Century: Financial futures (currencies, indices, interest rates) became dominant.
Today, futures are traded worldwide on major exchanges like CME (Chicago Mercantile Exchange), ICE (Intercontinental Exchange), and NSE (National Stock Exchange of India).
3. Futures vs. Other Instruments
To understand futures better, let’s compare them with other markets:
Futures vs. Stocks
Stocks = Ownership of a company.
Futures = Contract to trade an asset, no ownership.
Stocks are unleveraged by default; futures use leverage.
Futures vs. Options
Options = Right but not obligation.
Futures = Obligation for both buyer and seller.
Options limit risk (premium paid); futures have unlimited risk.
Futures vs. Forwards
Forwards = Customized, private contracts (OTC).
Futures = Standardized, exchange-traded, regulated.
4. How Futures Trading Works
Let’s break down the mechanics:
a) Contract Specifications
Every futures contract specifies:
Underlying asset (Gold, Nifty index, Crude oil, etc.)
Contract size (e.g., 100 barrels of oil)
Expiration date (e.g., March 2025 contract)
Tick size (minimum price movement)
Settlement type (cash/physical)
b) Margin and Leverage
Traders don’t pay full value; they post margin (a percentage, usually 5–15%).
Example: 1 crude oil futures contract = 100 barrels. If price = $80, contract value = $8,000. Margin required may be $800. You control $8,000 with just $800.
c) Mark-to-Market (MTM)
Futures are settled daily. Profits and losses are adjusted every day.
If your trade is in profit, money is credited; if in loss, debited.
d) Long and Short Positions
Long = Buy (expecting price rise).
Short = Sell (expecting price fall).
Unlike stocks, short selling in futures is easy because contracts don’t require ownership of the asset.
5. Participants in Futures Market
The market brings together different players:
Hedgers – Reduce risk.
Example: A farmer sells wheat futures to lock in price; an airline buys crude oil futures to hedge fuel cost.
Speculators – Profit from price movements.
Traders, investors, hedge funds.
They provide liquidity but assume higher risk.
Arbitrageurs – Exploit price differences.
Example: Buy in spot market and sell futures if mispricing exists.
6. Types of Futures Contracts
Futures are available across asset classes:
a) Commodity Futures
Agricultural: Wheat, corn, soybeans, coffee.
Energy: Crude oil, natural gas.
Metals: Gold, silver, copper.
b) Financial Futures
Index futures (Nifty, S&P 500).
Currency futures (USD/INR, EUR/USD).
Interest rate futures (10-year bond yields).
c) Other Emerging Futures
Volatility index futures (VIX).
Crypto futures (Bitcoin, Ethereum).
7. Futures Trading Strategies
Futures are flexible and allow many trading approaches:
a) Directional Trading
Going long if expecting price rise.
Going short if expecting price fall.
b) Hedging
Farmers hedge crop prices.
Exporters/importers hedge currency fluctuations.
Investors hedge stock portfolios with index futures.
c) Spread Trading
Buy one contract, sell another.
Example: Buy December crude oil futures, sell March crude oil futures (calendar spread).
d) Arbitrage
Exploiting mispricing between spot and futures.
Example: If Gold futures are overpriced compared to spot, arbitrageurs sell futures and buy spot.
e) Advanced Strategies
Pairs trading: Trade correlated futures.
Hedged positions: Combining futures with options.
8. Advantages of Futures Trading
High Leverage: Amplifies potential returns.
Liquidity: Major futures markets have deep liquidity.
Transparency: Regulated by exchanges.
Flexibility: Can trade both rising and falling markets.
Hedging tool: Reduces risk exposure.
9. Risks in Futures Trading
While powerful, futures are risky:
Leverage risk: Losses are amplified just like profits.
Volatility risk: Futures can swing widely.
Margin calls: If losses exceed margin, traders must add funds.
Liquidity risk: Some contracts may have low volume.
Unlimited losses: Unlike options, risk is not capped.
Example: If you short crude oil at $80 and it rises to $120, your losses are massive.
10. Practical Example of Futures Trade
Imagine you believe gold prices will rise.
Gold futures contract size: 100 grams.
Current price: ₹60,000 per 10 grams → Contract value = ₹600,000.
Margin requirement: 10% = ₹60,000.
You buy one contract at ₹60,000.
If gold rises to ₹61,000 → Profit = ₹1,000 × 10 = ₹10,000.
If gold falls to ₹59,000 → Loss = ₹10,000.
A small move in price leads to large gains or losses due to leverage.
Conclusion
Futures trading is a double-edged sword – a tool of immense power for hedging and speculation, but equally capable of wiping out capital if misused. Traders must understand contract mechanics, manage leverage wisely, and apply strict risk management.
For professionals and disciplined traders, futures offer unparalleled opportunities. For careless traders, they can be disastrous.
The bottom line:
Learn the basics thoroughly.
Start small with proper risk controls.
Treat futures trading as a skill to master, not a gamble.
If used smartly, futures trading can become a gateway to financial growth and protection against market uncertainty.
Risk Smart, Grow Fast (Small Account Trading)Introduction
Most traders dream of becoming full-time, financially free traders. But there’s a common challenge: many start with small accounts. When you have a small account, every dollar matters, and one bad trade can wipe out weeks or months of progress. At the same time, you want to grow your account quickly.
This creates a tough balance: How do you grow fast without blowing up your account?
The answer lies in being risk smart. Trading is not about taking the biggest bets; it’s about protecting your capital while allowing your money to grow steadily. The smaller the account, the more discipline and precision you need.
In this guide, we’ll explore everything you need to know about small account trading, from psychology and risk management to strategies, tools, and growth plans.
Chapter 1: The Psychology of a Small Account
Trading a small account is more mental than technical. Let’s face it:
A $100 profit may look tiny compared to the big players making thousands per day.
Losses feel heavier because you have less cushion.
Impatience is stronger—you want to grow fast.
Here are some psychological traps:
Overtrading: You feel like you must take every trade to “make it big.”
Revenge Trading: After a loss, you double down to recover quickly.
Comparing with others: Seeing other traders’ big profits makes you greedy.
Fear of missing out (FOMO): You jump into trades without analysis because you don’t want to “miss the move.”
👉 The key mindset: Small gains compound into big growth. If you focus on risk management and consistency, your account will grow—not overnight, but steadily.
Chapter 2: Why Small Accounts Blow Up
Let’s talk honestly. Most small accounts don’t survive because traders break these rules:
Too much risk per trade (risking 20–50% of the account).
No stop-loss, leading to one trade wiping everything out.
Chasing unrealistic returns, expecting to double the account in a week.
Ignoring fees & commissions (especially in options or futures).
Trading without a plan—just reacting to charts.
For a small account, survival is victory. If you survive, you get time to grow. If you blow up, game over.
Chapter 3: The Risk Smart Formula
When you trade small accounts, risk is your shield. Here’s a simple formula:
Risk 1–2% of your account per trade.
Example: On a $500 account, risk only $5–$10 per trade.
That way, 10 losing trades in a row won’t kill your account.
Use stop-loss orders always.
Decide your maximum loss before entering.
Don’t move stops because of “hope.”
Focus on high-probability setups.
Don’t trade every move. Trade only when risk/reward is clear (at least 1:2 or 1:3).
Position sizing is everything.
If your stop-loss is $0.50 and you can risk $10, buy only 20 shares.
Adjust size to protect capital.
This is how small traders survive long enough to grow.
Chapter 4: The Power of Compounding
Small gains look boring—but they multiply.
Example:
If you make just 2% per week, on a $1,000 account, that’s $20/week.
In one year, it grows to $2,700+.
In five years, it becomes $30,000+.
This is the hidden power of being risk smart. While others blow up accounts chasing 100% returns, you quietly build wealth.
Chapter 5: Strategies for Small Accounts
Now, let’s look at practical strategies you can use.
1. Scalping & Day Trading
Take small, quick profits (0.5%–2% per trade).
Works well because small accounts can’t handle long drawdowns.
Best in liquid stocks or indices (Nifty, Bank Nifty, SPY, AAPL, etc.).
2. Swing Trading
Hold trades for a few days to weeks.
Good if you can’t sit in front of screens all day.
Focus on strong trends and tight risk.
3. Options Trading (Careful!)
Options allow leverage, which is good for small accounts.
But they’re risky if you don’t manage size.
Use defined-risk strategies like debit spreads or buying calls/puts with small capital.
4. Futures / Micro Contracts
Some markets offer micro futures (like Micro E-mini S&P).
They let small accounts trade big markets with low risk.
5. Focus on One Setup
Small account traders shouldn’t try 10 strategies.
Pick one high-probability pattern (breakouts, pullbacks, VWAP bounces, etc.).
Master it.
Chapter 6: The Growth Blueprint
Here’s a step-by-step growth plan for a $500–$2,000 account.
Stage 1: Survival (First 3–6 months)
Goal: Don’t blow up.
Focus on risk control and discipline.
Take small positions, learn patterns, and build consistency.
Stage 2: Consistency (6–12 months)
Goal: Be profitable monthly.
Focus on taking only A+ setups.
Increase position size slowly.
Stage 3: Scaling (1–3 years)
Goal: Grow account steadily.
Reinvest profits back.
Gradually add more size once consistent.
Stage 4: Freedom (3+ years)
Goal: Trade for living.
Now the account is large enough to provide income.
Chapter 7: Tools Every Small Account Trader Needs
Broker with low commissions: Fees eat small accounts alive.
Charting platform: TradingView, ThinkOrSwim, Zerodha Kite.
Stop-loss automation: Never rely on “mental stops.”
Journal: Track every trade (why you entered, risk, result).
Risk calculator: Helps decide position size.
Chapter 8: Risk Smart Habits
Always pre-plan trades (entry, stop, target).
Avoid over-leverage.
Respect stop-loss like a religion.
Don’t trade to “make money fast.” Trade to protect capital.
Review weekly: Look at what worked, what didn’t.
Chapter 9: Case Studies
Trader A: Greedy Approach
Account: $1,000
Risk per trade: $200 (20%).
Lost 3 trades in a row → account down to $400.
Tried revenge trading → account blown in 1 month.
Trader B: Risk Smart
Account: $1,000
Risk per trade: $10 (1%).
Trades 50 times in 3 months.
Wins 30 trades with 1:2 risk/reward.
End result: $1,300 account (30% growth).
Still alive, compounding.
👉 Which trader has a future? Clearly, Trader B.
Chapter 10: How to Grow Fast Without Blowing Up
Here’s the balance you’re looking for:
Trade high-probability setups only.
Add leverage carefully. Start small, increase size only when consistent.
Withdraw profits rarely. Reinvest to compound faster.
Diversify income streams. Don’t rely only on one style (maybe mix swing & options).
Conclusion
Small account trading is tough—but not impossible.
The secret is to be risk smart: protect your capital, take small but consistent gains, and avoid greed. By doing this, you’ll build discipline, confidence, and a growing account.
The formula is simple:
Risk small.
Stay consistent.
Compound gains.
Grow fast—but safely.
Remember: You don’t have to trade big to trade smart. But if you trade smart, one day you’ll trade big.

Trading Master Class With ExpertsTips for Beginners in Options Trading
Start with buying calls/puts before selling.
Trade liquid instruments like Nifty/Bank Nifty.
Learn Greeks slowly, don’t jump into complex strategies.
Avoid naked option selling without hedging.
Paper trade before risking real capital.
Role of Volatility in Options
Volatility is the lifeblood of options.
High Volatility = Expensive Premiums.
Low Volatility = Cheap Premiums.
Traders often use Implied Volatility (IV) to decide whether to buy (when IV is low) or sell (when IV is high).
Mastering Options
Options are like a Swiss Army Knife of trading—one tool with multiple uses: speculation, hedging, and income generation. But with great power comes great responsibility.
To succeed in options trading:
Understand the basics thoroughly.
Start small and simple.
Master risk management.
Use strategies suited to your market outlook.
Keep emotions under control.
With practice and discipline, options can become a game-changer in your trading journey.

Part 3 Learn Institutional TradingOption Greeks – The Science Behind Pricing
Options pricing is influenced by multiple factors. These sensitivities are known as the Greeks:
Delta – Measures how much option price changes with stock price.
Gamma – Rate of change of Delta.
Theta – Time decay (options lose value daily).
Vega – Sensitivity to volatility.
Rho – Sensitivity to interest rates.
Example: A call option with Delta = 0.6 means for every ₹10 rise in stock, option premium increases by ₹6.
Basic Option Strategies (Beginner Level)
Buying Calls – Bullish bet.
Buying Puts – Bearish bet.
Covered Call – Hold stock + sell call for extra income.
Protective Put – Own stock + buy put for downside insurance.

Part 1 Ride The Big Moves Call and Put Options in Action
Call Option Example
Reliance is trading at ₹2500.
You buy a 1-month call option with strike price ₹2550, premium ₹50, lot size 505.
If Reliance rises to ₹2700 → Profit = (2700 - 2550 - 50) × 505 = ₹50,500.
If Reliance falls below 2550 → You lose only the premium (₹25,250).
Put Option Example
Nifty is at 20,000.
You buy a 1-month put option, strike 19,800, premium 100, lot size 50.
If Nifty falls to 19,200 → Profit = (19,800 - 19,200 - 100) × 50 = ₹25,000.
If Nifty rises above 19,800 → You lose premium (₹5,000).
Participants in Options Trading
Option Buyer – Pays premium, has limited risk and unlimited profit potential.
Option Seller (Writer) – Receives premium, has limited profit and potentially unlimited risk.
Example:
Buyer of call: Unlimited upside, limited loss (premium).
Seller of call: Limited profit (premium), unlimited loss if stock rises.

Part 1 Master Candlestick PatternIntroduction to Options Trading
Options trading is one of the most powerful tools in the financial markets. Unlike traditional stock trading, where you buy or sell shares directly, options allow you to control an asset without owning it outright. This gives traders flexibility, leverage, and a wide range of strategies for both profits and risk management.
At its core, an option is a contract that gives the buyer the right, but not the obligation, to buy or sell an underlying asset at a specific price (called the strike price) on or before a certain date (the expiration date).
The beauty of options lies in choice: you can profit whether markets are rising, falling, or even staying flat—if you know how to use them.
What is an Option?
An option is a derivative instrument, meaning its value is derived from the price of another asset (the “underlying”), such as:
Stocks (e.g., Reliance, Apple)
Indexes (e.g., Nifty, S&P 500)
Commodities (e.g., Gold, Oil)
Currencies
Two Main Types of Options:
Call Option – Gives the right to buy the underlying asset.
Put Option – Gives the right to sell the underlying asset.
Example:
A call option on Reliance with a strike price of ₹2500 expiring in one month gives you the right (not the obligation) to buy Reliance shares at ₹2500, regardless of the market price.
A put option with a strike of ₹2500 gives you the right to sell at ₹2500.

Reliance 1 Day View Key Levels (1-Day Time Frame)
Based on data from Investing.com and Moneycontrol:
Day’s Range: ₹1,407.90 – ₹1,423.40
Recent Daily High (Aug 21): ₹1,431.90
Recent Daily Low (Aug 11): ₹1,361.20
From chart commentary (TradingView):
Support Zone: ₹1,385–1,400
Resistance Level: Around ₹1,423–1,431
Interpretation & Notes
Intraday activity shows movement between roughly ₹1,408 to ₹1,423.
A daily low near ₹1,408 may serve as short-term support; breaking below could test the ₹1,385–1,400 zone.
On the upside, a close above ₹1,423–1,431 might open potential to push higher.
Remember: technical levels provide guidance, not guarantees—market dynamics and fundamentals can shift price action quickly. Always cross-check with live charts and broader analysis.
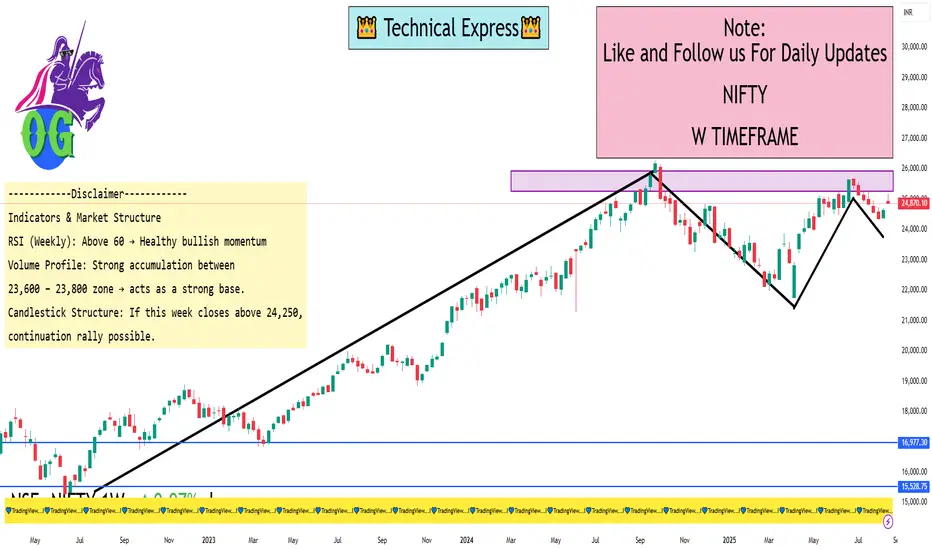
Nifty 1 Week ViewKey Levels (Weekly Time Frame)
Resistance Zones (Upside):
24,250 – 24,300 → Immediate supply zone / resistance
24,500 – 24,600 → Next major resistance (if breakout sustains)
24,850 – 25,000 → Psychological round level + possible profit booking
Support Zones (Downside):
23,950 – 24,000 → Immediate weekly support
23,700 – 23,750 → Strong demand zone (previous breakout level)
23,400 – 23,450 → Deeper support; trend reversal only if broken
Indicators & Market Structure
RSI (Weekly): Above 60 → Healthy bullish momentum, but slightly overbought.
Volume Profile: Strong accumulation between 23,600 – 23,800 zone → acts as a strong base.
Candlestick Structure: If this week closes above 24,250, continuation rally possible. If rejection happens, sideways to mild correction.
Indicators & Oscillators in Trading1. Introduction
In the world of financial markets, traders are constantly searching for ways to gain an edge. While fundamental analysis looks at company earnings, news, and economic trends, technical analysis focuses on price action, patterns, and market psychology.
At the core of technical analysis lie Indicators and Oscillators. These are mathematical calculations based on price, volume, or both, designed to give traders insights into the direction, momentum, strength, or volatility of a market.
In simple words, Indicators help you see the invisible — they take raw price data and transform it into something more structured, often plotted on a chart to highlight opportunities. Oscillators, on the other hand, are a special category of indicators that move within a fixed range (like 0 to 100), helping traders identify overbought and oversold conditions.
Understanding them is crucial because they:
Improve trade timing.
Help confirm signals.
Prevent emotional decision-making.
Allow traders to recognize trends earlier.
2. What Are Indicators?
Indicators are mathematical formulas applied to a stock, forex pair, commodity, or index to make market data easier to interpret.
For example, a simple indicator is the Moving Average. It takes the average of closing prices over a set number of days and smooths out fluctuations. This makes it easier to see the underlying trend.
Indicators can be broadly categorized into two groups:
Leading Indicators – Predict future price movements.
Example: Relative Strength Index (RSI), Stochastic Oscillator.
These give signals before the trend actually changes.
Lagging Indicators – Confirm existing price movements.
Example: Moving Averages, MACD.
They follow price action and confirm that a trend has started or ended.
3. What Are Oscillators?
Oscillators are a subcategory of indicators that fluctuate within a defined range. For example, the RSI ranges from 0 to 100, while the Stochastic Oscillator ranges from 0 to 100 as well.
Traders use oscillators to identify:
Overbought conditions (when prices may be too high and due for correction).
Oversold conditions (when prices may be too low and due for a bounce).
The key difference between indicators and oscillators is that while all oscillators are indicators, not all indicators are oscillators. Oscillators usually appear in a separate window below the price chart.
4. Types of Indicators
Indicators can be classified based on their purpose:
A. Trend Indicators
These show the direction of the market.
Moving Averages (SMA, EMA, WMA)
MACD (Moving Average Convergence Divergence)
ADX (Average Directional Index)
B. Momentum Indicators
These measure the speed of price movements.
RSI (Relative Strength Index)
Stochastic Oscillator
CCI (Commodity Channel Index)
C. Volatility Indicators
These show how much prices are fluctuating.
Bollinger Bands
ATR (Average True Range)
Keltner Channels
D. Volume Indicators
These use traded volume to confirm price moves.
OBV (On-Balance Volume)
VWAP (Volume Weighted Average Price)
Chaikin Money Flow
5. Popular Indicators Explained
Let’s break down some of the most commonly used indicators:
5.1 Moving Averages
Simple Moving Average (SMA): Average of closing prices over a period.
Exponential Moving Average (EMA): Gives more weight to recent data, reacts faster.
Use: Identify trend direction, support, and resistance.
Example: If the 50-day EMA crosses above the 200-day EMA (Golden Cross), it’s a bullish signal.
5.2 MACD (Moving Average Convergence Divergence)
Consists of two EMAs (usually 12-day and 26-day).
A signal line (9-day EMA of MACD) generates buy/sell signals.
Use: Trend-following, momentum strength.
Example: When MACD crosses above signal line → Buy signal.
5.3 RSI (Relative Strength Index)
Range: 0 to 100.
Above 70 = Overbought.
Below 30 = Oversold.
Use: Identify reversals, divergence signals.
Example: RSI above 80 in a strong uptrend may still rise, so context matters.
5.4 Stochastic Oscillator
Compares a closing price to a range of prices over a period.
Range: 0 to 100.
Signals:
Above 80 = Overbought.
Below 20 = Oversold.
Special feature: Generates crossovers between %K and %D lines.
5.5 Bollinger Bands
Consist of a moving average and two standard deviation bands.
Bands expand during volatility, contract during consolidation.
Use:
Price near upper band = Overbought.
Price near lower band = Oversold.
5.6 Average True Range (ATR)
Measures volatility, not direction.
Higher ATR = High volatility.
Lower ATR = Low volatility.
Use: Set stop-loss levels, position sizing.
5.7 OBV (On-Balance Volume)
Combines price movement with volume.
Rising OBV = buyers in control.
Falling OBV = sellers in control.
6. Combining Indicators
No single indicator is perfect. Traders often combine two or more indicators to filter false signals.
Example Strategies:
RSI + Moving Average: Identify oversold conditions only if price is above the moving average (trend filter).
MACD + Bollinger Bands: Use MACD crossover as entry, Bollinger Band touch as exit.
Volume + Trend Indicator: Confirm trend direction with volume support.
7. Advantages of Using Indicators & Oscillators
Clarity – Simplifies raw data into easy-to-read signals.
Discipline – Reduces emotional trading.
Confirmation – Supports price action with mathematical evidence.
Adaptability – Works across stocks, forex, commodities, crypto.
8. Limitations
Lagging nature: Most indicators follow price, not predict it.
False signals: Especially in sideways markets.
Over-reliance: Blind faith in indicators leads to losses.
Conflicting results: Different indicators may show opposite signals.
9. Best Practices for Traders
Keep it simple: Use 2–3 reliable indicators instead of clutter.
Understand context: RSI at 80 in a strong bull run may not mean “sell.”
Combine with price action: Indicators are tools, not replacements for reading charts.
Backtest strategies: Always test on historical data before applying in live trades.
Adapt timeframe: What works in daily charts may not work in 5-minute charts.
10. Real-World Example
Suppose a trader is analyzing Nifty 50 index:
50-day EMA is above 200-day EMA → Trend is bullish.
RSI is at 65 → Market is not yet overbought.
OBV is rising → Strong buying volume.
Bollinger Bands are expanding → High volatility.
Conclusion: Strong bullish momentum. Trader may enter long with stop-loss below 200-day EMA.
Conclusion
Indicators & Oscillators are like navigation tools for traders. They don’t guarantee profits but improve decision-making, discipline, and timing. The real skill lies in knowing when to trust them, when to ignore them, and how to combine them with price action and market context.
To master them:
Learn their math and logic.
Practice on historical charts.
Combine with market structure analysis.
Keep evolving as markets change.
A professional trader treats indicators not as magical prediction machines, but as assistants in understanding market psychology.
Global Events & Market ImpactIntroduction
Financial markets are like living organisms—sensitive, reactive, and constantly adapting to external influences. While company fundamentals, earnings, and investor psychology play a large role in stock price movements, global events often serve as the real catalysts for dramatic market swings.
A political decision in Washington, a sudden military conflict in the Middle East, a central bank announcement in Europe, or even a natural disaster in Asia can ripple across global financial markets within minutes. In today’s hyper-connected economy, where capital flows across borders instantly and news spreads in real time, no country or investor is fully insulated from worldwide developments.
This article explores in detail how different global events—ranging from geopolitical tensions, pandemics, and trade wars to central bank policies, technological revolutions, and climate change—affect financial markets. We’ll also study both short-term volatility and long-term structural shifts that such events trigger.
1. The Nature of Market Sensitivity to Global Events
Markets are essentially forward-looking. They do not simply react to present conditions but rather try to price in future risks and opportunities. This is why even rumors of a war, speculation about interest rate changes, or forecasts of a hurricane can cause markets to swing before the actual event occurs.
Three key characteristics define market responses to global events:
Speed – In the era of high-frequency trading and global media, reactions can happen within seconds.
Magnitude – The scale of reaction depends on how “systemic” the event is (for example, the 2008 financial crisis vs. a localized earthquake).
Duration – Some events cause short-term panic but markets recover quickly; others reshape the global economy for decades.
2. Categories of Global Events Affecting Markets
Global events can be broadly classified into several categories, each with distinct market impacts:
Geopolitical Events – wars, terrorism, political instability, sanctions, and diplomatic conflicts.
Economic Policies & Central Bank Decisions – interest rate changes, fiscal stimulus, tax reforms.
Global Trade & Supply Chain Disruptions – tariffs, trade wars, port blockages, shipping crises.
Natural Disasters & Climate Change – hurricanes, floods, wildfires, long-term climate risks.
Health Crises & Pandemics – global spread of diseases like COVID-19, SARS, Ebola.
Technological Disruptions – breakthroughs in AI, energy, and digital finance.
Commodity Shocks – sudden movements in oil, gold, or food prices.
Financial Crises & Systemic Shocks – banking collapses, currency devaluations, debt crises.
Let’s examine each in detail.
3. Geopolitical Events
Wars and Conflicts
Wars often cause energy and commodity prices to spike, especially when they involve major producers.
Example: The Russia-Ukraine war (2022) sent oil, gas, and wheat prices soaring, creating inflationary pressures worldwide.
Defense stocks usually rally, while riskier assets like emerging markets decline.
Political Instability
Elections, regime changes, and coups often create uncertainty.
Example: Brexit (2016) caused volatility in the pound sterling, reshaped European equity flows, and influenced global trade policy.
Terrorism
Major attacks (e.g., 9/11) often trigger immediate sell-offs in equity markets, with a flight to safe-haven assets like gold and US Treasury bonds.
4. Economic Policies & Central Banks
Interest Rate Decisions
Central banks like the US Federal Reserve, European Central Bank (ECB), and RBI (India) are powerful drivers of markets.
When rates rise, borrowing becomes expensive, which usually depresses stock markets but strengthens the currency.
Conversely, rate cuts often boost equities but weaken currencies.
Quantitative Easing (QE)
During crises (2008, COVID-19), central banks injected liquidity into markets, which drove asset prices upward.
Fiscal Stimulus & Taxation
Government spending plans, subsidies, or corporate tax cuts influence corporate earnings expectations and therefore stock valuations.
5. Global Trade & Supply Chains
Trade Wars
Example: The US-China trade war (2018–2019) disrupted global technology and manufacturing supply chains, causing volatility in stock markets and commodity markets.
Supply Chain Disruptions
COVID lockdowns in China created shortages in semiconductors and other goods, which impacted global auto and electronics industries.
Shipping & Logistics
Events like the Suez Canal blockage (2021) caused billions in losses and exposed how dependent markets are on smooth global logistics.
6. Natural Disasters & Climate Change
Natural Disasters
Hurricanes, tsunamis, or earthquakes often create localized stock market declines.
Example: The 2011 Japan earthquake & Fukushima nuclear disaster had global impacts on energy and auto supply chains.
Climate Change
Increasingly, investors are pricing climate risk into valuations.
Companies in fossil fuel industries face long-term risks, while renewable energy firms attract capital.
ESG (Environmental, Social, Governance) investing has emerged as a global trend.
7. Health Crises & Pandemics
COVID-19 (2020–2022)
One of the most impactful global events in modern history.
Stock markets initially crashed in March 2020 but rebounded sharply due to massive fiscal and monetary support.
Certain sectors like airlines, hotels, and oil were devastated, while tech and healthcare boomed.
Past Examples
SARS (2003) hit Asian markets temporarily.
Ebola (2014) affected African economies but had limited global effect compared to COVID.
8. Technological Disruptions
Innovations Driving Markets
The dot-com bubble (1999–2000) showed how technology hype can inflate markets.
More recently, AI and EV (Electric Vehicles) have created massive rallies in companies like Nvidia and Tesla.
Risks from Technology
Cyberattacks on financial institutions or major corporations can cause sudden market dips.
Example: Ransomware attacks or hacking of exchanges.
9. Commodity Shocks
Oil Price Volatility
Oil remains one of the most geopolitically sensitive commodities.
Example: The 1973 oil crisis caused stagflation globally.
In 2020, oil futures briefly turned negative due to demand collapse.
Gold as a Safe Haven
During uncertainty, gold prices usually rise.
Investors view it as a hedge against inflation, currency depreciation, and geopolitical risks.
Food Commodities
Droughts or export bans (e.g., India restricting rice exports) can push global food inflation higher.
10. Financial Crises & Systemic Shocks
Global Financial Crisis (2008)
Triggered by the collapse of Lehman Brothers, this event led to the worst global recession since the Great Depression.
Stock markets fell over 50%, but also created long-term changes in regulation and central bank behavior.
Asian Financial Crisis (1997)
Currency devaluations in Thailand, Indonesia, and South Korea triggered capital flight and market crashes.
European Debt Crisis (2010–2012)
Greece’s sovereign debt problems shook confidence in the Eurozone and created long-term structural reforms.
Conclusion
Global events are unavoidable in financial markets. While some are unpredictable “black swan” shocks, others evolve slowly, giving investors time to adjust. Understanding how markets react to wars, pandemics, central bank decisions, and technological disruptions can help investors navigate uncertainty more effectively.
In the short term, markets may appear chaotic. But history shows that crises often accelerate long-term transformations in economies and industries. The winners are those who maintain discipline, manage risk, and adapt strategies as global dynamics shift.

Common Mistakes New Traders Make1. Jumping into Trading Without Education
Many beginners dive into trading after watching a few YouTube videos, following tips from social media, or hearing success stories of others. But trading isn’t about luck — it’s about skill, discipline, and strategy.
Mistake: Believing trading is just buying low and selling high.
Reality: Trading requires understanding technical analysis, risk management, psychology, and market structure.
Example: A new trader hears about a stock that doubled in a week. They buy without research, but by the time they enter, the stock has already peaked. The price crashes, and they lose money.
Solution: Treat trading like a profession. Just as a doctor or engineer studies for years, a trader needs structured learning — books, courses, simulations, and practice before putting real money at risk.
2. Trading Without a Plan
Imagine playing a cricket match without a game plan — chaos is guaranteed. Similarly, trading without a clear plan leads to impulsive decisions.
Mistake: Buying and selling based on emotions or news without rules.
Reality: Successful traders have a written trading plan that defines entries, exits, position size, and risk per trade.
Example: A beginner sees a stock rising sharply and enters. But when it drops, they don’t know whether to cut losses or hold. Confusion results in bigger losses.
Solution: Build a trading plan that answers:
What markets will I trade?
What timeframes will I use?
What setups will I look for?
How much capital will I risk?
When will I exit with profit/loss?
3. Overtrading
New traders often fall into the trap of taking too many trades, thinking more trades mean more profits. In reality, overtrading drains both money and mental energy.
Mistake: Trading every small market move, chasing excitement.
Reality: Professional traders wait patiently for high-probability setups.
Example: A trader makes 15 trades in a single day, paying high brokerage and making impulsive decisions. Even if a few trades win, commissions and losses wipe out gains.
Solution: Quality over quantity. Focus on one or two good setups a day/week instead of chasing every move.
4. Lack of Risk Management
This is perhaps the biggest mistake new traders make. They risk too much on a single trade, hoping for quick riches.
Mistake: Betting 30–50% of capital on one stock/option.
Reality: Risk per trade should usually be 1–2% of total capital.
Example: A trader with ₹1,00,000 puts ₹50,000 into one stock. The stock falls 20%, wiping out ₹10,000 in one trade. After a few such losses, the account is destroyed.
Solution: Use stop-loss orders, risk only small amounts per trade, and accept losses as part of the game.
5. Revenge Trading
After a loss, beginners often feel the need to “make back money quickly.” This emotional reaction leads to revenge trading — entering bigger trades without logic.
Mistake: Trading emotionally after a loss.
Reality: Losses are normal; chasing them increases damage.
Example: A trader loses ₹5,000 in the morning. Angry, they double their position size in the next trade. The market goes against them again, and they lose ₹15,000 more.
Solution: Step away after a loss. Review what went wrong. Never increase position size just to recover money.
6. Lack of Patience
Trading rewards patience, but beginners crave fast profits. They exit winners too early or hold losers too long.
Mistake: Taking profits too soon, cutting winners; holding losers, hoping they turn.
Reality: Let profits run, cut losses quickly.
Example: A stock moves up 2%, and the trader books profit, missing a 10% rally. But when a trade goes down 5%, they refuse to sell, and the loss grows to 20%.
Solution: Trust your trading system. Follow stop-loss and target levels.
7. Following Tips & Rumors
Many new traders blindly follow WhatsApp tips, Twitter posts, or “friend’s advice” without analysis.
Mistake: Relying on others for buy/sell calls.
Reality: Tips may work occasionally but are not reliable long-term.
Example: A trader buys a “hot stock” from a group. The stock spikes briefly but crashes because big players offload positions.
Solution: Do your own research. Build conviction based on analysis, not rumors.
8. Ignoring Trading Psychology
The market is a battle of emotions — fear, greed, hope, and regret. Beginners often underestimate psychology.
Mistake: Thinking trading is 100% about strategy.
Reality: Psychology is often more important than strategy.
Example: Two traders have the same system. One sticks to rules, the other panics and exits early. The disciplined trader profits; the emotional one doesn’t.
Solution: Practice emotional control. Meditation, journaling, and self-awareness help.
9. No Record Keeping
Many beginners don’t track their trades, so they repeat mistakes.
Mistake: Trading without keeping a log.
Reality: A trading journal reveals strengths and weaknesses.
Example: A trader keeps losing in intraday trades but doesn’t realize it because they don’t track results.
Solution: Maintain a trading journal with details: entry, exit, reason for trade, result, and lessons learned.
10. Unrealistic Expectations
Movies, social media, and success stories create a false impression of overnight riches. Beginners expect to double their account in weeks.
Mistake: Believing trading is a shortcut to wealth.
Reality: Trading is a long-term skill, and returns grow with discipline.
Example: A trader starts with ₹50,000 and expects to make ₹10,000 a day. They take huge risks, lose capital, and quit.
Solution: Aim for consistent small profits. Even 2–3% monthly growth compounds into wealth.
11. Poor Money Management
Beginners often don’t allocate capital wisely. They put most money in risky trades, leaving nothing for better opportunities.
Solution: Diversify across trades, keep emergency funds, and never put all money into one asset.
12. Not Understanding Market Conditions
Markets change — trending, ranging, or volatile. Beginners apply the same strategy everywhere.
Example: A breakout strategy may work in trending markets but fail in sideways ones.
Solution: Learn to read market context (volume profile, trend, volatility). Adapt strategies accordingly.
13. Overconfidence After Wins
A few successful trades can make beginners feel invincible. They increase position sizes drastically, only to face big losses.
Solution: Stay humble. Stick to your plan regardless of wins or losses.
14. Fear of Missing Out (FOMO)
FOMO is powerful in trading. Beginners see a stock rallying and jump in late, only to catch the top.
Solution: Accept that missing trades is normal. The market always offers new opportunities.
15. Lack of Continuous Learning
Markets evolve. Strategies that worked last year may fail now. Beginners often stop learning after early success.
Solution: Keep learning — read books, backtest strategies, and follow market news.
16. Mixing Investing with Trading
Beginners often hold losing trades, calling them “long-term investments.” This blurs strategy.
Solution: Separate trading and investing accounts. Stick to timeframes and plans.
17. Ignoring Risk-Reward Ratio
Many beginners take trades where the potential reward is smaller than the risk.
Example: Risking ₹1,000 for a possible profit of ₹200. Even if right most times, losses eventually dominate.
Solution: Take trades with at least 1:2 or 1:3 risk-reward ratio.
18. Not Practicing in Simulation
Jumping into live markets without demo practice is costly.
Solution: Use paper trading or demo accounts first to build skills without losing money.
19. Not Respecting Stop-Loss
Beginners often remove or widen stop-losses, hoping the trade will reverse.
Solution: Treat stop-loss like a safety belt. It protects you from disasters.
20. Quitting Too Soon
Many traders quit after a few losses, never giving themselves a chance to grow.
Solution: Accept that trading mastery takes years. Losses are tuition fees for market education.
Conclusion
Trading is not a sprint but a marathon. Almost every beginner repeats these mistakes: overtrading, poor risk management, revenge trading, following tips, and ignoring psychology. The good news is that mistakes are stepping stones to mastery — if you learn from them.
By approaching trading with education, discipline, patience, and humility, new traders can avoid the traps that wipe out most beginners and build a path toward consistent profits.
