Eternal Zomato shows strong weakness NSE:ETERNAL
Zomato Near to end his up trend
major support is break near 300 and retested that level and gave another strong down move in daliy time frame. that retest also brakes another support with volume and big move.
chart picture explain all things.
next major support is gap is 230 and that whole zone till 200.
this is not any types of advice.
this is just chart analysis.
do your own research
Zomatoindia

ETERNAL (ZOMATO) By KRS Charts17th April 2025 / 1:24 PM
Why Eternal ??
1. All Over Bullish Stock. Yet Not Profitable but Business model has potential in near Future.
2. Wave Count is suggesting 4th wave is likely finish and 5th last leg is started which can last till 340 Rs.
3 RSI & MACD is showing bullish continues Divg. bears gave there all but failed to make new lower low.
4. Lower TF is showing W pattern Breakout as well with good volume.
Targets and SL 1W Closing Basis are mentioned in chart.

Bond & Fixed Income Trading1. Understanding Bonds and Fixed Income Instruments
1.1 What is a Bond?
A bond is a debt security issued by an entity to raise capital. When you buy a bond, you are lending money to the issuer in exchange for:
Coupon Payments: Fixed or floating interest paid periodically (semiannual, annual, or quarterly).
Principal Repayment: The face value (par value) paid back at maturity.
Example: A government issues a 10-year bond with a face value of $1,000 and a coupon rate of 5%. Investors will receive $50 annually for 10 years, and then $1,000 back at maturity.
1.2 Key Features of Bonds
Issuer: Government, municipality, or corporation.
Maturity: The time until the bondholder is repaid (short-term, medium-term, or long-term).
Coupon Rate: Interest rate, which can be fixed or floating.
Yield: Effective return on the bond based on price, coupon, and time to maturity.
Credit Rating: Issuer’s creditworthiness (AAA to junk).
1.3 Types of Fixed Income Securities
Government Bonds – Issued by national governments (e.g., U.S. Treasuries, Indian G-Secs).
Municipal Bonds – Issued by states or local governments.
Corporate Bonds – Issued by companies to finance projects or operations.
Zero-Coupon Bonds – Sold at discount, pay no interest, only face value at maturity.
Floating Rate Bonds – Coupons tied to a benchmark (like LIBOR, SOFR, or repo rate).
Inflation-Linked Bonds – Adjust coupons or principal with inflation (e.g., U.S. TIPS).
High-Yield (Junk) Bonds – Higher risk, lower credit quality, higher yields.
Convertible Bonds – Can be converted into equity shares.
Sovereign Bonds (Global) – Issued by foreign governments, sometimes in hard currencies like USD or EUR.
2. The Bond Market Structure
2.1 Primary Market
Issuers sell new bonds directly to investors through auctions, syndications, or private placements.
Governments usually conduct auctions.
Corporates issue via investment banks underwriting the debt.
2.2 Secondary Market
Once issued, bonds are traded among investors. Unlike stocks, most bond trading occurs over-the-counter (OTC) rather than centralized exchanges. Dealers, brokers, and electronic platforms facilitate these trades.
2.3 Market Participants
Issuers: Governments, municipalities, corporations.
Investors: Retail investors, pension funds, mutual funds, hedge funds, insurance companies.
Dealers & Brokers: Market makers providing liquidity.
Credit Rating Agencies: Provide credit ratings (Moody’s, S&P, Fitch).
Regulators: Ensure transparency (e.g., SEC in the U.S., SEBI in India).
3. Bond Pricing and Valuation
Bond trading revolves around pricing and yield analysis.
3.1 Bond Pricing Formula
Price = Present Value of Coupons + Present Value of Principal
The discount rate used is based on prevailing interest rates and risk premium.
3.2 Yield Measures
Current Yield = Annual Coupon / Current Price
Yield to Maturity (YTM): Return if bond held till maturity.
Yield to Call (YTC): Return if bond is called before maturity.
Yield Spread: Difference in yields between two bonds (e.g., corporate vs government).
3.3 Inverse Relationship between Price & Yield
When interest rates rise, bond prices fall (yields go up).
When interest rates fall, bond prices rise (yields go down).
This fundamental rule drives trading opportunities.
4. Strategies in Bond & Fixed Income Trading
4.1 Passive Strategies
Buy and Hold: Investors hold bonds until maturity for predictable returns.
Laddering: Staggering maturities to manage reinvestment risk.
Barbell Strategy: Combining short- and long-term bonds.
4.2 Active Strategies
Yield Curve Trading: Betting on changes in the shape of the yield curve (steepening, flattening).
Duration Management: Adjusting portfolio sensitivity to interest rates.
Credit Spread Trading: Exploiting differences between government and corporate yields.
Relative Value Trading: Arbitrage between similar bonds mispriced in the market.
Event-Driven Trading: Taking positions before/after policy changes, credit rating upgrades/downgrades.
4.3 Advanced Strategies
Bond Futures & Options: Derivatives to hedge or speculate.
Credit Default Swaps (CDS): Insurance against default, tradable contracts.
Interest Rate Swaps: Exchanging fixed-rate payments for floating-rate ones.
5. Risks in Bond & Fixed Income Trading
Interest Rate Risk: Prices fall when rates rise.
Credit Risk: Issuer defaults on payments.
Reinvestment Risk: Coupons may have to be reinvested at lower rates.
Liquidity Risk: Some bonds are hard to trade.
Inflation Risk: Rising inflation erodes real returns.
Currency Risk: For foreign bonds, exchange rate volatility matters.
Call & Prepayment Risk: Issuer may redeem bonds early when rates drop.
6. The Role of Central Banks and Monetary Policy
Bond markets are deeply tied to monetary policy:
Central banks control benchmark interest rates.
Through open market operations (OMO), they buy/sell government securities to regulate liquidity.
Quantitative easing (QE): Large-scale bond buying lowers yields.
Tightening cycles: Selling bonds or raising rates pushes yields higher.
Bond traders watch central bank meetings (like U.S. Fed, ECB, RBI) closely since even minor shifts in policy guidance can move bond yields globally.
7. Global Bond Markets
7.1 U.S. Treasury Market
The largest, most liquid bond market globally. Treasuries are considered the world’s risk-free benchmark.
7.2 European Bond Market
Includes German Bunds (safe-haven) and bonds from Italy, Spain, Greece (riskier spreads).
7.3 Asian Markets
Japan’s Government Bonds (JGBs) dominate, often with near-zero or negative yields.
India’s G-Sec market is growing rapidly, with RBI auctions being a key driver.
7.4 Emerging Markets
Sovereign bonds from Brazil, Turkey, South Africa, etc. These offer higher yields but come with higher risk.
8. Technology & Evolution of Fixed Income Trading
Electronic Trading Platforms (MarketAxess, Tradeweb, Bloomberg) are transforming bond markets from dealer-driven to electronic order books.
Algorithmic Trading & AI help in pricing, liquidity detection, and risk management.
Blockchain & Tokenization are being explored for faster settlement and transparency.
9. Case Studies
Case 1: 2008 Financial Crisis
The crisis originated partly from securitized debt instruments (mortgage-backed securities). Credit risk was underestimated, and defaults triggered global turmoil.
Case 2: COVID-19 Pandemic (2020)
Global bond yields crashed as investors rushed into safe-haven Treasuries. Central banks intervened with QE programs, leading to record low yields.
Case 3: Inflation Surge (2021–2023)
Bond yields spiked worldwide as central banks aggressively hiked rates to control inflation. Bond traders faced sharp volatility, especially in long-duration bonds.
10. Why Investors Trade Bonds
Stability & Income: Bonds provide predictable interest income.
Diversification: Balances equity-heavy portfolios.
Safe-Haven: Government bonds perform well in crises.
Speculation: Traders bet on interest rate moves and credit spreads.
Hedging: Bonds hedge against stock market volatility.
11. Future of Bond & Fixed Income Trading
Sustainable Bonds: Green bonds and ESG-linked instruments are growing.
Digital Transformation: Greater adoption of electronic trading and blockchain settlement.
Integration with Global Policies: Climate financing, infrastructure projects.
AI-Powered Analytics: Predictive modeling for yield curve and credit spreads.
Retail Participation: Platforms are increasingly making bonds accessible to individuals.
Conclusion
Bond and fixed income trading is a cornerstone of global finance, connecting governments, corporations, and investors. Unlike equities, where growth and dividends are uncertain, bonds promise fixed cash flows, making them critical for conservative investors as well as aggressive traders.
The dynamics of interest rates, credit risk, monetary policy, and macroeconomics make the bond market both a stabilizer and a source of opportunity. With rapid technological change and growing investor demand for stability, the fixed income market will continue to expand and evolve.
Ultimately, successful bond trading requires deep understanding of interest rate cycles, credit analysis, and market structure, along with disciplined risk management.

Option Trading The Mechanics of Option Pricing
1. Intrinsic Value vs. Time Value
Intrinsic Value: The profit if the option were exercised now.
Time Value: The extra value due to remaining time until expiry.
Option Premium = Intrinsic Value + Time Value.
2. Moneyness of Options
In the Money (ITM): Immediate profit if exercised.
At the Money (ATM): Strike ≈ Current price.
Out of the Money (OTM): No immediate profit, only time value.
3. Option Greeks (The DNA of Options)
Delta: Sensitivity of option price to underlying movement.
Gamma: Sensitivity of Delta to underlying movement.
Theta: Time decay – options lose value as expiry nears.
Vega: Sensitivity to volatility.
Rho: Sensitivity to interest rates.
Understanding Greeks is critical for advanced traders.
Risks in Option Trading
Options are not risk-free.
Premium Decay (Theta Risk): Options lose value daily.
Volatility Risk: Implied volatility crush can hurt positions.
Liquidity Risk: Wide bid-ask spreads increase costs.
Assignment Risk: Writers can be forced to fulfill contracts.
Unlimited Losses: Naked option selling is dangerous.

Demat & Trading AccountsIntroduction
If you want to invest in the stock market or hold securities in India, two terms you will always come across are Demat Account and Trading Account. These two accounts are like the backbone of modern investing. Without them, buying and selling shares in today’s electronic stock market would be nearly impossible.
Earlier, shares were held in physical form (paper certificates). If you wanted to buy or sell, you had to physically deliver these certificates to the buyer or to the exchange. This process was time-consuming, risky (due to frauds, fake certificates, theft, or loss), and created unnecessary delays. To solve this, India adopted the system of dematerialization (demat) in the 1990s.
Today, all trades in the stock market happen online using these two accounts:
Demat Account → for holding securities electronically.
Trading Account → for buying and selling them through the stock exchange.
This write-up will explore both accounts in detail, explain their importance, features, working, types, and practical role in the Indian stock market.
1. Understanding the Basics
1.1 What is a Demat Account?
A Demat Account (short for Dematerialized Account) is an account that holds your shares, bonds, mutual funds, ETFs, and other securities in electronic format.
Think of it like a bank account, but instead of holding money, it holds your financial securities. When you buy shares, they get credited to your Demat Account. When you sell, they get debited.
Example: If you buy 100 shares of Infosys, instead of getting paper certificates, these 100 shares are electronically stored in your Demat Account.
In India, Demat Accounts are maintained by Depositories:
NSDL (National Securities Depository Limited)
CDSL (Central Depository Services Limited)
These depositories hold securities, while intermediaries called Depository Participants (DPs) (like banks, brokers, or financial institutions) give investors access to open and manage accounts.
1.2 What is a Trading Account?
A Trading Account is an account that allows you to place buy or sell orders in the stock market.
You cannot directly go to NSE or BSE to buy stocks. You need a broker who provides you with a Trading Account.
Through this account, you send orders (like “Buy 10 shares of TCS at ₹3500”) which get executed on the stock exchange.
In simple words:
Trading Account = Interface between you and the stock exchange.
Demat Account = Storage for your securities.
1.3 How Demat & Trading Accounts Work Together
Both accounts are interconnected. Here’s the flow of a transaction:
You place a buy order via your Trading Account.
Money gets debited from your Bank Account.
Shares are transferred into your Demat Account.
Similarly, when you sell shares:
You place a sell order in the Trading Account.
Shares get debited from your Demat Account.
Money gets credited into your Bank Account.
Thus, three accounts are linked:
Bank Account (funds)
Trading Account (market transactions)
Demat Account (holdings)
2. History & Evolution in India
2.1 Before Demat Accounts
Shares were issued in physical form.
Transfer of ownership required endorsement and physical delivery.
Problems: Fake certificates, theft, delays in settlement, bad deliveries.
2.2 Introduction of Demat System
1996: India introduced Dematerialization under SEBI regulation.
First electronic trade took place with NSDL as the main depository.
Later, CDSL was established.
Today, more than 99% of trades in India happen in electronic form.
3. Features of Demat Account
Paperless Holding – No physical certificates, only electronic form.
Multiple Securities – Can hold shares, bonds, ETFs, government securities, mutual funds, etc.
Easy Transfer – Quick transfer of shares during buying/selling.
Safety – Reduces risk of theft, forgery, and loss.
Nomination Facility – You can nominate someone to inherit your securities.
Corporate Benefits – Dividends, bonuses, stock splits, and rights issues are automatically credited.
Accessibility – Can be accessed via online platforms, mobile apps, or brokers.
4. Features of Trading Account
Market Access – Enables buying/selling on NSE, BSE, MCX, etc.
Multiple Segments – Can trade in equity, derivatives (F&O), commodities, and currencies.
Order Types – Market order, limit order, stop-loss order, etc.
Leverage/Margin Trading – Allows intraday and margin trading.
Technology Driven – Mobile apps, algo-trading, advanced charts.
Real-Time Updates – Live prices, executed trades, P&L statements.
5. Types of Demat Accounts
Regular Demat Account – For Indian residents to hold securities.
Repatriable Demat Account – For NRIs, linked with NRE bank account.
Non-Repatriable Demat Account – For NRIs, linked with NRO bank account.
Basic Services Demat Account (BSDA) – For small investors, with low charges.
Corporate Demat Account – For companies and institutions.
6. Types of Trading Accounts
Equity Trading Account – For stocks and equity derivatives.
Commodity Trading Account – For commodities (gold, oil, agricultural products).
Currency Trading Account – For forex trading.
Derivatives Trading Account – For futures and options.
Discount Brokerage Account – For low-cost trading, minimal services.
Full-Service Brokerage Account – With advisory, research, and premium services.
7. Process of Opening Accounts
7.1 Opening a Demat Account
Steps:
Choose a Depository Participant (DP) (bank, broker, NBFC).
Fill application form (KYC).
Submit documents (Aadhar, PAN, photo, bank proof).
Sign agreement with DP.
Get your Demat Account Number (DP ID + Client ID).
7.2 Opening a Trading Account
Steps:
Choose a broker (full-service or discount).
Fill KYC & account opening form.
Link Bank Account and Demat Account.
Get Login ID & Password for online trading.
8. Charges & Costs
Demat Account Charges
Account Opening Fee (some brokers offer free).
Annual Maintenance Charges (AMC).
Transaction Charges (per debit).
Custodian Fee (rare now).
Trading Account Charges
Brokerage Fee (flat fee or percentage).
Transaction Charges (exchange fee).
Securities Transaction Tax (STT).
SEBI Turnover Fees.
GST & Stamp Duty.
9. Advantages of Demat & Trading Accounts
Convenience – Buy/sell in seconds from anywhere.
Safety – No risk of fake/lost certificates.
Transparency – Easy tracking of holdings & trades.
Liquidity – Quick conversion of investments into cash.
Integration – Bank, trading, and demat are linked.
Corporate Benefits – Automatic credit of dividends/bonus.
Access to Multiple Markets – Equity, commodity, currency, derivatives.
10. Risks & Limitations
Technical Failures – System downtime can block trades.
Fraud Risks – If login/password is misused.
Charges – Brokerage and maintenance fees can reduce profits.
Overtrading – Easy access may tempt frequent trading, leading to losses.
Cybersecurity Threats – Hacking of accounts.
11. Role of Demat & Trading Accounts in Indian Stock Market
Helped India move from paper-based to electronic system.
Improved market efficiency and liquidity.
Attracted more retail investors with easy digital access.
Essential for IPOs (Initial Public Offerings) – shares are credited only in Demat form.
Integrated with apps & online platforms (Zerodha, Upstox, Angel One, ICICI Direct, HDFC Securities, etc.).
12. Practical Example
Suppose you want to invest in Reliance Industries:
You log in to your Trading Account and place a buy order for 50 shares.
Money is deducted from your Bank Account.
After settlement (T+1 day), 50 shares appear in your Demat Account.
Later, when Reliance declares a dividend, the amount is directly credited to your Bank Account.
If Reliance issues bonus shares, they are automatically credited to your Demat Account.
This shows the smooth link between all three accounts.
13. Future of Demat & Trading Accounts in India
More digital integration with UPI, AI-based advisory, and robo-trading.
Growth in retail participation due to mobile apps.
Expansion of commodity and global investing options.
Reduced charges with increasing competition among brokers.
Enhanced cybersecurity measures for safer trading.
Conclusion
Demat and Trading Accounts have revolutionized the Indian stock market. They replaced the old paper-based system, making investing faster, safer, and more efficient.
A Demat Account stores your securities.
A Trading Account lets you buy/sell them on exchanges.
Together, they act as the gateway for every investor to participate in the financial markets.
Whether you are a beginner or an experienced trader, understanding these two accounts is the first step toward wealth creation through the stock market.
Financial Markets1. Introduction
Financial markets are the backbone of modern economies, serving as platforms where individuals, companies, and governments can raise capital, trade financial instruments, and manage risks. They facilitate the flow of funds from surplus units (those with excess capital) to deficit units (those in need of funds), enabling economic growth and development.
At their core, financial markets serve three primary functions:
Price Discovery – determining the price of financial assets through supply and demand.
Liquidity Provision – enabling participants to buy and sell assets easily.
Risk Management – allowing participants to hedge against uncertainties like interest rate changes, inflation, or currency fluctuations.
2. Types of Financial Markets
Financial markets are broadly classified into several categories based on the nature of the assets traded and the maturity of the instruments.
2.1 Capital Markets
Capital markets are where long-term securities, such as stocks and bonds, are bought and sold. They are crucial for channeling savings into productive investments. Capital markets are further divided into:
2.1.1 Stock Markets
The stock market is where equity shares of companies are issued and traded. Equity represents ownership in a company, and investors earn returns through dividends and capital appreciation. Stock markets can be divided into:
Primary Market: Where companies issue new shares through Initial Public Offerings (IPOs) or Follow-on Public Offers (FPOs). It allows companies to raise long-term capital directly from investors.
Secondary Market: Where existing shares are traded among investors. This includes major exchanges like the New York Stock Exchange (NYSE), NASDAQ, and Bombay Stock Exchange (BSE).
Key functions of stock markets:
Facilitating capital formation.
Providing liquidity for investors.
Helping in price discovery and valuation of companies.
2.1.2 Bond Markets
Bond markets, or debt markets, involve the issuance and trading of debt securities such as government bonds, corporate bonds, and municipal bonds. Bonds allow governments and corporations to borrow funds from the public with a promise to repay principal and interest. Types of bonds include:
Government Bonds – low-risk, used to fund national projects.
Corporate Bonds – medium to high-risk, issued by companies for expansion.
Municipal Bonds – issued by local governments to fund infrastructure projects.
2.2 Money Markets
Money markets deal with short-term borrowing and lending, typically with maturities of less than one year. They are essential for managing liquidity and short-term funding needs. Common instruments in money markets include:
Treasury Bills (T-Bills) – short-term government securities.
Commercial Paper (CP) – unsecured, short-term debt issued by corporations.
Certificates of Deposit (CDs) – issued by banks for fixed short-term deposits.
Repurchase Agreements (Repos) – short-term borrowing secured against securities.
Money markets are highly liquid and considered low-risk. They play a crucial role in interest rate determination and monetary policy implementation.
2.3 Derivatives Markets
Derivatives are financial instruments whose value depends on an underlying asset, such as stocks, bonds, currencies, commodities, or indices. They are primarily used for hedging risk, speculation, and arbitrage. Common derivatives include:
Futures Contracts – agreements to buy or sell an asset at a predetermined price on a future date.
Options Contracts – giving the right, but not the obligation, to buy or sell an asset.
Swaps – contracts to exchange cash flows, such as interest rate or currency swaps.
Forwards – customized contracts to buy or sell an asset at a future date.
Derivatives markets help stabilize prices, manage risk, and improve market efficiency.
2.4 Foreign Exchange (Forex) Markets
The forex market is the global marketplace for trading currencies. It determines exchange rates and facilitates international trade and investment. Key participants include central banks, commercial banks, hedge funds, multinational corporations, and retail traders. The forex market is the largest financial market in the world, with daily trading exceeding $6 trillion.
Functions:
Facilitates international trade and investment.
Helps hedge against currency risks.
Influences inflation and interest rates globally.
2.5 Commodity Markets
Commodity markets trade physical goods like gold, silver, oil, agricultural products, and industrial metals. They can be classified into:
Spot Markets – trading commodities for immediate delivery.
Futures Markets – trading contracts for future delivery, helping producers and consumers hedge against price fluctuations.
Commodity markets are essential for price discovery, risk management, and economic planning.
3. Functions of Financial Markets
Financial markets perform several key functions that sustain economic growth:
Mobilization of Savings – They convert individual savings into productive investments.
Resource Allocation – Financial markets ensure efficient allocation of funds to projects with the highest potential returns.
Price Discovery – Markets determine prices based on supply and demand.
Liquidity Provision – Investors can convert securities into cash quickly.
Risk Management – Derivatives and insurance instruments help mitigate financial risks.
Reduction in Transaction Costs – Centralized markets reduce costs of buying and selling securities.
Economic Indicator – Financial market trends often signal economic conditions, growth, or recessions.
4. Participants in Financial Markets
Various participants operate in financial markets, each with distinct roles and objectives.
4.1 Individual Investors
Individuals invest in stocks, bonds, mutual funds, and ETFs for wealth creation, retirement planning, and income generation.
4.2 Institutional Investors
Large organizations, such as mutual funds, pension funds, insurance companies, and hedge funds, participate with significant capital, influencing market movements.
4.3 Corporations
Corporations raise capital by issuing equity or debt and may also hedge risks using derivatives.
4.4 Governments
Governments issue bonds to finance deficits, regulate financial markets, and implement monetary policies.
4.5 Intermediaries
Banks, brokers, and investment advisors facilitate transactions, provide liquidity, and offer investment guidance.
5. Instruments Traded in Financial Markets
Financial markets involve a wide variety of instruments:
Equities (Stocks) – ownership in companies.
Debt Instruments (Bonds, Debentures, CPs) – borrowing contracts.
Derivatives (Futures, Options, Swaps) – risk management instruments.
Foreign Exchange (Currency pairs) – global currency trading.
Commodities (Gold, Oil, Wheat, etc.) – physical or derivative-based trade.
Mutual Funds & ETFs – pooled investment vehicles.
Cryptocurrencies (Bitcoin, Ethereum, etc.) – emerging digital assets.
6. Regulatory Framework
Financial markets are heavily regulated to maintain transparency, fairness, and investor protection. Regulatory bodies include:
Securities and Exchange Board of India (SEBI) – regulates Indian securities markets.
U.S. Securities and Exchange Commission (SEC) – oversees American securities markets.
Commodity Futures Trading Commission (CFTC) – regulates derivatives and commodity trading.
Central Banks – control money supply, interest rates, and banking regulations.
Regulation ensures stability, reduces fraud, and maintains investor confidence.
7. Technology and Financial Markets
Technological advancements have transformed financial markets:
Algorithmic Trading – automated trading using mathematical models.
High-Frequency Trading (HFT) – executing large volumes of trades in milliseconds.
Blockchain and Cryptocurrencies – decentralized, secure trading platforms.
Robo-Advisors – AI-based investment advisory services.
Mobile Trading Apps – enabling retail investors to trade seamlessly.
Technology improves efficiency, reduces costs, and increases accessibility.
8. Challenges in Financial Markets
Despite their benefits, financial markets face several challenges:
Market Volatility – prices can fluctuate due to economic, political, or global events.
Fraud and Manipulation – insider trading and market rigging remain risks.
Liquidity Risks – lack of buyers or sellers can affect market stability.
Regulatory Gaps – outdated regulations may fail to address new instruments.
Global Interconnectivity – crises in one market can affect others globally.
9. Recent Trends
Modern financial markets are evolving rapidly:
ESG Investing – focus on environmentally and socially responsible investments.
Digital Assets – growth of cryptocurrencies and tokenized securities.
Sustainable Finance – promoting green bonds and renewable energy projects.
Globalization of Markets – increased cross-border investments.
Financial Inclusion – mobile and digital platforms enabling wider participation.
10. Conclusion
Financial markets are the lifeblood of the global economy. They channel funds efficiently, provide investment opportunities, allow risk management, and drive economic growth. With technological advancements, regulatory oversight, and innovative instruments, financial markets continue to evolve, shaping the modern financial landscape.
Understanding these markets is crucial for investors, policymakers, and corporations to make informed decisions and navigate the complexities of the financial world.

Part 2 Trading Master Class Advantages of Option Trading
Leverage – Small capital controls large positions.
Flexibility – Strategies for any market condition.
Defined Risk (for buyers) – Maximum loss = premium.
Hedging Tool – Protects portfolios from crashes.
Income Generation – Through selling options (covered calls, spreads).
Risks in Option Trading
Time Decay – Value erodes quickly near expiry.
Unlimited Loss for Sellers – Naked option selling is very risky.
Volatility Crush – After events like results, volatility falls and option premiums collapse.
Liquidity Risk – Some contracts are illiquid, making exit difficult.
Psychological Stress – Options move very fast; requires discipline.

Part 3 Learn Institutional TradingCall Options & Put Options Explained
Options are of two types:
🔹 Call Option
Gives the right to buy an asset at a fixed price.
Buyers of call options are bullish (expect prices to rise).
👉 Example:
If Nifty is at 22,000 and you buy a 22,100 Call Option for ₹100 premium, you pay ₹100 × lot size (say 50) = ₹5,000.
If Nifty rises to 22,400, the 22,100 call is worth 300 points. Profit = (300 - 100) × 50 = ₹10,000.
If Nifty stays below 22,100, you lose only the premium ₹5,000.
🔹 Put Option
Gives the right to sell an asset at a fixed price.
Buyers of put options are bearish (expect prices to fall).
👉 Example:
If Bank Nifty is at 48,000 and you buy a 47,800 Put for ₹200 premium, lot size = 15.
If Bank Nifty falls to 47,000, option value = 800 points. Profit = (800 - 200) × 15 = ₹9,000.
If Bank Nifty stays above 47,800, you lose only premium = ₹3,000.
So:
Call = Bullish bet.
Put = Bearish bet.

Algorithmic & AI-Powered Trading1. Introduction: The Shift from Manual to Machine
For centuries, trading was purely a human skill — traders watched ticker tapes, read news, and relied on gut instinct. But as markets grew faster and more complex, human reaction time simply couldn’t keep up.
Enter algorithmic trading — a world where trades are executed in milliseconds, strategies are tested on decades of data, and human bias takes a back seat.
Over the past decade, Artificial Intelligence (AI) has supercharged this process.
Now, trading systems not only follow pre-set rules but also learn from market data, adapt strategies in real time, and detect patterns invisible to human eyes.
In 2025, over 70% of all equity trades in developed markets are algorithmic. In some markets, AI-powered systems handle more trading volume than humans.
2. What is Algorithmic Trading?
At its core, algorithmic trading is:
The use of computer programs to execute trades based on a defined set of rules and parameters.
Key features:
Rule-based execution: Trades are placed when certain conditions are met (e.g., price crosses moving average).
Speed & automation: No waiting for human clicks; execution is near-instant.
Backtesting: Strategies can be tested on historical data before risking real money.
Scalability: Can handle hundreds of trades simultaneously.
Example:
If a stock’s 50-day moving average crosses above its 200-day moving average, buy 100 shares. If the reverse happens, sell.
3. What is AI-Powered Trading?
AI-powered trading takes algorithms further:
Instead of pre-programmed rules, AI systems can learn patterns, adapt strategies, and make predictions based on data.
Core difference:
Algorithmic trading = fixed rules.
AI trading = adaptive, self-learning rules.
AI capabilities in trading:
Pattern recognition – spotting trends in price, volume, sentiment, or macro data.
Predictive modeling – forecasting future price movements.
Reinforcement learning – improving strategies based on feedback from trades.
Natural Language Processing (NLP) – reading and interpreting news, social media, and financial reports.
4. Types of Algorithmic & AI Trading Strategies
There’s a wide range of strategies — some decades old, others made possible only by modern AI.
A. Trend-Following Strategies
Based on technical indicators like Moving Averages, RSI, MACD.
Goal: Ride the trend up or down until it shows signs of reversal.
AI twist: Deep learning models can predict trend continuation probability.
B. Mean Reversion Strategies
Assumes prices will revert to an average over time.
Example: If a stock is far above its 20-day moving average, short it; if far below, buy.
AI twist: Machine learning models detect the optimal mean reversion window dynamically.
C. Arbitrage Strategies
Exploiting price differences between markets or instruments.
Example: If a stock trades at ₹100 in NSE and ₹101 in BSE, buy low, sell high instantly.
AI twist: AI can scan thousands of instruments and markets for fleeting arbitrage opportunities.
D. Statistical Arbitrage
Uses correlations between assets (pairs trading).
Example: If Reliance and ONGC usually move together, but Reliance rallies while ONGC lags, trade expecting convergence.
AI twist: AI can detect shifting correlations and adapt.
E. High-Frequency Trading (HFT)
Ultra-fast trades exploiting tiny inefficiencies.
Requires low-latency infrastructure.
AI twist: AI can dynamically adjust order placement to reduce slippage.
F. Sentiment Analysis Trading
Uses NLP to gauge market sentiment from news, tweets, blogs.
Example: AI detects a surge in positive sentiment toward Tesla, triggering a buy.
AI twist: Transformer-based NLP models (like GPT) can analyze sarcasm, tone, and context better than older keyword-based systems.
G. Market Making
Posting buy and sell orders to earn the bid-ask spread.
Requires continuous price adjustment.
AI twist: Reinforcement learning optimizes spread width for profitability.
5. Key Components of an Algorithmic/AI Trading System
Building a profitable system is more than just coding a strategy. It needs an ecosystem:
Market Data Feed
Real-time & historical prices, volumes, order book data.
AI needs clean, high-quality data to avoid bias.
Signal Generation
Algorithm or AI model generates buy/sell/hold signals.
Could be purely quantitative or include sentiment and fundamentals.
Execution Engine
Sends orders to the exchange with minimal delay.
AI can optimize execution to avoid market impact.
Risk Management Module
Position sizing, stop-loss levels, portfolio diversification.
AI can dynamically adjust risk based on volatility.
Backtesting Framework
Tests strategy on historical data.
Important: Avoid overfitting — making the model too perfect for past data but useless in the future.
Monitoring & Maintenance
Even AI needs human oversight.
Models can degrade if market behavior shifts (concept drift).
6. Role of Machine Learning in Trading
Machine Learning (ML) is the backbone of AI-powered trading.
Popular ML techniques in trading:
Supervised Learning – Train on historical prices to predict next-day returns.
Unsupervised Learning – Cluster stocks with similar price behavior.
Reinforcement Learning – Learn by trial and error in simulated markets.
Deep Learning – Use neural networks to detect complex patterns in large datasets.
Example:
A neural network could take in:
Price data
Volume data
News sentiment
Macroeconomic indicators
…and output a probability of the stock rising in the next 5 minutes.
7. Advantages of Algorithmic & AI Trading
Speed – Executes in milliseconds.
Accuracy – No fat-finger trade errors.
No emotional bias – Sticks to the plan.
Scalability – Monitors hundreds of assets.
24/7 markets – Especially useful in crypto trading.
Pattern discovery – Finds relationships humans might miss.
8. Risks & Challenges
Not everything is a profit paradise.
A. Technical Risks
System crashes
Internet outages
Latency issues
B. Model Risks
Overfitting to historical data
Concept drift (market behavior changes)
C. Market Risks
Sudden news events (e.g., black swan events)
Flash crashes caused by runaway algorithms
D. Regulatory Risks
Exchanges and regulators monitor algo trading to prevent manipulation.
Some AI strategies might accidentally trigger market manipulation patterns.
9. Risk Management in AI Trading
A robust system must:
Use position sizing (risk only 1-2% of capital per trade).
Place stop-loss & take-profit levels.
Have circuit breakers to halt trading if unusual volatility occurs.
Validate models regularly against out-of-sample data.
10. Backtesting & Optimization
Before deploying:
Data cleaning – Remove bad ticks, adjust for splits/dividends.
Out-of-sample testing – Use unseen data to test robustness.
Walk-forward testing – Periodically re-train and test.
Monte Carlo simulations – Stress-test strategies under random conditions.
11. Real-World Applications
Hedge Funds: Renaissance Technologies, Two Sigma.
Banks: JPMorgan’s LOXM AI execution algorithm.
Retail: Zerodha Streak, AlgoTrader.
Crypto: AI bots analyzing blockchain transactions.
12. Future Trends in AI Trading
Explainable AI – Making AI’s decision-making transparent.
Hybrid human-AI teams – AI generates signals; humans validate.
Quantum computing – Potentially breaking speed and complexity barriers.
Multi-agent reinforcement learning – AI “traders” competing/cooperating in simulations.
13. Conclusion
Algorithmic & AI-powered trading is no longer just a Wall Street tool — it’s accessible to retail traders, thanks to low-cost cloud computing, APIs, and open-source machine learning libraries.
The key to success isn’t just having an algorithm — it’s about data quality, model robustness, disciplined risk management, and constant adaptation.
Institutional Trading 1. Introduction – What Is Institutional Trading?
Institutional trading refers to the buying and selling of large volumes of financial instruments (like stocks, bonds, commodities, derivatives, currencies) by big organizations such as banks, mutual funds, hedge funds, pension funds, sovereign wealth funds, and insurance companies.
Unlike retail traders — who might buy 100 shares of a stock — institutional traders may buy millions of shares in a single transaction, or place orders worth hundreds of millions of dollars. Their size, resources, and market influence make them the primary drivers of global market liquidity.
Key points:
In most markets, institutional trading accounts for 70–90% of total trading volume.
Institutions often operate with special access, better pricing, and faster execution than retail investors.
Their trades are usually strategic and long-term (but not always; some institutions also do high-frequency trading).
2. Who Are the Institutional Traders?
The word institution covers a wide range of market participants. Let’s look at the main categories:
2.1 Mutual Funds
Pool money from retail investors and invest in diversified portfolios.
Focus on long-term investments in equities, bonds, or mixed assets.
Examples: Vanguard, Fidelity, HDFC Mutual Fund, SBI Mutual Fund.
2.2 Pension Funds
Manage retirement savings for employees.
Have very large capital pools (often billions of dollars).
Invest with a long horizon but still adjust portfolios for risk and return.
Examples: Employees' Provident Fund Organisation (EPFO) in India, CalPERS in the US.
2.3 Hedge Funds
Private investment partnerships targeting high returns.
Use aggressive strategies like leverage, derivatives, and short selling.
Often more secretive and flexible in trading.
Examples: Bridgewater Associates, Renaissance Technologies.
2.4 Sovereign Wealth Funds (SWFs)
Government-owned investment funds.
Invest in global assets for long-term national wealth preservation.
Examples: Abu Dhabi Investment Authority, Government Pension Fund of Norway.
2.5 Insurance Companies
Invest premium income to meet long-term policy payouts.
Prefer stable, income-generating investments (bonds, blue-chip stocks).
2.6 Investment Banks & Proprietary Trading Desks
Trade for their own accounts (proprietary trading) or on behalf of clients.
Engage in block trades, mergers & acquisitions facilitation, and market-making.
3. Key Characteristics of Institutional Trading
3.1 Large Trade Sizes
Institutional orders are huge, often worth millions.
Example: Buying 5 million shares of Reliance Industries in a single day.
3.2 Special Market Access
They often trade through dark pools or private networks to hide their intentions.
Use direct market access (DMA) for speed and control.
3.3 Sophisticated Strategies
Strategies often use quantitative models, fundamental analysis, and macroeconomic research.
Incorporate risk management and hedging.
3.4 Regulatory Oversight
Institutional trades are monitored by regulators (e.g., SEBI in India, SEC in the US).
Large holdings or trades must be disclosed in some jurisdictions.
4. Trading Venues for Institutions
Institutional traders do not only use public exchanges. They have multiple platforms:
Public Exchanges – NSE, BSE, NYSE, NASDAQ.
Dark Pools – Private exchanges that hide order details to reduce market impact.
OTC Markets – Direct deals between parties without exchange listing.
Crossing Networks – Match buy and sell orders internally within a broker.
5. Institutional Trading Strategies
Institutional traders use a mix of manual and algorithmic approaches. Here are some common strategies:
5.1 Block Trading
Executing very large orders in one go.
Often done off-exchange to avoid price slippage.
Example: A mutual fund buying ₹500 crore worth of Infosys shares in a single block deal.
5.2 Program Trading
Buying and selling baskets of stocks based on pre-set rules.
Example: Index rebalancing for ETFs.
5.3 Algorithmic & High-Frequency Trading (HFT)
Computer algorithms execute trades in milliseconds.
Reduce market impact, optimize timing.
5.4 Arbitrage
Exploiting price differences in different markets or instruments.
Example: Buying Nifty futures on SGX while shorting them in India if pricing diverges.
5.5 Market Making
Providing liquidity by continuously quoting buy and sell prices.
Earn from the bid-ask spread.
5.6 Event-Driven Trading
Trading based on corporate actions (mergers, acquisitions, earnings announcements).
6. The Role of Technology
Institutional trading has transformed with technology:
Low-latency trading infrastructure for speed.
Smart Order Routing (SOR) to find best execution prices.
Data analytics & AI for predictive modeling.
Risk management systems to control exposure in real-time.
7. Regulatory Environment
Regulation ensures that large players don’t unfairly manipulate markets:
India (SEBI) – Monitors block trades, insider trading, and mutual fund disclosures.
US (SEC, FINRA) – Requires reporting of institutional holdings (Form 13F).
MiFID II (Europe) – Improves transparency in institutional trading.
8. Advantages Institutions Have Over Retail Traders
Lower transaction costs due to volume discounts.
Better research teams and data access.
Advanced execution systems to reduce slippage.
Liquidity access even in large trades.
9. Disadvantages & Challenges for Institutions
Market impact risk – Large trades can move prices against them.
Slower flexibility – Committees and risk checks delay quick decision-making.
Regulatory restrictions – More compliance burden.
10. Market Impact of Institutional Trading
Institutional trading shapes the market in multiple ways:
Liquidity creation – Large orders provide continuous buying/selling interest.
Price discovery – Their research and trades help set fair prices.
Volatility influence – Bulk exits or entries can cause sharp moves.
Final Thoughts
Institutional trading is the engine of modern financial markets. It drives liquidity, shapes price movements, and often sets the tone for market sentiment. For retail traders, understanding institutional behavior is crucial — because following the “smart money” often gives an edge.
If you want, I can also create a visual “Institutional Trading Flow Map” showing how orders move from an institution to the market, including exchanges, dark pools, and clearinghouses — it would make this 3000-word explanation more practical and easier to visualize.
Global Macro Trading1. Introduction to Global Macro Trading
Global macro trading is like playing chess on a planetary board.
Instead of just focusing on a single company or sector, you’re watching how the entire world economy moves—tracking interest rates, currencies, commodities, geopolitical tensions, and policy changes—then placing trades based on your macroeconomic outlook.
At its core:
“Macro” = Large-scale economic factors
Goal = Profit from broad market moves triggered by these factors.
It’s the domain where George Soros famously “broke the Bank of England” in 1992 by shorting the pound, and where hedge funds like Bridgewater use economic cycles to decide positions.
2. The Philosophy Behind Global Macro
The idea is simple: economies move in cycles—boom, slowdown, recession, recovery.
These cycles are driven by:
Interest rates
Inflation & deflation
Government policies
Trade balances
Currency strength/weakness
Geopolitical events
Global macro traders seek to anticipate big shifts—not just day-to-day noise—and bet accordingly.
The moves are often multi-asset: FX, commodities, equities, and bonds all come into play.
3. Key Tools of the Global Macro Trader
Global macro traders don’t just glance at charts—they build a full “global dashboard” of indicators.
A. Economic Data
GDP Growth Rates – Signs of expansion or contraction.
Inflation – CPI, PPI, and core inflation measures.
Employment data – Non-farm payrolls (US), unemployment rates.
Purchasing Managers Index (PMI) – Early signal of economic health.
Consumer Confidence – Sentiment as a leading indicator.
B. Central Bank Policy
Interest Rate Changes – Fed, ECB, BoJ, RBI decisions.
Quantitative Easing/Tightening – Money supply adjustments.
Forward Guidance – Central bank speeches hinting future moves.
C. Market Sentiment
VIX (Volatility Index)
COT (Commitment of Traders) reports
Currency positioning data
D. Geopolitical Risks
Wars, sanctions, trade disputes.
Elections in major economies.
Energy supply disruptions.
4. Core Instruments Used in Global Macro
Global macro traders use multiple asset classes because economic trends ripple across markets.
Currencies (FX) – Betting on relative strength between nations.
Example: Shorting the yen if Japan keeps rates ultra-low while the US hikes.
Government Bonds – Positioning for rising or falling yields.
Example: Buying US Treasuries in risk-off conditions.
Equity Indices – Long or short entire markets.
Example: Shorting the FTSE 100 if UK recession fears rise.
Commodities – Crude oil, gold, copper, agricultural goods.
Example: Long gold during geopolitical instability.
Derivatives – Futures, options, and swaps to hedge or leverage.
5. Styles of Global Macro Trading
Global macro is not one-size-fits-all. Traders pick different timeframes and strategies.
A. Discretionary Macro
Human-driven decision-making.
Uses news, analysis, and gut instinct.
Pros: Flexibility in unusual events.
Cons: Subjective, emotional bias risk.
B. Systematic Macro
Algorithmic, rules-based.
Uses historical correlations, signals.
Pros: Discipline, backtesting possible.
Cons: May miss sudden regime changes.
C. Event-Driven Macro
Trades around specific catalysts.
Examples: Brexit vote, OPEC meeting, US elections.
D. Thematic Macro
Focuses on big themes over months or years.
Example: Betting on long-term dollar weakness due to US debt growth.
6. Fundamental Analysis in Macro
Here’s how a macro trader might think:
Example: US Interest Rates Rise
USD likely strengthens (carry trade appeal).
US Treasuries yields rise → prices fall.
Emerging market currencies weaken (capital flows to USD).
Gold may fall as yield-bearing assets look more attractive.
The chain reaction thinking is key—every macro event has a ripple effect.
7. Technical Analysis in Macro
While fundamentals set the direction, technicals help with timing.
Moving Averages – Identify trend direction.
Breakouts & Support/Resistance – Confirm market shifts.
Fibonacci Levels – Gauge pullback/reversal zones.
Volume Profile – See where major players are active.
Intermarket Correlation Charts – Compare FX, bonds, and commodities.
8. Risk Management in Macro Trading
Macro trades can be big winners—but also big losers—because they often involve leverage.
Key principles:
Never risk more than 1–2% of capital on a single trade.
Diversify across asset classes.
Use stop-loss orders.
Hedge positions (e.g., long oil but short an oil-sensitive currency).
9. Examples of Historical Macro Trades
A. Soros & the Pound (1992)
Bet: UK pound overvalued in the ERM.
Action: Shorted GBP heavily.
Result: £1 billion profit in one day.
B. Paul Tudor Jones & 1987 Crash
Used macro signals to foresee stock market collapse.
Went short S&P 500 futures.
C. Oil Spike 2008
Many traders went long crude as supply fears rose and USD weakened.
10. The Global Macro Trading Process
Macro Research
Economic releases, policy trends, historical cycles.
Hypothesis Building
Example: “If the Fed keeps rates high while ECB cuts, EUR/USD will fall.”
Instrument Selection
Pick the cleanest trade (FX, bonds, commodities).
Position Sizing
Based on risk tolerance and conviction.
Execution & Timing
Use technicals for entry/exit.
Monitoring
Constantly reassess as data comes in.
Exit Strategy
Profit targets and stop-losses in place.
Final Takeaways
Global macro trading is the Formula 1 of financial markets—fast, complex, and requiring mastery of multiple disciplines.
Success depends on:
Staying informed.
Thinking in cause-and-effect chains.
Managing risk religiously.
Being adaptable to changing regimes.
A disciplined global macro trader can profit in bull markets, bear markets, and everything in between—because they’re not tied to one asset or region.
Instead, they follow the money and the momentum wherever it flows.
Smart Liquidity 1. Introduction: The Evolution of Liquidity
Liquidity is the lifeblood of financial markets. It allows assets to be bought and sold efficiently, ensuring price discovery and market stability. In traditional markets, liquidity is provided by centralized exchanges and institutional market makers. However, with the rise of digital assets, decentralized finance (DeFi), and advanced market analytics, a new paradigm has emerged: Smart Liquidity.
Smart liquidity refers to dynamic, data-driven, and automated systems that intelligently provide, manage, and optimize liquidity across trading environments. These systems operate in both centralized and decentralized contexts and are increasingly critical in high-frequency trading, DeFi protocols, algorithmic execution, and risk management.
2. The Traditional View of Liquidity
Before understanding what makes liquidity “smart,” we need to understand how traditional liquidity functions:
2.1 Key Types of Liquidity
Market Liquidity: The ability to quickly buy/sell an asset without significantly affecting its price.
Funding Liquidity: The ease with which traders can access capital to maintain positions.
Order Book Liquidity: The depth and spread of buy/sell orders at different price levels.
2.2 Role of Market Makers
In traditional markets, liquidity is largely provided by market makers — firms that post both buy and sell orders to profit from the bid-ask spread while ensuring the market remains active.
2.3 Limitations
High latency and slippage
Centralized control and opacity
Inflexibility during volatility
Capital inefficiency (idle funds)
3. The Need for Smart Liquidity
Modern markets are becoming more fragmented, automated, and data-intensive. This has created the need for a smarter, more adaptive form of liquidity. Here's why:
Decentralized Finance (DeFi) lacks centralized market makers.
High-frequency trading (HFT) demands millisecond-level execution.
Liquidity fragmentation across exchanges reduces capital efficiency.
Risk-sensitive environments need real-time capital allocation.
Smart liquidity offers automated, algorithmic, real-time solutions that adapt to market conditions and improve liquidity provisioning across platforms.
4. Defining Smart Liquidity
Smart Liquidity is the use of data science, AI/ML algorithms, automated protocols, and blockchain mechanisms to efficiently manage, allocate, and provide liquidity in dynamic trading environments.
It encompasses:
Smart Order Routing
Algorithmic Market Making (AMM)
On-chain Liquidity Pools
Flash Loans and Arbitrage Bots
Cross-chain Liquidity Bridges
AI-driven Liquidity Mining
Real-Time Volume & Volatility-Based Liquidity Adjustment
5. Core Components of Smart Liquidity Systems
5.1 Smart Order Routing (SOR)
Finds the best price across multiple venues (CEXs and DEXs).
Breaks orders intelligently to minimize slippage.
Enables volume-weighted execution across fragmented markets.
5.2 Algorithmic Market Making
Unlike human market makers, AMMs use mathematical formulas to determine prices.
Popular in DeFi platforms like Uniswap, Balancer, and Curve.
Examples:
Uniswap v2 uses a constant product formula: x * y = k.
Uniswap v3 introduces concentrated liquidity, letting LPs provide liquidity in custom price ranges.
5.3 On-Chain Liquidity Pools
Smart contracts that hold funds for automatic swaps.
Provide decentralized access to liquidity.
Liquidity providers earn fees and token rewards.
5.4 Flash Loans and Arbitrage Bots
Provide instantaneous liquidity for arbitrage or liquidation.
Can balance prices across DEXs within seconds.
Require no collateral if repaid within the same transaction block.
5.5 Liquidity Bridges
Enable cross-chain transfers of liquidity (e.g., Ethereum ↔ Solana).
Essential for a multichain DeFi ecosystem.
Smart liquidity bridges include Synapse, Multichain, and LayerZero.
5.6 AI-Driven Liquidity Management
Predictive analytics to deploy liquidity where demand is rising.
Machine learning models assess trading volume, volatility, and user behavior.
Enables auto-rebalancing and capital optimization.
6. Smart Liquidity in DeFi: The Game-Changer
Decentralized Finance (DeFi) has redefined how liquidity is created and accessed. Smart liquidity protocols eliminate intermediaries and allow anyone to become a liquidity provider (LP).
6.1 How AMMs Revolutionized Liquidity
Traditional order books are replaced by liquidity pools.
Users swap assets directly from pools.
Prices are set algorithmically based on pool balances.
6.2 Key Platforms
Platform Smart Liquidity Feature
Uniswap v3 Concentrated liquidity, range orders
Curve Finance Efficient swaps for stablecoins
Balancer Multiple tokens per pool with custom weightings
PancakeSwap AMM for Binance Smart Chain
dYdX Decentralized perpetual trading with smart liquidity
6.3 Incentives for LPs
Trading fees
Liquidity mining rewards
Governance tokens (e.g., UNI, CRV)
7. Smart Liquidity in Centralized Markets
Even centralized exchanges and institutions use smart liquidity tools.
7.1 Institutional Smart Liquidity Solutions
Dark Pools: Hidden order books to reduce market impact.
Execution Algorithms: TWAP, VWAP, Iceberg Orders, etc.
Smart Execution Management Systems (EMS): Integrate data feeds, real-time news, and order flow analytics.
7.2 Proprietary Trading Firms
Use AI models to:
Predict order book imbalance.
Automate market making.
React to news in milliseconds.
8. Risks and Challenges
Despite its potential, smart liquidity systems have their own vulnerabilities:
8.1 Impermanent Loss
Occurs in AMMs when price divergence between tokens in a pool leads to unrealized losses.
8.2 Smart Contract Risks
Bugs or hacks in DeFi protocols can lead to loss of funds.
8.3 Front-running and MEV (Miner Extractable Value)
Bots exploit transaction ordering for profit.
Can lead to unfair trading conditions.
8.4 Liquidity Fragmentation
Cross-chain systems may split liquidity across protocols, reducing efficiency.
8.5 Regulatory Uncertainty
DeFi and smart liquidity tools often operate in gray areas of financial regulation.
9. Case Studies: Smart Liquidity in Action
9.1 Uniswap v3
LPs can select specific price ranges.
Capital is more efficiently used.
Offers active vs passive liquidity strategies.
9.2 Chainlink’s Smart Liquidity Feeds
Real-time price oracles to protect against volatility.
Used in lending and stablecoin protocols.
9.3 Flash Loan Arbitrage (Aave + Uniswap)
Borrow millions with no collateral.
Arbitrage price differences across DEXs.
All within one transaction.
10. The Role of Data and AI in Smart Liquidity
10.1 Predictive Liquidity Deployment
AI models forecast:
Which token pairs will surge.
Where to deploy capital.
Risk-adjusted returns.
10.2 Real-Time Monitoring Tools
Heatmaps, volume spikes, order flow analytics.
Tools like Nansen, Dune Analytics, DefiLlama, etc.
10.3 NLP for News-Based Liquidity Adjustment
AI reads news headlines and adjusts trading decisions.
Conclusion
Smart liquidity represents a transformative leap in how capital flows within financial systems. By integrating data science, AI, blockchain technology, and financial engineering, it enables more adaptive, efficient, and democratized liquidity provisioning.
Whether in traditional finance, decentralized ecosystems, or future cross-chain platforms, smart liquidity will play a pivotal role in shaping tomorrow’s financial markets. For traders, investors, protocols, and institutions alike, understanding and leveraging smart liquidity is no longer optional — it's essential.
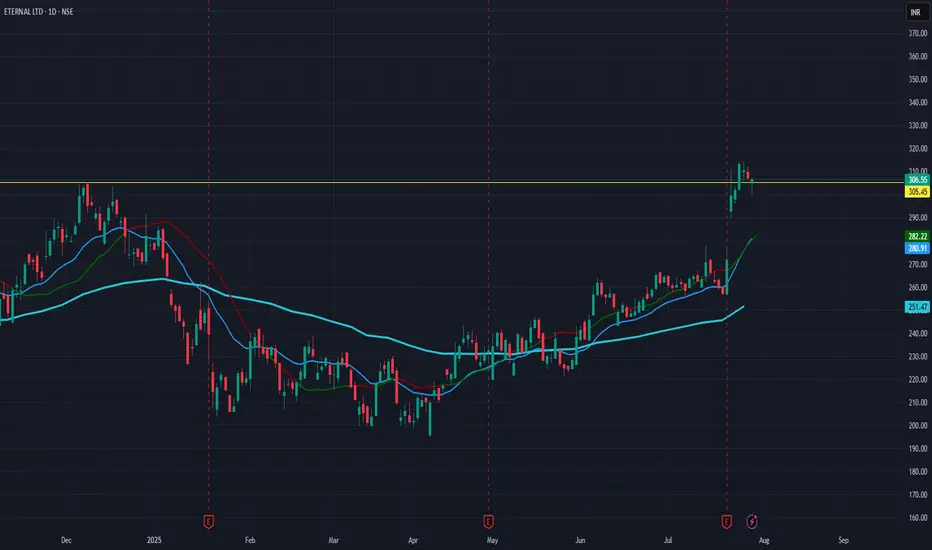
Eternal: From Turnaround to Trend – Is ₹350+ the Next Stop?Eternal ( NSE:ETERNAL ) has been on a remarkable journey, transforming its financials and catching the eye of institutional investors. Despite a slight dip today, its impressive growth and unique shareholding structure raise a critical question: Is this just the beginning, or has the market overvalued its potential? Let's dive in.
Current Snapshot:
Price: ₹306.55 (-0.24% today)
Market Cap: ₹2,95,832 Cr (Significant player)
Key Question: Sustained growth phase or overbought?
Shareholding Insights (June 2025):
A truly unique aspect is Eternal's 0% promoter holding, suggesting a professionally managed entity driven by big money.
FIIs: Dominant 42.34% (Strong international confidence)
DIIs: Substantial 26.59%
Public: 7.04%
Others: 24.04%
Implication: Stock movements heavily influenced by large fund flows.
Financial Turnaround - A Glimpse:
Eternal's recent financial performance shows a significant shift:
Sales: Surged from ₹12,114 Cr (Mar 2024) to ₹20,243 Cr (Mar 2025)
Operating Profit: Exponential leap from ₹42 Cr to ₹637 Cr
OPM%: Jumped from 0% to 3%
Net Profit: Rose from ₹351 Cr to ₹527 Cr
Cash Flow (Mar 2025): Healthy ₹357 Cr (vs. ₹91 Cr in Mar 2024)
Investing Activities: ₹-7,993 Cr (Mar 2025) vs. ₹-348 Cr (Mar 2024) - Suggests significant capital deployment for future growth.
Balance Sheet Strengthening: Reserves & Surplus, and Total Assets showing strong growth.
Valuation & Returns:
P/E Ratio: Not listed (implies negative earnings or non-traditional valuation)
Dividend Yield: 0%
Market Focus: Valuation likely based on future growth prospects & asset play.
Investment Returns: +2.25% (last week), +35.11% (last year) - Strong positive sentiment.
Delivery Volume - Accumulation in Progress?
Monthly delivery data points to high investor interest and potential accumulation:
July 2025: +16.34% price gain, 45.10% delivery
June 2025: +10.84% price gain, 54.30% delivery
April 2025: +15.28% price gain, 46.48% delivery
March 2025: -9.19% price dip, but high 57.29% delivery.
Interpretation: Consistent high delivery suggests long-term holding, indicating strong underlying demand.
Technical Outlook - Bullish Momentum:
Eternal's recent price action, especially the gains in April, June, and July, combined with high delivery percentages, signals strong bullish momentum.
Current Price: ₹306.55
Uptrend: Consistent positive monthly returns (except March and January).
Technical Health: High delivery volume alongside price appreciation is a very healthy sign, indicating conviction behind the moves.
Potential Target: From a technical perspective, Eternal looks very strong and appears to have the potential to reach ₹350+ soon.
Real Talk: Navigating the Growth Story
For Traders:
This looks like a classic momentum play. Riding the trend with disciplined trailing stop losses will be key. Keep an eye on delivery percentages – a significant drop alongside price dips could signal a shift in institutional sentiment.
For Investors:
The turnaround story and strong institutional backing are compelling. However, the 0% promoter holding means external forces (FII/DII sentiment) will heavily dictate its trajectory. Long-term investors should dig deeper into the business model and future growth drivers. Given the strong technical indicators pointing towards ₹350+, this could be an attractive entry point for those who believe in the broader growth narrative.
Your thoughts? Would you jump into this high-momentum, institutionally-driven growth story, anticipating the suggested technical upside, or wait for more traditional valuation metrics to emerge?
Zomato- Chart Analysis - UpdateZomato CMP:259.95; RSI:62.38;
Gap created on charts is re-claimed. Any intraday down-swing below the 245 should be brought till the level of 235. At this point the weak hands in the scripts are removed in last 2 -3 weeks of consolidation. This gives a good opportunity for re-entry into the stock.
Re-entry-level: between 234 – 245
Near Term Target: 285-290;
Target 1: 309 ( 2 months)- Strech target: 345 -370
Stop Loss-229 (on closing basis)
✅ For more trading ideas like this, please like, share, and follow my Idea Stream ✅


ZOMATO#ZOMATO
- WAIT FOR COMPLETE THE CHART PATTERN
- BEFORE INVESTING
- Short Prosition
- BRACK THE gapfilling line

SENSEX Levels // 2 Hours
Hello Everyone 👋
Support Levels:
First Support: 80,950
Second Support: 80,700
Third Support: 80,450
Resistance Levels:
First Resistance: 81,200
Second Resistance: 81,450
Third Resistance: 81,700
These levels are derived from technical analysis and can help identify potential entry and exit points for trading

ZOMATO WEEKLY PROJECTIONWatching this major resistance zone between 160 - 168, previously the price saw a major fall from this area, so we can expect a correction to 120Rs.
Important - this is not a financial advice, kindly do your own research before trading or investing.

ROUNDING BOTTOM BREAKOUT IN ZOMATOStock gave breakout of rounding bottom price action pattern and also recently company declared net profit of 36 Cr.
Entry - 123 to 125
Target - 165.55
Stoploss - 101.65
This is not a buy or sell call, analysis is shared for educational purpose.

Zomato's Growth Odyssey: Breaking Boundaries from 115 to 135 RsTrade Idea: With the current price at 116.50 Rs, if the Zomato stock manages to breach the immediate resistance levels(115 Rs), the next target is set at 125 Rs. This milestone could potentially be achieved within a span of 8-10 days. Following this accomplishment, the price might briefly touch around 135 Rs in approximately 2-3 week.
Note: Implement a well-defined stop-loss strategy to manage risk effectively.
1st Target --> 125 Rs
2nd Target --> 135 Rs
3rd Target --> in next post
Thanks,
Kambi

Zomato Weekly nalaysis Loosk Bigiies has bought zomato last weZomato Weekly nalaysis
Loosk Bigiies has bought zomato last week
Buy CMP 55
target 78- 90- 100- 140- 180- 220-260+
time duration 2-3 years
add more if get @ 40 rs range
SL below 25 candle closing basis

ZOMATO BREAKOUTzomato released a breakout.Looking for price to reach 100 and more upside, as we did broke the weekly resistance zone.

Zomato falling in triangle Zomato falling in triangle
After long fall
Just wait and watch for triangle breakout.
It's an analysis, not a trading advice, trade with your due diligence.
