XLM Bullish ScenarioXLM seems to be following a bullish gartley pattern. Retracement of xlm is expected and might bounce at the 0.786 retracement. The stop loss is already provided.
Crypto market


Bitcoin Technical Analysis - Monthly#Elliottwave analysis for #Bitcoin ( CRYPTOCAP:BTC ) provides a framework to understand potential price movements based on past patterns. However, given the #Crypto market's unique characteristics, it should be used in conjunction with other analytical tools. The current analyses suggests optimism for continued growth, but with caution for potential corrections or consolidations before reaching new highs.
Hear is a Char for your reference

BTC sellDowntrend
The crowd sees the price hitting the lower wedge and buys up.
At the market open in the morning, the price rises, attracting buyers.
The crowd is wrong when a confirmation candle appears.
Enter a quick trade.
RR 1:1, take it immediately to maintain a high win rate.

BTC LONGI initiated a long position in BTC based on a confluence of key technical factors. The price entered a well-defined demand zone, indicating strong buying interest and potential reversal. Additionally, the presence of an Imbalance-Filled Value Gap (IFVG) signaled institutional activity and inefficiencies in price structure, enhancing the probability of bullish continuation. This setup aligns with high-probability trading principles, where liquidity zones and market inefficiencies offer asymmetric risk-reward opportunities. Risk management remains paramount, with stop-loss placement below structural invalidation levels to mitigate downside risk. The trade aims to capitalize on institutional order flow and market structure dynamics for optimal execution.

OMUSDT(mantra) strong upmove on chartsOMUSDT from the current levels very bullish. Targets wont come in one day but it will come. Follow the post. will keep posting the small small but good target trades based on daily price action. This is long long term view. Same kind of prediction i have done for XRP too and look at it 10 times move from there. Mantra OM is fundamentally strong coin too so dont ignore this view. Expecting atleast 200% return from here in this coin.

PEPE cycleALL You have to know is in this chart
We're in bottom of pepe super cycle's wave 4
Just ALL IN and get out at 14/12/2025.
Don't complicate things!

BTC Buying positionWe may enter and exit as per the given analysis. BTC has taken a major support in 30 min chart and consolidation, trapping sellers to move up as per the given levels in the drawing.

Trading vs. Investing: Which Strategy Suits You Best?Trading vs. Investing: Which One is Right for You?
Hello everyone! I hope you're all doing great in life and in your trading journey. Today, I am bringing an educational post on Trading vs. Investing , two different approaches to making money in the stock market. While both have their advantages, choosing the right one depends on your goals, risk appetite, and strategy . Let’s dive into the key differences and find out which style suits you best!
Trading vs. Investing: Key Differences
Time Horizon:
Traders aim for short-term profits , holding positions for minutes, hours, or days .
Investors hold stocks for months or years , focusing on long-term wealth creation .
Strategy & Approach:
Traders rely on technical analysis, charts, and price patterns to make quick decisions .
Investors focus on fundamental analysis , looking at company earnings, management, and growth potential .
Risk & Reward:
Trading is high risk but can offer quick returns if executed well.
Investing involves lower short-term risk but requires patience for long-term gains .
Capital & Leverage:
Traders often use margin and leverage to amplify gains (but also risk higher losses ).
Investors generally avoid leverage , focusing on steady capital appreciation .
Emotional Discipline:
Trading requires quick decision-making and emotional control to handle volatility .
Investing demands patience and the ability to ignore short-term market fluctuations .
Who Should Choose What?
✔ Choose Trading if: You prefer fast decision-making, market analysis, and short-term gains .
✔ Choose Investing if: You have patience, believe in long-term wealth building, and prefer lower risk .
✔ Hybrid Approach: Many successful market participants combine both strategies , trading for short-term profits and investing for long-term growth .
Outcome:
Both trading and investing have their place in the market. There’s no one-size-fits-all approach —the key is understanding your risk tolerance, time commitment, and financial goals .
Which one do you prefer? Trading, Investing, or Both? Let me know in the comments!

ENAUSDT big target visible.ENA has very big target visible on the chart. very good accumulation zone. Keep adding in the trades. It can even blast upto 5 too.

BTC is getting ready for the bigger moveBTC getting ready for the bigger move. On weekly timeframes it's still bullish. Retracing on the higher level of fib. Short term short is fine but do not get trapped in this bulls trap.

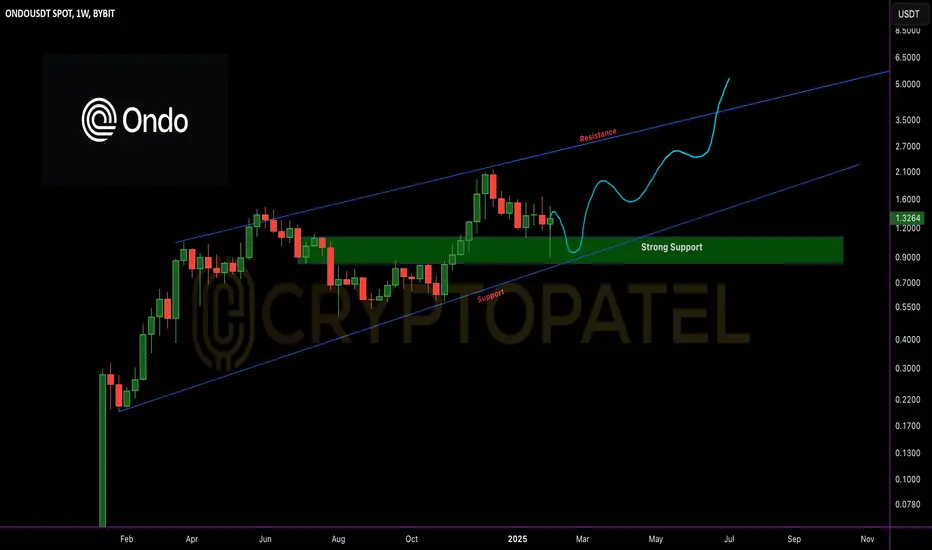
$ONDO $10 Potential in Current bull Market so What Best Entry?CRYPTOCAP:ONDO to $5 is HIGHLY PROBABLE this bull run.
$10? Possible. But $5 looks like a SAFE TARGET. 🎯
Best entry? Around $1 🔥
OMUSDT - TRIANGLE BREAKOUTSymbol - OMUSDT
OMUSDT is a noteworthy asset in the current market context, as it stands out as one of the few coins exhibiting bullish momentum while many altcoins are experiencing successive declines. The situation may be partially influenced by BTCUSD, should Bitcoin undergo a more significant downturn, this could impact the broader market, as no asset would be immune. However, locally, Bitcoin appears to be forming a resistance breakout. If the bullish trend persists, OMUSDT could find a catalyst to support its upward movement.
At present, attention is focused on the resistance level of the triangle pattern and the base of the 5.6755 structure. Two potential bullish scenarios should be considered: growth following a breakout above resistance or a rebound after a false breakdown of support.
Resistance levels: 5.9822, 6.3000
Support levels: 5.7500, 5.6755
Currently, the price is consolidating within the bounds of the triangle. However, once the resistance is broken, the market may enter a realization phase, with a potential sharp upward impulse. Beyond the 6.3000 level, there are no significant resistance levels to be encountered.

BTC#13: Market Shaking! Where is BTCUSDT Price? 💎 💎 💎 As predicted in the previous article, the price touched the H1 trendline zone and then had a correction back to the 96K support zone. Now we will continue to plan for BTC 💎 💎 💎
1️⃣ **Fundamental analysis:**
📊Maryland, the United States plans to establish a strategic Bitcoin reserve fund
🔹US non-farm payrolls increased by 143,000 in January, lower than expected;
🔹Trump plans to announce retaliatory tariffs as early as Friday
🚀 Interest rate futures traders expect the Fed to make another rate cut in May
📌 Overall, the current fundamentals are still supporting BTC's upside potential. However, market liquidity is still being affected by Trump's tariff policies and potential future trade wars from these policies
2️⃣ **Technical analysis:**
🔹 **D frame**: A long-tailed pinbar appeared when the price reached the 99K resistance zone. However, the 96K support zone is still doing its job well. For a clearer view, we will evaluate the smaller time frames
🔹 **H4 frame**: The bearish price structure is still intact with no signs of change.
🔹 **H1 frame**: Although the bearish price structure was broken, it immediately turned down. The price reaction at the current support area is weak.
3️⃣ **Trading plan:**
⛔ Looking at the multi-frame price structure, it can be seen that this is not a suitable time to establish a BUY position. Basic information from the market is also showing concern about the upcoming tariff policy. If there is a change in the price structure from H1, then this possibility should be considered.
✅ Trading with the trend is still the top priority, 2 pinbars in time frame D also show that the market sentiment is leaning towards the bears.
💪 **Good luck trading!**

Bitcoin Weekly Analysis & Market Maker StrategyBitcoin Weekly Analysis & Market Maker Strategy
Bitcoin has officially entered the declining phase of the W-cycle. As of now, this downtrend has been in play for seven weeks. However, even within a downtrend, the market does not move in a straight line—there are always liquidity grabs and retracement rallies before the next leg down. These temporary upside corrections are where market makers execute their moves.
Key Price Levels to Watch
Current retracement zones within this descending structure are projected at $100K, $105K, and $102K, with additional lower adjustment levels expected in the future.
This means that Bitcoin is not ready for a sustained uptrend yet. Structurally, BTC needs time to consolidate, accumulate liquidity, and shake out weak hands before the next bullish leg of the W-cycle. This process is estimated to take 2-3 months before BTC resumes its macro uptrend.
For now, BTC’s operational range is expected to be between FWB:88K - $99K, forming a base before continuation. Lower zones to monitor for potential deeper corrections include $85K and the $70K range.
Market Maker Playbook: Strategic Execution
1️⃣ For Leverage Traders: Shorting the Retracement Peaks
This is not the time to long BTC. Instead, focus on:
✅ Short-selling BTC at liquidity zones where price spikes into new highs on lower time frames (H4, D1).
✅ Combining BTC shorts with bearish Altcoins that are following similar corrective structures.
✅ Being highly tactical—market makers trap retail traders in these fakeouts before the next move.
2️⃣ For Spot Traders: Rotational Plays in Altcoins
For those trading spot:
✅ Use BTC’s D1 corrective phase to accumulate select Altcoins for short-term swing trades.
✅ Target 30%-50% gains, keep risk tight, and exit before liquidity dries up.
✅ Monitor BTC.D (Bitcoin Dominance Index)—once BTC.D tops out and starts declining, rotate into strong Altcoins that are structurally preparing for the 2025 Altcoin supercycle.
3️⃣ Adapting Like a Market Maker
The game is about liquidity, not direction. Let the market come to your zones instead of chasing trades. Position with precision. Execute with conviction. And most importantly—think ahead of the herd.
🔥 Bottom Line: This is a trader’s market, not a holder’s market (yet). Stay sharp, position smartly, and capitalize on market inefficiencies like a true market maker.

Bitcoin in range buy on dip and sell on rise both working Last week premium members booked huge profit
Gold 2150 points profit
Silver 2500 points profit
Copper 28 points profit
Natural gas 12 points.
Zinc 2 points.
Crude 150 points
How to take trades using Harmonic pattern projection Trade setup is explained below :-
1st D point : 0% is recent top or bottom.
2nd D Point : 13.5% is work as trailing SL of buy or sell trade if hit then we have to book profit
.If price goes below 13.5% then early or risky traders can reversal trade ,
Safe traders can wait for 27% levels break
Targets :
Target T1 is 27.3% if you are taken entry from 13.5% if taken entry from 27.3 then Target T1: 38.2 % level is our 1st Target
( 38.2% if also a reversal zone so if price reverse then we can make fresh entry also).
T2: 50% level is our 2nd Target
T3: 61.8% to 65 % is our 3rd Target
( This is also reversal zone so we have to book profit at this area and if break then take fresh entry with SL of 2nd Target 50% .)
Next Targets are 78.6 % , 88.9 % 100% , 113.5 % , 127.2% , 141.5% and 161.8% to 165%.
161.8 to 165% if profit booking area so book full profit and wait for reversal.
How to take reversal trade :
If price going upside/ downside then then buy or sell levels appear on Chart ( Automatically show when price reach any reversal zone of harmonic projection pattern based .
After showing reversal levels wait for confirmation until 13.5 % or 27 .6 % level not break if break then exit from current buy / sell trade and take fresh reverse trade buy/ sell .
Trailing SL:
After reach 1st Target trail SL to just above or below cost ( for example we are holding sell trade from 100 1st Target 110 hit then move trailing sl to 104-105 and move SL as price move upside or Downside)
Blue Line is 1st support/ Resistance
Green line is 2nd support/ resistance
Red line is 3rd Support/ resistance

BTC Becomes a National Reserve Asset, What’s the Best Investment
In the near future, BTC Dominance (BTC.D) might fluctuate, but currently, Bitcoin holds over 60% of the crypto market capitalization. This means that if the total market cap is $3 trillion, BTC alone accounts for $1.8 trillion. With this level of dominance, institutional investors and financial institutions primarily focus on Bitcoin, treating it as the core of the crypto market.
What If Bitcoin Becomes a National Reserve Asset?
If countries start holding BTC as a reserve asset—similar to gold—its long-term value could skyrocket. Bitcoin would shift from being a speculative asset to becoming a crucial part of the global financial system.
So, how should you adjust your investment strategy in this scenario?
Prioritize BTC: Allocate at least 60-70% of your portfolio to BTC, as it would be the safest and most valuable asset in the crypto space.
Keep ETH & BNB: Even if BTC is recognized as a reserve asset, Ethereum and Binance Smart Chain will still have strong utility, making ETH and BNB worth holding.
Be Selective with Altcoins: A BTC-dominated market will filter out weak Altcoins. Only invest in fundamentally strong projects with real-world use cases.
In short, if Bitcoin is widely accepted as a reserve asset, the crypto market will mature and stabilize. Investors need to adapt, follow global trends, and adjust their portfolios to maximize returns in this new era.

BUY SCRUSDT - Short-Term Trade Opportunity🚀 BUY SCRUSDT - Short-Term Trade Opportunity
📢 SCRUSDT is setting up for a strong move – A short-term accumulation play!
📌 Trade Setup & Market Outlook
✔ SCR is in a favorable accumulation zone, presenting a good risk-reward opportunity.
✔ Short-term price structure suggests an upcoming breakout.
📌 Trade Plan:
Entry Point: $0.57 - $0.63, or lower if possible.
Target: $1.0 - $1.2.
Hold Time: 1 - 3 weeks.
💡 Note:
Monitor volume and momentum indicators for confirmation.
Take profit in phases to secure gains.
Use stop-loss strategies to manage downside risk.
🔥 SCRUSDT is primed for a short-term move – Time your entries wisely! 🚀

SHIB USDTSHIBA is on a crazy weekly support.
We can see a uptrend soon in #SHIBA (Market Conditions are Good)

Bitcoin consolidating within a 4-hour symmetrical triangle Bitcoin is currently consolidating within a 4-hour symmetrical triangle pattern.
Bullish Scenario: A breakout to the upside would require Bitcoin to clear the key supply zone between $103.8K - $105.6K. If this resistance is taken out, bullish momentum could accelerate as indicated by the green pathway.
Bearish Scenario: If Bitcoin fails to hold the current demand zone, a breakdown from the pattern is likely. In this case, the price could decline toward the $77K - $75K demand zone, which aligns with the existing CME gap in that region. The red pathway illustrates this potential price action.
This is not financial advice, but a mere scenario of what could play out based on market structure and order-blocks.

BUY SPOT HIVEUSDT (D1 Trade Setup)🚀 BUY SPOT HIVEUSDT (D1 Trade Setup)
📢 HIVEUSDT presents a short-term opportunity – Ride the D1 wave before the next drop!
📌 Trade Setup & Market Outlook
✔ HIVE is flashing a buy signal on the 1W timeframe, indicating a potential short-term bounce before further downside.
✔ The strategy is to capitalize on the D1 uptrend before taking profit.
📌 Trade Plan:
Entry Point: $0.20 or based on the provided structure in the chart.
Target: $0.50.
Hold Time: 1 - 2 weeks.
💡 Key Considerations:
Monitor breakout confirmations to adjust your position accordingly.
Exit before the expected correction to lock in profits.
Use risk management strategies to protect capital.
🔥 HIVEUSDT is offering a quick swing trade setup – Time your entries carefully! 🚀

BTC in clear down TrendBTC making lower highs and lower lows shows in clear down trend for last few days

Bitcoin (BTC): technical and fundamental analysis.📈 Technical analysis BTC/USDT
The price of Bitcoin dropped sharply following Donald Trump’s announcement of tariffs on imports from certain countries. The decline was halted by a major support block at the 91,000 level. Currently, BTC is holding below the 200 EMA line and is positioned at the point of control of the value area. If buyers fail to establish a new support level in the 95,000–97,000 zone, we expect further downside and a retest of the 90,000 level. Should Bitcoin consolidate below this level, a full correction to the 0.61 and 0.78 Fibonacci levels is likely. These levels coincide with the 4H and 1D Imbalance zones, where significant gaps in horizontal trading volumes need to be filled through consolidations.
For Bitcoin to resume its upward trend, it must reclaim the 200 EMA dynamic resistance and hold above the psychological level of 100,000. In this case, we would expect further growth, with a retest of the 108,000–110,000 resistance block and a potential new all-time high.
📉 Bitcoin market global analysis.
On the daily logarithmic chart, a reversal pattern—Double Top—is forming. However, it will only be confirmed upon breaking its support line at the 90,000 level and consolidating below it. A divergence on the RSI indicator also suggests a high probability of a continued correction. During Bitcoin’s rapid growth in November 2024, an Imbalance 1D zone formed in the 77,000–85,000 range, featuring significant gaps at horizontal trading volume levels that need to be filled through consolidations.
Once the correction is complete, Bitcoin’s next price target could be the global trendline, drawn based on the two peaks of the previous growth cycle. This trendline may be tested around the 120,000 level, as confirmed by the analysis of large order blocks in exchange order books.
💠 Analysis of liquidity zones and levels
The Fear and Greed Index is in the neutral zone at 49.
The total cryptocurrency market capitalization has fallen to $3.08 billion, while the Bitcoin Dominance Index has risen to 61.82.
According to the analysis of the accumulation of large order blocks in the exchange order books, the supply and demand zones are located at the following levels:
🟢 Demand zone: 85,000 - 90,000
🔴 Supply zone: 100,000 - 120,000
Levels for long positions:
90,000 - 92,000 - large support block
87,000 - 88,000 - large support block
80,000 - large support block
77,000 - large support block
Levels for short positions:
105,000 - large resistance block
110,000 - largest resistance block
120,000 - ascending resistance trend line
📊 Fundamental analysis
After Donald Trump announced tariffs on imports from Mexico, Canada, and China, the crypto market experienced a sharp crash. Bitcoin's (BTC) price dropped to levels near $90,000, leading to the largest liquidations in history, totaling $2.2 billion. On the same day, news emerged that the leaders of Canada and Mexico had reached an agreement with the U.S. president to delay the implementation of the tariffs. This contributed to a partial recovery in cryptocurrencies, but the market has yet to stabilize. The number of large investors (holding more than 1,000 BTC) has not fully recovered, and large-scale accumulation has not resumed completely. It may take up to two months for the market to recover.
However, Trump’s recent executive order to establish a national Bitcoin reserve could alter Bitcoin’s market cycle. The current Bitcoin cycle is more stable than previous ones, with realized losses remaining relatively small during pullbacks. This can be attributed to a more informed investor base and the growing role of institutional players in BTC. Net capital inflows into BTC have already exceeded $850 billion, while the average daily trading volume is around $9 billion. The market capitalization of the leading cryptocurrency is currently estimated at $2 trillion, making it the seventh-largest asset in the world—surpassing silver and companies like Saudi Aramco and Meta.
Bitcoin’s future growth depends on the Federal Reserve’s monetary policy and U.S. regulatory actions. If the government adopts a crypto-friendly stance, the price could rise. Otherwise, resistance from regulators could trigger a correction.
🌐 Upcoming Events in the Global Economy
We expect increased volatility in both stock and cryptocurrency markets on the following dates:
➤ 07.02, 16:30 - U.S. Unemployment Rate (Jan)
➤ 12.02, 16:30 - U.S. Core Consumer Price Index (CPI).
➤ 27.02, 16:30 - U.S. GDP (QoQ) (Q4).
➤ 19.03, 22:00 - New Fed Interest Rate Decision.
🚀 Statistics of signals from our AI trading indicator:
📈 In January 2025, the Bitcoin price again updated its historical maximum, then a correction began. Our trading indicator gave 6 signals with the most profitable entry points and minimal risk. Thanks to the latest updates, all signals became profitable, and the built-in protection against flat prevented losses from manipulative market movements.
- Total price movement for all signals for the month: + 38.21%
- Maximum price movement for one signal: + 13.31%
- Average price movement for signals: + 6.36%
In addition, I would like to share the forecast of the latest Bitcoin price action by our AI, which not only indicates the direction, but also builds the trajectory of further price movement:
