BTC m15+h1 continues find signal ShortPrice is in range and continuously decreasing, continue to look for sell signals at time M15+h1, price target is to break the range and go down
Crypto market

BTC pattern Reverse N_stopOn time D1 we see BTC is in a price range, and also see divergence on D1, currently priority is to short when the price recovers on small times like M15

Bitcoin 93900-92500 support area,98000,100500 upside Target Disclaimer -
This information is only for educational purposes, this is not for any buy or sell recommendations .
On Our Harmonic pattern indicator
based trade setup take trade as explained below :-
ENTRY -
When price breaks Trailing SL (SL 27.2 % )retracement Which is SL points then take Entry on Buy or Sell Trade
SL -
D points Which is recent High / Low mentioned in Chart is our SL
TARGET -
Target 1- (T1 : 38.2)
Target 2- (T2 : 50 %)
Target 3- (T3 : 61.8%)
Target 4- (T4 : 78.6%)
Please note:-
It's working on news based and volitile market very well so exit if SL hit

BTCUSD Analysis on(23/12/2024)BTCUSD UPDATEDE
Current price - 94600
If price stay above 90500,then next target 98500,130500 and below that 87000
Plan; if price break 94500-92000 area and above that 94500 area,we will place buy oder in BTCUSD with target of 98500 and 103500 & stop loss should be placed at 90500

A plan SHORT for BTC
1. I saw a "Break Down cloud" - follow trend signal on the chart in Time Frame M15
2. I saw Main Trend on M15 timeframe showed that : main trend = DownTrend
3. I saw Main trend on H1 - M30 - M15 also : Downtrend
Conclusion:
Setup a SHORT plan with RR= 3 BINANCE:BTCUSDT.P
Entry Zone : From 97300 to 97900
Target : 92699
Stoploss = trailing SL with the Cloud trending system SL on M15 TF.

BTC - 102, 104 ?In my opinion BTC is still Bullish and expecting a parabolic up move anytime soon. one news or other coming and loose hands booking profits while big hands slow silently buying and not in a hurry. In chart shown the false breakout of resistance line which I think is for grabbing liquidity.
Still price is inside loudspeaker lines price will keep rising and falling till anyone of this line breaks.


UPDATE to "Did BTC Crash or Bullish Move"On the longer Term timelines, Bitcoin is still strong and recovering from its push higher but sadly for us, It lost that support line mentioned in the previous post witht he title above
The Chart Below shows this clearly
This is the 4 hour chart
We can see how PA kept testing and retesting that line of support but eventualy fell through but what is still Bullish is how PA broke through that descending line of resistance.
That takes away one problem but we have at least 2 strong lines of resistance above now AND RSI is overbought and so, I think we can expect further Dips and at the very least, a Longer Term range, as we did from March to September this year.
The Weekly MACD is in a very simialr position as it was back then, OVERBOUGHT but lower timeframes are neutral or below and so some strength is found.
We are , on average, still in ACCUMULATION with small pockets of Distribution as we have seen over the last couple of days. But Accumulation is certainly the trend that continues
I am beginning to doubt a New December ATH and I am expecting January to be RED and so, now I am looking to that MARCH ATH as more realistic possibility
But, this is BITCOIN.........Anything can happen

SOL Crash Soon..SOL High Selling Pressure ...Wait For PullBack For Short..
When should we go long on Sol? It is likely to experience a pullback in Sol when BTC reaches 3355. Once BTC starts to drop from 3355, Sol will move upwards. This will be a chance to open a short position, and for those who have long positions, it will be time to close them.

Accuracy of Weekly Swing Zones on Bit Coin ChartOur trading style emphasizes patience and precision. We only trade when the price reaches a key zone, observing for consolidation, reversal, or breakout/breakdown signals. Once these conditions are met, we take trades in the direction of the price. We avoid trading at random prices, prioritizing high-quality setups. With this approach, we aim to place small stop losses and target larger gains, focusing on fewer but more accurate trades.
This is how we can take trade using this zones .

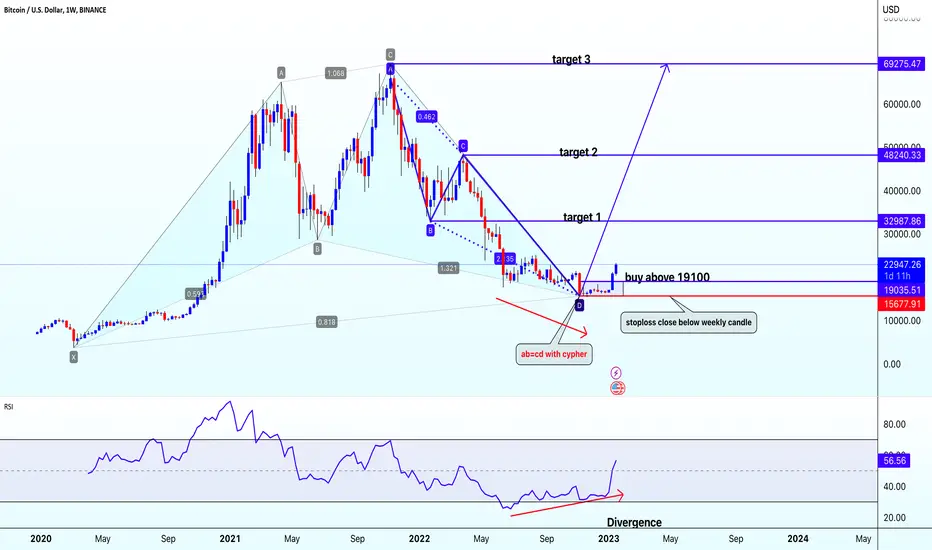
BTCUSDBtcusd
creating cypher harmonic pattern with ab=cd on chart with divergence @ bottom .chart also breakout inside candlestick pattern on daily chart
buy btcusd abpve 19100
closing sl below 15677
target=32980-48240-69275-100000
The altcoin correction may be over!On the daily timeframe, TOTAL2 has completed an ABC correction, retracing to the 0.5 Fibonacci level and the 0.382 Fibonacci time ratio. Anticipating a minimum of a three-wave advance.

BTCUSD 4 HR ANALYSIS | SHORT TRADE🚀 Bitcoin (BTC) Price Analysis - 4-Hour Timeframe 📊
Chart Overview:
Current Price: $96,935.44
Timeframe: 4-Hour chart
Date Published: December 20, 2024
Key Features:
Trend Channe l: The chart illustrates a red ascending channel that represents the previous upward trend in Bitcoin’s price.
Support and Resistance Levels:
Resistance Level : Identified at $99,612.38
Support Level : Identified at $89,438.39
Price Movement : Recently, there has been a significant price drop depicted on the chart.
Potential Drop: A green arrow indicates a potential price drop of 9.30%, equating to -$9,171.21.
Discussion Point : The chart poses the question, “Can Bitcoin drop 10% from next week (23 Dec 2024)? Comment what you think?
Analysis :
The ascending trend channel suggests that Bitcoin has been in an upward trend.
The recent price action shows a breach of this channel, hinting at a possible trend reversal.
Key support at $89,438.39 needs to be monitored, as a break below this level could confirm further downside.
The potential 9.30% drop indicates market uncertainty, potentially leading to a larger correction.
Conclusion: Monitor the key support and resistance levels closely. The breach of the ascending channel and the significant price drop could suggest a trend reversal, warranting caution for bullish positions. Stay tuned for updates as we approach the critical date of December 23, 2024.
Note - This is Only for education purpose.
Follow and give Like

Is BTC correcting then Not goes below 85-80k Zone, Target 125k+BTC correcting healthy and the last bottom was exactly above 90k if not break then 125k confirm in Jan 25 if break til 85-80k zone then 140k will be the next target.

Hbar Playing the Strength Hbar has strong buyers since the start of current BullRun, trade setup 2H TF entry 30M TF.
Start of OG style Alt Session.

Hbar Playing the Strength Hbar has strong buyers since the start of current BullRun, trade setup 2H TF entry 30M TF.
Start of OG style Alt Session.

BTCUSD LONG TERM BEARISH!!!Crypto is possible to crash 20/30% minimum very soon! Big players gonna dump it rebuying will be from the key levels I have marked. I’m strongly bearish!!!
Note:- remember crypto will crash 💯

Just a random Elliot Wave analysisJust a random Elliot Wave analysis of BTCUSDT on the 1-hour timeframe. Key levels are highlighted: resistance at $99,618 and support zones at $94,531 and $91,247, with a major support at $82,800. The chart depicts completed impulse (1-5) and corrective (ABC) waves, followed by another wave cycle in progress. The EMA (21) aids trend direction. Watch for potential reactions near the support levels as the price approaches wave 5.

Short trade Ethereum.A trade idea based on my trading knowledge and market behavor.
I'm anticipation a retest on what what the double tiop previous support at 3480-3640 area.
Once we test it as resistance we will start a last wave downwards toward 3000-3100 area where I will anticipate we will start to go sideways untill the end of year.

Btcusd analysishello
It seems that after a correction to the level of 85,000, Bitcoin will manage to touch about $150,000 with its next Saudi round.
This is my personal opinion, please do not base this opinion on your trade and try to proceed with your own analysis.
Thanks

Btcusd analysishello
It seems that after a correction to the level of 85,000, Bitcoin will manage to touch about $150,000 with its next Saudi round.
This is my personal opinion, please do not base this opinion on your trade and try to proceed with your own analysis.
Thanks

BTC - T1 - 104000Previous prediction of taking support from lower side of the loudspeaker pattern worked out well. V shaped recovery and showing Cup & Handle pattern now. Breakout of neckline is also coinciding with resistance line of the current fall Hope current pattern take out the resistance and move up to the immediate target of 104K first.

ETHUSD buy on dip near 3350 , upside Target on chartDisclaimer -
This information is only for educational purposes, this is not for any buy or sell recommendations .
On Our Harmonic pattern indicator
based trade setup take trade as explained below :-
ENTRY -
When price breaks Trailing SL (SL 30 % )retracement Which is SL points then take Entry on Buy or Sell Trade
SL -
D points Which is recent High / Low mentioned in Chart is our SL
TARGET -
Target 1- (T1 : 50)
Target 2- (T2 : 61 %)
Target 3- (T3 : 78%)
Target 4- (T4 : 100%)
Please note:-
It's working on news based and volitile market very well so exit if SL hit
